
Upwards movement was expected to end either yesterday or very soon.
This upwards movement for Wednesday was unexpected but does not yet invalidate the main Elliott wave count.
Summary: Price is squeezed between the final bear market trend line and a short term support line (now coloured green on all charts for clarity). A break above the cyan line or below the green line is required. The bear wave count is favoured and better supported by volume analysis; this upwards movement is weak and should be expected to end here or very soon. The bull wave count still comes with the strong caveat that we have zero confirmation of a super cycle degree trend change from bear to bull for gold.
New updates to this analysis are in bold.
Last published weekly charts with the bigger picture are here.
MAIN BEAR ELLIOTT WAVE COUNT
Click chart to enlarge.
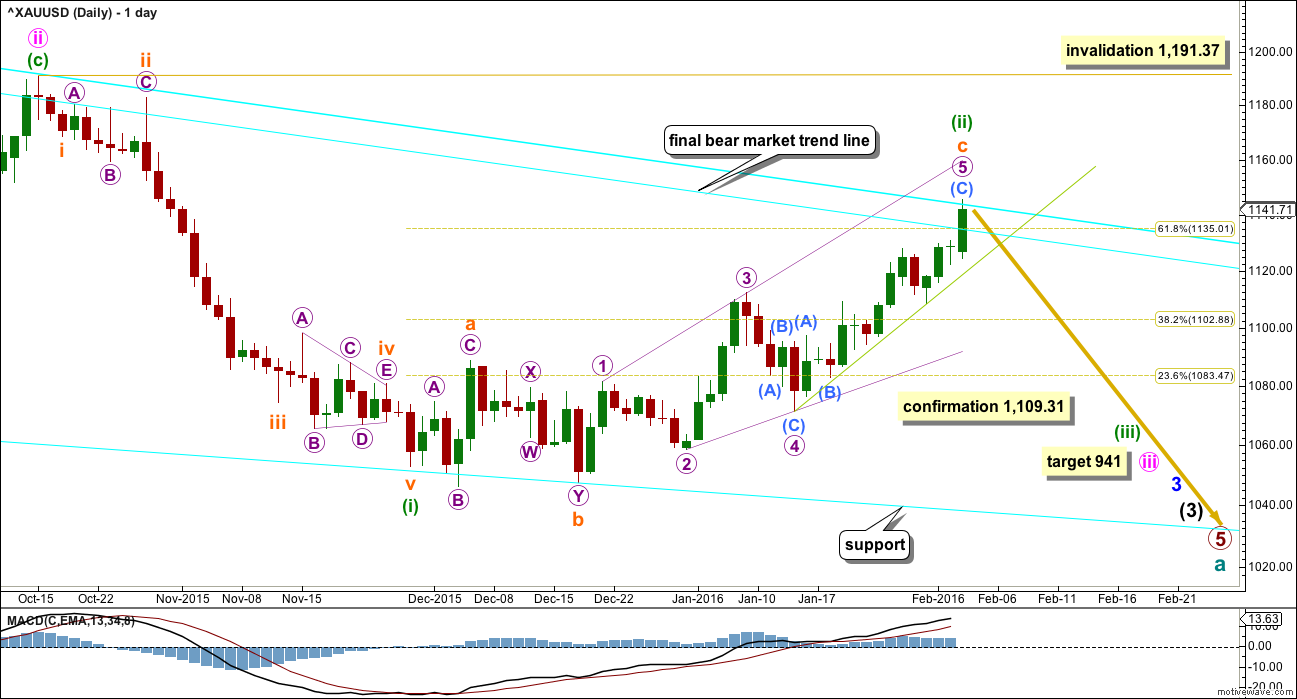
Gold has been in a bear market since September 2011. There has not yet been confirmation of a change from bear to bull, so at this stage any bull wave count would be trying to pick a low which is not advised. Price remains below the 200 day moving average and below the cyan trend line. The bear market should be expected to be intact until we have technical confirmation of a big trend change.
The final line of resistance (cyan line copied over from weekly charts) is only overshot and not so far properly breached. Simple is best, and the simplest method to confirm a trend change is a trend line.
Minute wave ii is a complete zigzag and deep at 0.73 the length of minute wave i.
At 941 minute wave iii would reach 1.618 the length of minute wave i.
Minuette wave (i) is complete.
Minuette wave (ii) looks like a fairly typical expanded flat correction which may have ended just above the 0.618 Fibonacci ratio at 1,135.
Subminuette wave c may be a complete ending expanding diagonal.
Price has overshot the final bear market trend line. This has happened before at the high labelled minute wave ii at the top left of the daily chart. That correction overshot the bear market trend line by over $8 yet price turned down to make new lows. The trend line must be properly breached for this wave count to reduce in probability. A proper breach would be a full daily candlestick above the final bear market trend line and not touching it. I would prefer to see a breach at the weekly chart level for full confidence in a trend change at super cycle degree. If that happens, this bear wave count would be discarded.
We should assume the trend remains the same until proven otherwise. We should assume the bear market remains intact while that line is not properly breached.
I have created a parallel copy of the final bear market trend line today and placed it on the high of minute wave ii, top left of the chart at the prior overshoot. The daily candlestick for today may find some resistance at this parallel copy.
Tomorrow should see a red daily candlestick for this bear wave count and price return below the bear market trend line.
I added an important trend line which is currently offering support to current upwards movement to this daily chart. The trend line is coloured green (to differentiate it from the cyan bear market trend line). It is vital that this green line is clearly breached by downwards movement before confidence may be had that minuette wave (ii) is over. Price remains above this line. If this line is breached by downwards movement, that shall be strong confirmation that upwards movement is over.
At this stage, a new low below 1,109.31 would invalidate the alternate wave count and provide strong price confirmation for this main wave count.
Click chart to enlarge.
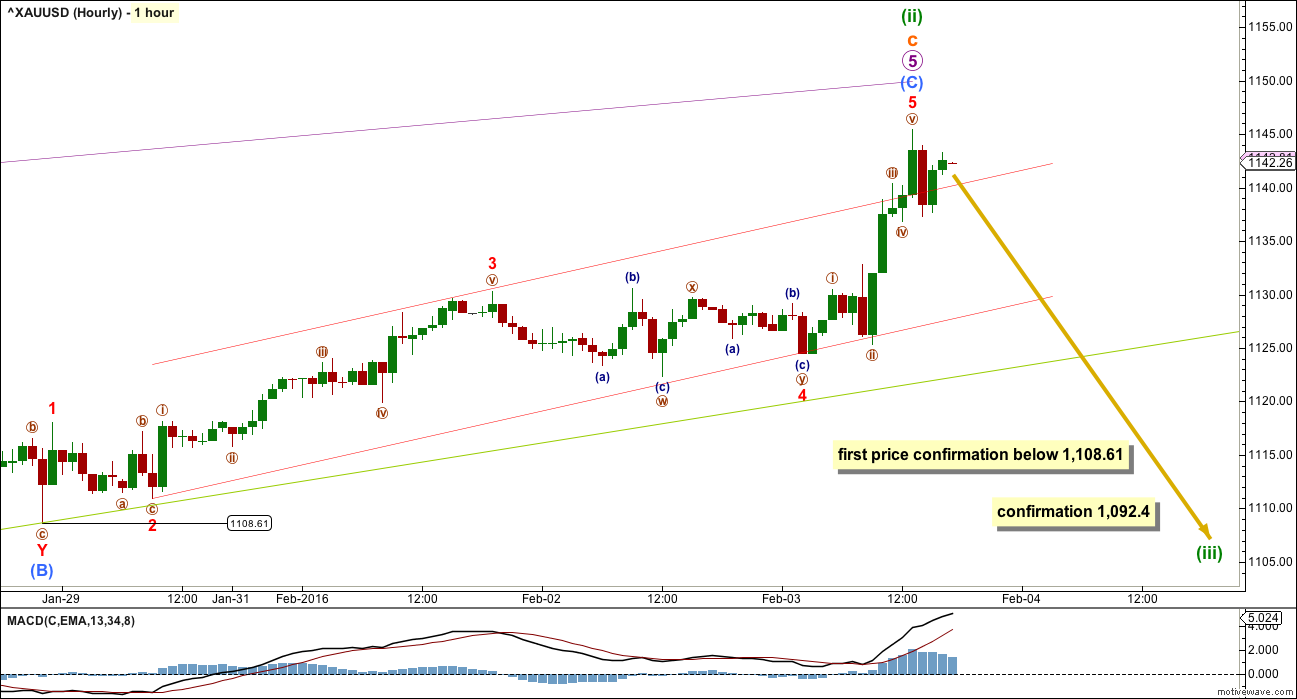
Gold often exhibits swift strong fifth waves. Upwards movement for Wednesday looks like a strong fifth wave, typical of commodities.
Submicro wave (C) is now 1.82 longer than 0.618 the length of submicro wave (A). The structure within submicro wave (C) again looks complete.
Ratios within submicro wave (C) are: there is no ratio between minuscule waves 3 and 1, and minuscule wave 5 is 1.59 longer than equality with minuscule wave 3.
It is very important that price breaks below the green trend line for confidence that minuette wave (ii) is over. A clear breach of that line by downwards movement would provide trend line confirmation that the upwards wave of minuette wave (ii) should be over and the next wave down to new lows should be underway.
The risk is that the bull wave count could be correct while price remains above that line at this stage.
The invalidation point will remain where it is at the daily chart level while there is no confirmation of a trend change and the end of minuette wave (ii). Minuette wave (ii) could continue higher. It may not move beyond the start of minuette wave (i) above 1,191.37.
ALTERNATE BULL WAVE COUNT
Click chart to enlarge.
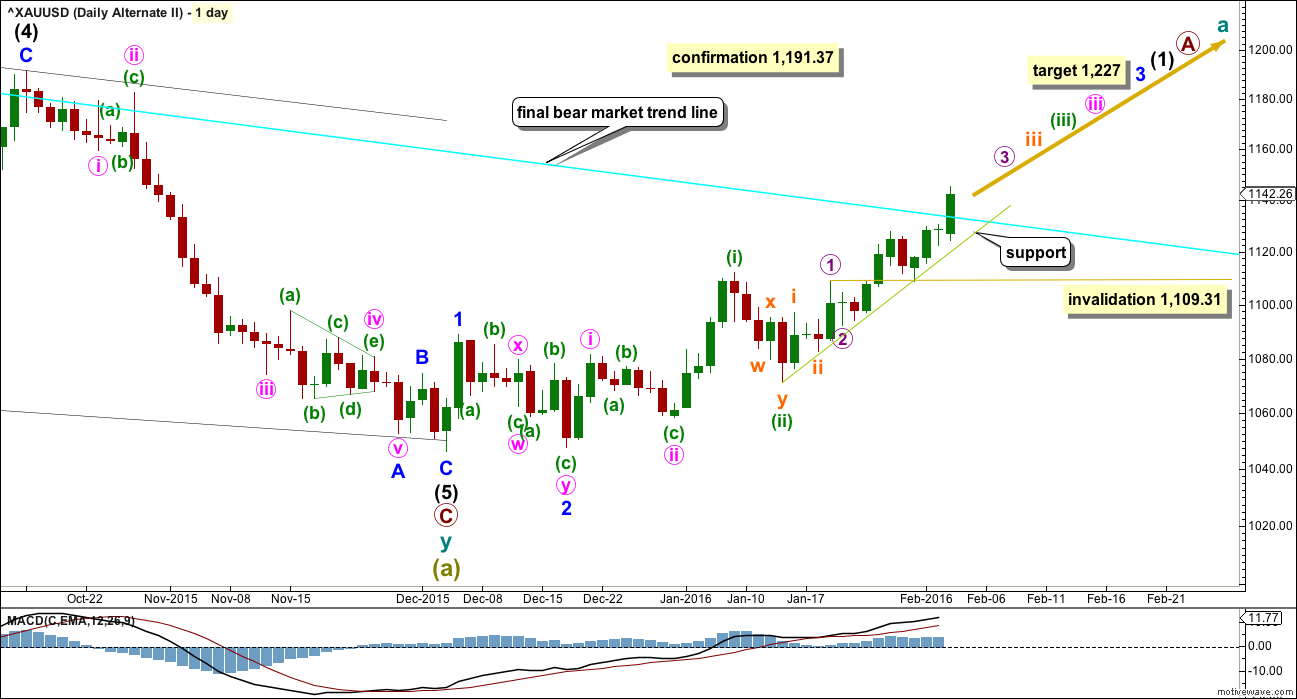
This was published here as a second alternate wave count. I will use it as the only regular alternate bull wave count because it is the only bull wave count to meet all Elliott wave rules.
I want to remind members that last time Gold saw a reasonable upwards movement from 24th July, 2015, to 15th October, 2015, there were many who expected that rise meant the bear market had ended and a new bull market had begun. It turned out that idea was premature: price turned around and made new lows. On 21st August I developed three bullish wave counts, partly in response to a demand from members, and one by one they have all been eliminated.
Now, again, price rises and there is a demand for bullish wave counts.
It is my strong view that this is premature. I will publish this wave count with that strong caveat.
Eventually the market will change from bear to bull, and when that change is confirmed that is the time to have confidence in a bull wave count. That time is not now.
Price is closing above the 200 day moving average today. It has done this before and yet turned back down to make new lows. This alone is not enough confirmation of a big trend change from bear to bull.
Price has made a series of lower highs and lower lows down to the last recent low. There is not a clear five up on the daily chart.
Price is closing above the final bear market trend line today. Again, it has done this before yet turned back down to make new lows. A clear breach of this line is required to confirm this bull wave count. If we see a full daily candlestick above that line and not touching it in the next few days, then this bull wave count shall be preferred.
Downwards movement from the all time high for this bull wave count is seen as a big double zigzag which would most likely be complete at super cycle degree for an A wave.
When an A wave subdivides as a three, then the larger structure may be either a flat or triangle. The B wave may make a new price extreme beyond the start of the A wave within flats and triangles. Here, super cycle wave (b) may move above 1,920.18 as in an expanded flat or running triangle.
When the first move of a larger correction subdivides as a multiple (w-x-y), then a combination may be eliminated. Combinations may not have multiples within multiples, because that would increase the number of corrective structures within a multiple beyond three and violate the rule.
A new wave up at super cycle degree must begin with a clear five up on the daily chart (and probably the weekly as well). So far only minor waves 1 and 2 are complete. At 1,227 minor wave 3 would reach 4.236 the length of minor wave 1.
Minute waves i and ii are complete within minor wave 3.
Only submicro wave (1) may be complete within micro wave 3. This is shown on the hourly chart.
When micro wave 3 is over, then micro wave 4 may not move into micro wave 1 price territory below 1,109.31.
Gold often exhibits swift strong fifth waves, particularly the fifth waves to end its third wave impulses. Be aware of this tendency, because it could mean that any one of or more than one of micro wave 5, subminuette wave v, minuette wave (v) and minute wave v could be very strong upwards movements. If this is the case, then for this wave count it would take price comfortably above the final bear market trend line. If that happens, then this wave count would be the preferred wave count.
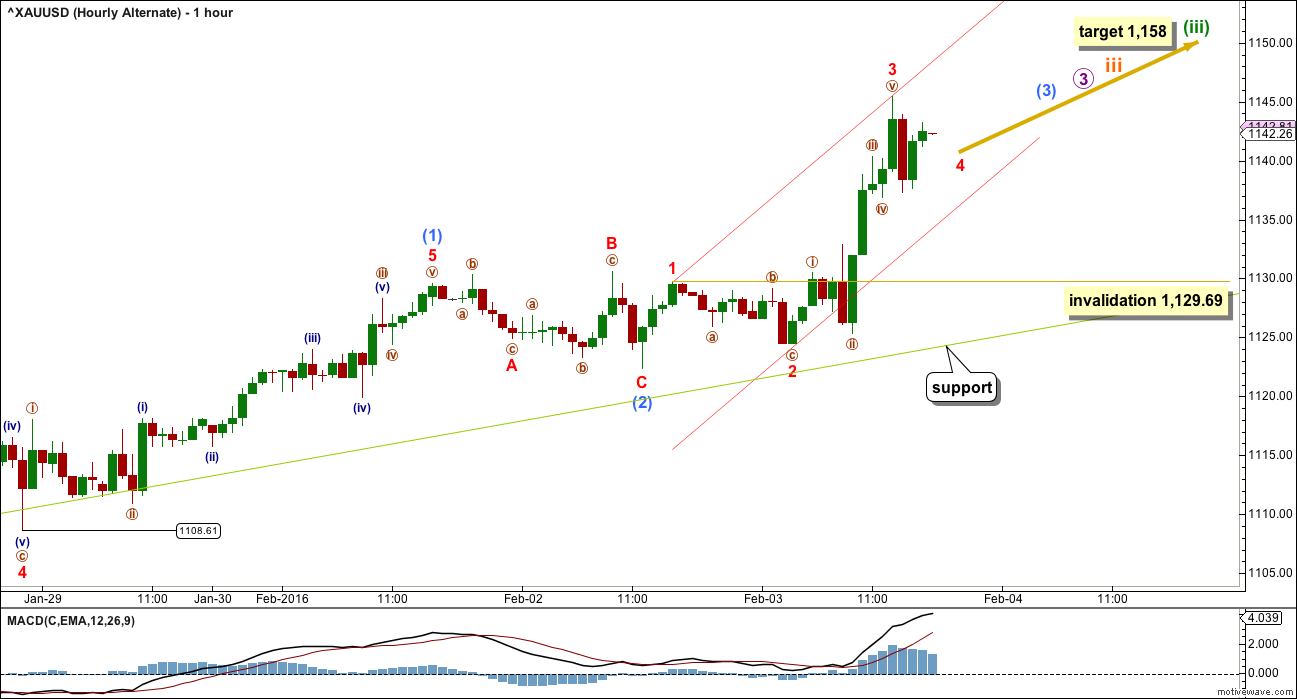
The hourly chart for this alternate today will show the same piece of movement as the main hourly chart.
Click chart to enlarge.
The middle of the third wave may have just passed for this alternate wave count.
Minuscule wave 4 may not move into minuscule wave 1 price territory below 1,129.69 within sub micro wave (3).
At 1,158 minuette wave (iii) would reach 1.618 the length of minuette wave (i).
Along the way up, this wave count expects price to find strong support at the green trend line. This third wave should show a steeper slope; the slope should not reduce. If price breaks below the green line, the probability that a big third wave is continuing would be greatly reduced.
TECHNICAL ANALYSIS
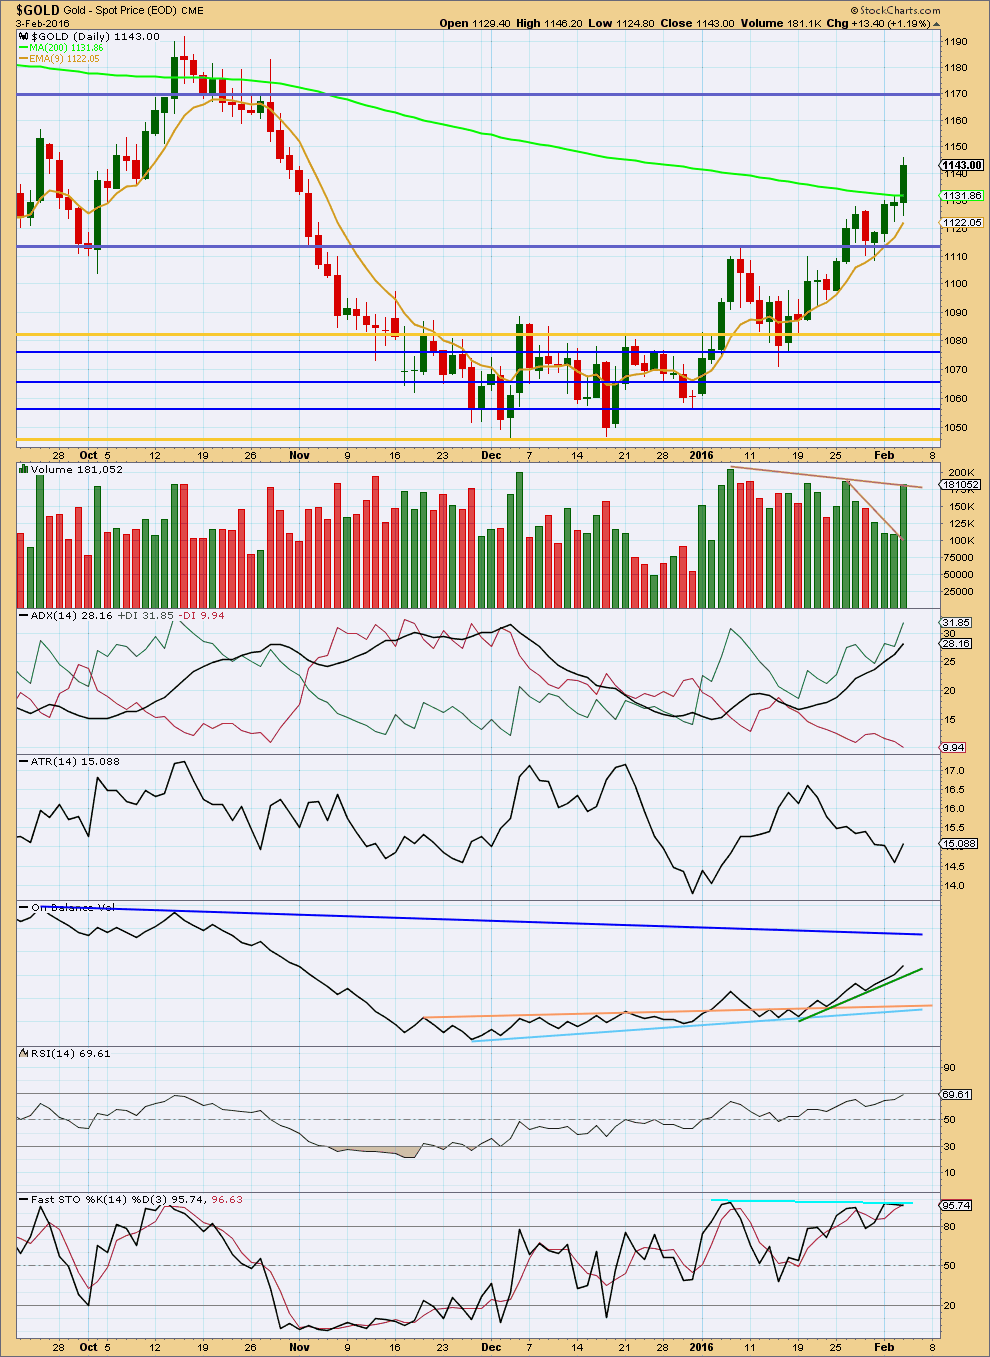
Click chart to enlarge. Chart courtesy of StockCharts.com.
Gold often exhibits swift strong fifth waves which end with a volume spike. Today’s rise in price was supported by volume. This could be the middle of a big third wave, but it may also be a volume spike to end a movement.
ADX still indicates there is a trend and it is upwards.
ATR overall disagrees, but today saw an increase for ATR.
RSI is not quite overbought, but it is close.
Stochastics shows strong divergence with price today: as price made a new high Stochastics was flat. This indicates weakness in price despite strong volume. This supports the bear wave count.
Overall, the bear wave count is still supported over the bull, but the picture is still unclear.
Price has closed above the 200 day moving average. It has done this before and yet turned down to make new lows. This could happen again. If price continues higher and there is at least one full daily candlestick above the 200 day moving average, then the probability of the bull wave count would increase and the bear would decrease.
This analysis is published @ 07:14 p.m. EST.
Hi..I am new here. I wish Lara suggest her strategy by state her entry point and exit. How do I interpret his analysis
This service is analysis only, it is not a signal service. It will not offer entry and exit points, I am not able to do that because I am not a registered investment provider.
I am a CMT and so I can offer my technical analysis, Elliott wave is my specialty.
If you are new to trading then I strongly suggest that this analysis service may not meet your needs. This analysis service is designed for more experienced traders.
If you wish to learn Elliott wave and technical analysis then you will learn that here.
My short term analysis so far expects a small correction for micro 4 may begin about here.
For those of us not yet positioned this may offer an entry point to join the trend. That is what I’ll be looking for.
Short term put a trend line on todays upwards movement. If that is breached to the downside then look out for a small fourth wave.
My system has no signal yet to go short from 4 to 5. However, it looks like touching a resistance / trend line?
Lets see what Lara has to offer.
weekly gold shows 2 resistance lines
Beautiful chart! Thanks for sharing.
Lara, I apologize (for starting up the ping-pong match again), I know you are decided upon today’s movement as a clear breach of the bear market trend line; however, if I use the October 2015 highs for the trend line in lieu of the January 2015 high then today’s candle is not a complete breach. Comment?
I think the overshoot for October 2015 was advance warning.
Now we have a breach of the trend line as I have drawn it, I am very reluctant to draw it fresh and make it more shallow.
What I am going to do is hold onto the bear wave count as a possibility until the trend line is breached at the weekly chart level.
That should be enough to eliminate doubt about the trend change.
Even with your suggestion of how to draw the line todays candlestick is mostly above it. Tomorrow should give a breach of that more conservative line, price has closed near the days highs.
Unless of course tomorrow sees a big downwards move.
Finallyyy… 🙂
This will now be the main wave count.
Minuette wave (iii) is incomplete, I can’t see a complete structure yet on the hourly chart for this impulse.
Look out for swift strong fifth waves up.
New target for minuette (iii) is 2.618 X minuette (i) = 1,212
The next multi day correction to come should be minuette (iv) and it’s not here yet.
Along the way up I’d expect to see two smaller fourth waves for micro 4 and then subminuette iv, but remember Gold’s tendency to exhibit swift strong fifth waves which often force it’s fourth wave corrections to be remarkably brief and shallow.
And so the fourth waves of micro 4 and subminuette iv may show up on the daily chart (offering a good entry point to join the trend) but they may not. Sometimes this has surprised us in the past, I don’t want us to be surprised again.
Look out, an increase in upwards momentum should be expected ahead. The trend is up.
I will be using the new steeper lilac line as my first opportunity to join this trend. If price comes down to touch that I’ll enter a buy.
If price touches the green line again I’ll enter a buy.
If we see a red daily candlestick I’ll enter a buy.
That’s my strategy anyway for this market at this time, now we have a trend change confirmed by that bear market trend line.
Lara is the 1158 minuette wave (iii) target still in force?
Gold just hit 1157.37.
How deep and long of a correction might we expect at this point and may it start today?
I think the target was too low Richard. I am struggling to see minuette (iii) complete. It needs a higher target now.
1,212 is the next ratio, 2.618
Wow 1212 !
Gold just got a new high of 1157.37 at 1:29 pm.
Gold bulls have gone wild this week.
And it looks like we will have a full daily candlestick above the final bear market trend line and not touching it.
That is my line in the sand for these two wave counts.
The bear will be now relegated to an unlikely alternate, the bull will now be the main wave count.
I will continue to publish the bear until it just looks too ridiculous, or is finally invalidated by price.
Okiess..
Lara but you dint sound confident about the bull wave counts in your comment above i guess…
If it is so…can u share the view
Need a weekly breach for more confidence.
It’s a good solid breach.
I’ll hang onto that bear wave count until we have a full weekly candlestick above that line.
But the balance of probability shifts today. And now the possibility that Gold is in the middle of a big third wave up is more likely than not.
I will be looking for an entry to buy, on the next red daily candlestick or next touch of a support line.
I’d look to buy there as well.
We are approaching your 1,158 minuette iii target — is the 1158 a target price that will need to be revised or are we genuinely near minuette iii completion? can you provide clarity on the smaller movements at this time as I am looking to re-enter long, or possibly inverse long the correction/channel re-test.
You know we will all be looking forward to your end of week weekly update 🙂 Finally we got to where gold can’t keep us guessing anymore — ARE YOU KIDDING???? A “B” wave! lol 🙂
IKR, I hate B waves. They are just the worst.
This means multiple alternate wave counts sometimes for the next one to several years 🙁
I too am looking now for my entry and will share that process. The next red daily candlestick or touch of a support line.
ah, lil frowny face, will be very busy.
Thanks much for sharing your process with us.
The target at 1,158 is too low, minuette (iii) is incomplete.
New target 1,212
… with 1148-44 holding, looks like 1163-73 range wont be hard to fetch…
Any wave counts gold?
Also US markets starting going from negative to positive.
Alesondro
EW channels are drawn : connect wave 1 and wave 3 and draw parrallel line from wave 2.
On different time periods like daily, weekly and Monthly if you draw the lines will be sloping different.
PM wave 2 is correct.
I just checked the weekly chart cyan line. Gold is way above for several day s now. Clock on weekly chart in the report above.
Papodi, yes I known how to draw channel with Elliott, the trend line as draw has been breach, for this, Lara has draw a new upper trend line (cyan) and if you look this with attention on the Lara weekly chart, you can see that it is different from yours.
Regarding wave 2 ….you labeled it as abcdef, but triangle is not permitted in wave 2.
Ciao
Please post your chart. Thkx
I’am writing from an iphone, but the chart is the Lara’s weekly chart
The peak of 1309 touch the Lara’s trend (cyan) but breach your trend
I found the difference. Lara drew another trend line connecting wave 2 and int wave 2 cyan line which is higher. Yes.
Alessandro, that line is simply a copy of my final bear market trend line.
And to see how to draw that line (semi log scale) see the weekly charts. The two price points to use are noted.
I do link back every day to last analysis which shows weekly charts.
Lara: it appears gold has broken out from upper EW channel trend line from 2011.
Is this correct?????
Yaa it is…
But gold must not retreat back to the line before closing…this is what lara meant…a full daily candlestick…closingg
The upper trend line is not correct, this is the parallel of 1-3 trend line, but Lara draw a new trend line from 1790 to 1309.
Also the labeling for eave 2 is incorrect….. Triangle is not permitted in wave 2
What do u mean Allessandro
The trend line drew from Lara is not this….
Lara says:
“published weekly charts with the bigger picture are here.”
On the weekly chart you can draw the correct trend line starting from the pick at 1790 e touching the peak a 1309
Gold COT data was bullish on Dec 4 and there after and is still bullish. As gold has moved higher COT data shows large commercials are reducing shorts. Compared to last move higher short progressively increased.
Large commercial net short remains very low including % of open interest.
Gold daily chart shows the relationship of COT and gold price.
Rambus on gold, silver, and stock markets
http://rambus1.com/2016/02/03/wednesday-report-107/
US Dollar helped gold go up.
Downbeat U.S. economic data Wednesday led to a selloff in the greenback. That was an encouraging turn for oil and metals, as a weaker dollar makes them less expensive to buy for holders of other currencies.
Dollar Bears Awaken Before Jobs Report as BOJ-Stoked Rally Fades
http://www.bloomberg.com/news/articles/2016-02-03/dollar-bears-awaken-before-jobs-report-as-boj-stoked-rally-fades
Long term look at gold and silver
http://blog.kimblechartingsolutions.com/2016/02/goldsilver-attempting-to-break-3-year-falling-resistance/
Great
Again we find ourselves at a fabulous pivot point. Many of us have been members for years waiting for the bull market to resume. Exciting times! While I bought Dust and a starter GLD put position today, I will be ecstatic if we are finally back to a bull.
Good trading everyone!
Trader Dan on Miners, Gold, and currencies
http://traderdan.com/?p=9419
GDX broke through upside resistance of it’s large falling wedge pattern today on high volume, although the down day volume in July 2015 was still higher. In May 2015, GDX also broke above it’s falling wedge for 4 days, albeit on low volume. This breakout may be for real due to the high volume. GDX still remains below the 200 day MA and within its bear market channel. Like gold, it’s unclear if this was a blow off high for GDX or the start of a much higher move. GDX needs to turn down in the next couple of days for the bear case.
Exciting times! Thanks, Lara.
Been long April Futures since 1127. HOLDING LONGS . Position based on market sentiment and world economic factors plus 40 years experience trading the PM,s.
Well done!