
Upwards movement has now breached the final bear market trend line.
With confirmation of a trend change, the main wave count should now be bullish.
Summary: The final bear market trend line is now breached by a full daily candlestick above it and not touching it. This provides simple trend line confirmation of a trend change from bear to bull. Gold should now be in a bull market to last one to several years. The short term target for the next interruption to the upwards trend is now at 1,221. A third wave up should be unfolding, so look out for swift strong fifth waves to show an increase in upwards momentum.
New updates to this analysis are in bold.
Last published weekly charts with the bigger picture are here.
MAIN BULL ELLIOTT WAVE COUNT
Click chart to enlarge.
The final bear market trend line is drawn on weekly and daily charts on a semi-log scale from the price points as marked. This has now been breached by one full daily candlestick above it and not touching it. If this line is breached by a full weekly candlestick (the earliest that could be would now be next week), then all bear wave counts should be discarded.
For now this bull wave count will be the main wave count and the bear will be an unlikely alternate.
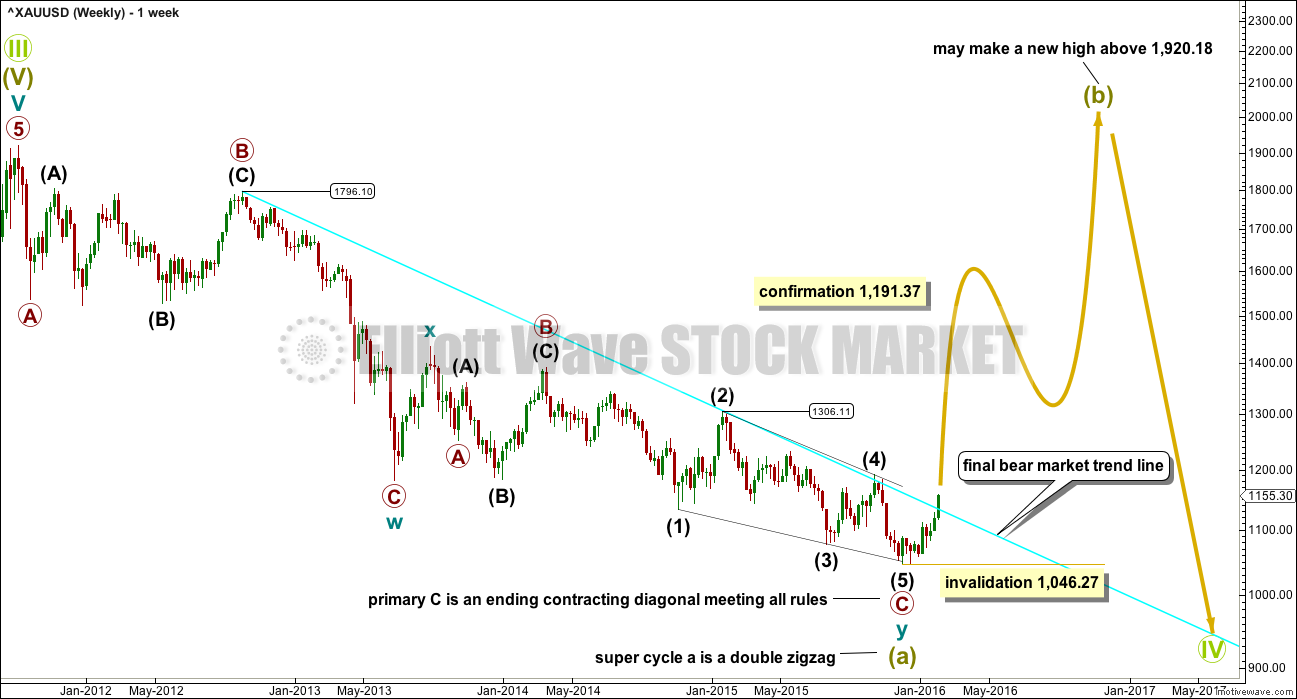
This downwards movement subdivides as a double zigzag from the all time high.
Within the first zigzag labelled cycle wave w, primary wave C is 10.13 short of 1.618 the length of primary wave C.
Within the second zigzag labelled cycle wave y, there is no Fibonacci ratio between primary waves A and C. Primary wave C is an ending contracting diagonal which meets all Elliott wave rules.
For this downwards movement this is the only wave count that I have been able to see so far which meets all Elliott wave rules.
Grand Super Cycle wave IV may not be a combination because the first wave subdivides as a multiple, and the maximum number of corrective structures within a multiple is three. To label multiples within multiples increases the maximum beyond three, violating the rule.
It may not be a zigzag because Super Cycle wave (a) subdivides as a three and not a five.
This leaves two groups of corrective structures: flats or triangles.
Within an expanded flat or running triangle, Super Cycle wave (b) may make a new high above the start of Super Cycle wave (a) at 1,920.18.
Within a flat, Super Cycle wave (b) must retrace a minimum 90% of Super Cycle wave (a) at 1,833.71.
Super Cycle wave (b) may be any one of 23 possible corrective structures. First, a move of this size should have a clear five up on the daily and weekly charts. That is still to complete. Within the first five up, no second wave correction may move beyond its start below 1,046.27.
Click chart to enlarge.
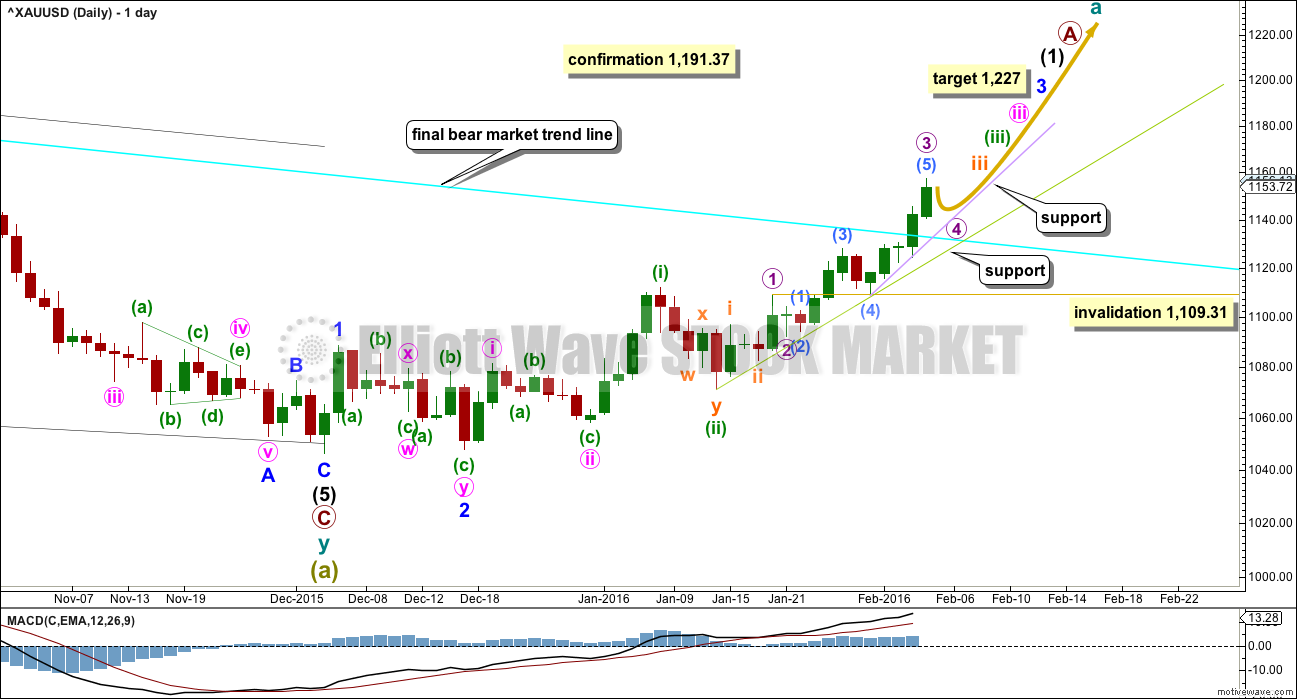
So far, within the first five up, the middle of the third wave is now most likely complete. The strongest move may yet be ahead. Gold typically exhibits swift strong fifth waves to end its third wave impulses. Look out for surprises to the upside for one or more of micro wave 5, subminuette wave v, minuette wave (v), minute wave v, and minor wave 5.
At 1,227 minor wave 3 would reach 4.236 the length of minor wave 1. If this target is wrong, it may not be high enough. Minor wave 3 may not exhibit a Fibonacci ratio to minor wave 1.
Within minor wave 3, minute waves i and ii are complete. Minute wave iii is incomplete.
Within minute wave iii, minuette waves (i) and (ii) are complete. Minuette wave (iii) is incomplete. Minuette wave (ii) was a time consuming and deep double zigzag which lasted 4 sessions. When minuette wave (iii) is complete, then the following correction for minuette wave (iv) should also be a multi day correction showing up clearly on the daily chart. This would be the next expected multi day interruption to the trend.
Within minuette wave (iii), subminuette waves i and ii are complete. Subminuette wave iii is incomplete. Subminuette wave ii lasted just 2 sessions and shows on the daily chart. Subminuette wave iv may be expected to last one to three sessions and also show on the daily chart. It may be more brief though; when Gold’s fifth waves extend they force fourth wave corrections to be more brief than usual.
Within subminuette wave iii micro waves 1 and 2 are complete. Micro wave 3 is most likely complete at today’s high, I have adjusted the labelling within it. At this stage, it looks like the impulse of micro wave 3 ended with a strong extended fifth wave for submicro wave (5).
Micro wave 2 was a quick deep 0.64 zigzag lasting one day (22 hours). Micro wave 4 may be expected to be shallow against micro wave 3, given the guideline of alternation, and to most likely be a flat, combination or triangle. If it is longer lasting than micro wave 2 (as these types of corrections tend to be), then it may last about two sessions. It may not move into micro wave 1 price territory below 1,109.31. The green trend line and the final bear market cyan trend lines should offer strong support for this correction.
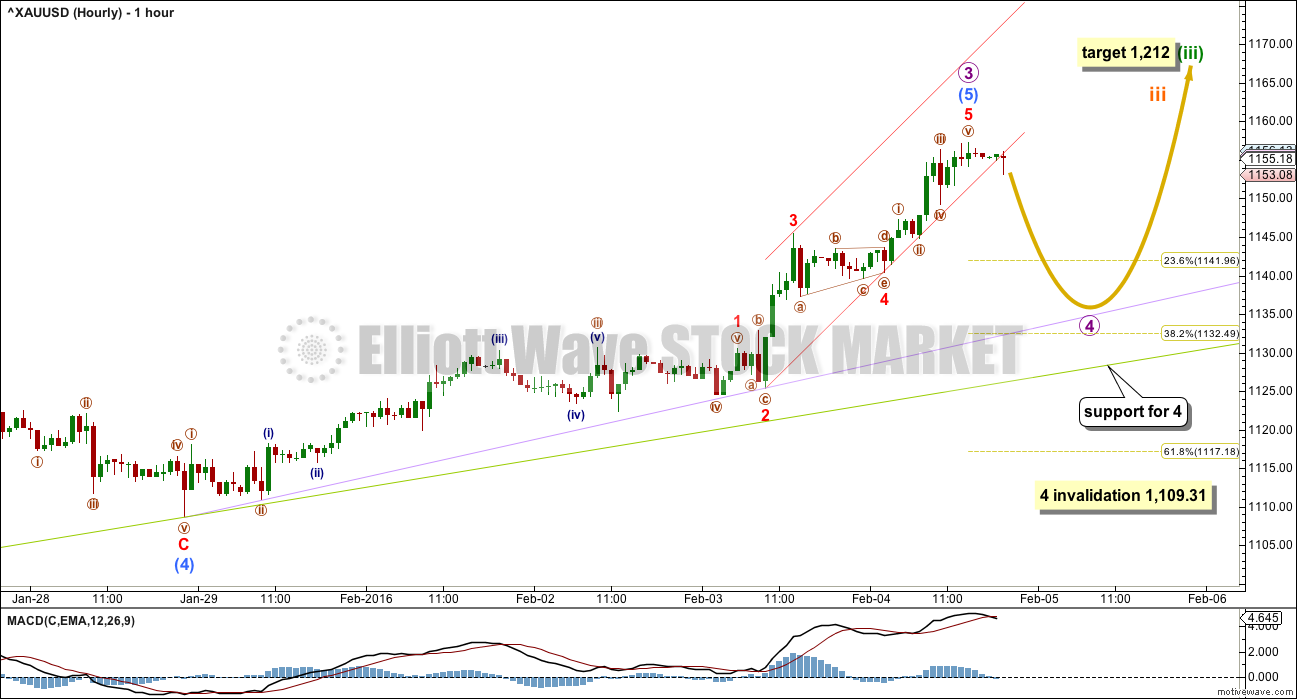
The hourly chart will show all movement from the low of submicro wave (4).
Click chart to enlarge.
Ratios, within the impulse of micro wave 3, are: submicro wave (3) is 2.19 longer than 2.618 the length of submicro wave (1), and submicro wave (5) is 2.13 longer than 1.618 the length of submicro wave (3).
Micro wave 3 is 4.69 short of 2.618 the length of micro wave 1.
Given these good Fibonacci ratios and the typical look of a strong fifth wave, I have confidence that the labelling of this impulse is now correct.
I have confidence that micro wave 4 should unfold lower and should show up on the daily chart as one to three red candlesticks, doji or a mix of the two.
When Gold’s fifth waves extend, then the next correction often ends within the price territory of the fourth wave within the extension. This gives a target zone for micro wave 4 of about 1,145.40 to 1,137.29. If it moves lower than this, then the 0.382 Fibonacci ratio may be a reasonable expectation.
Micro wave 4 may find some support at the lilac trend line. If it breaks through support there, then it should find strong support at the green trend line and also at the cyan final bear market trend line on the daily chart. I would not expect micro wave 4 to break below the green line.
Micro wave 4 may not move into micro wave 4 price territory below 1,109.31.
When the correction for micro wave 4 is complete, then the upwards trend should resume. Micro wave 5 may be a swift strong extension.
Micro wave 4 may be any one of 23 possible corrective structures. Analysis over the next day or so will not be able to tell what pathway price may take while it unfolds as that is impossible to determine. The focus will be on identifying when it is over. If it is an expanded flat, running triangle or combination, then it may include a new price extreme beyond its start above 1,157.27. A new high does not mean micro wave 4 is over but that it may be part of the correction. There is no upper invalidation point for this reason.
ALTERNATE BEAR WAVE COUNT
Click chart to enlarge.
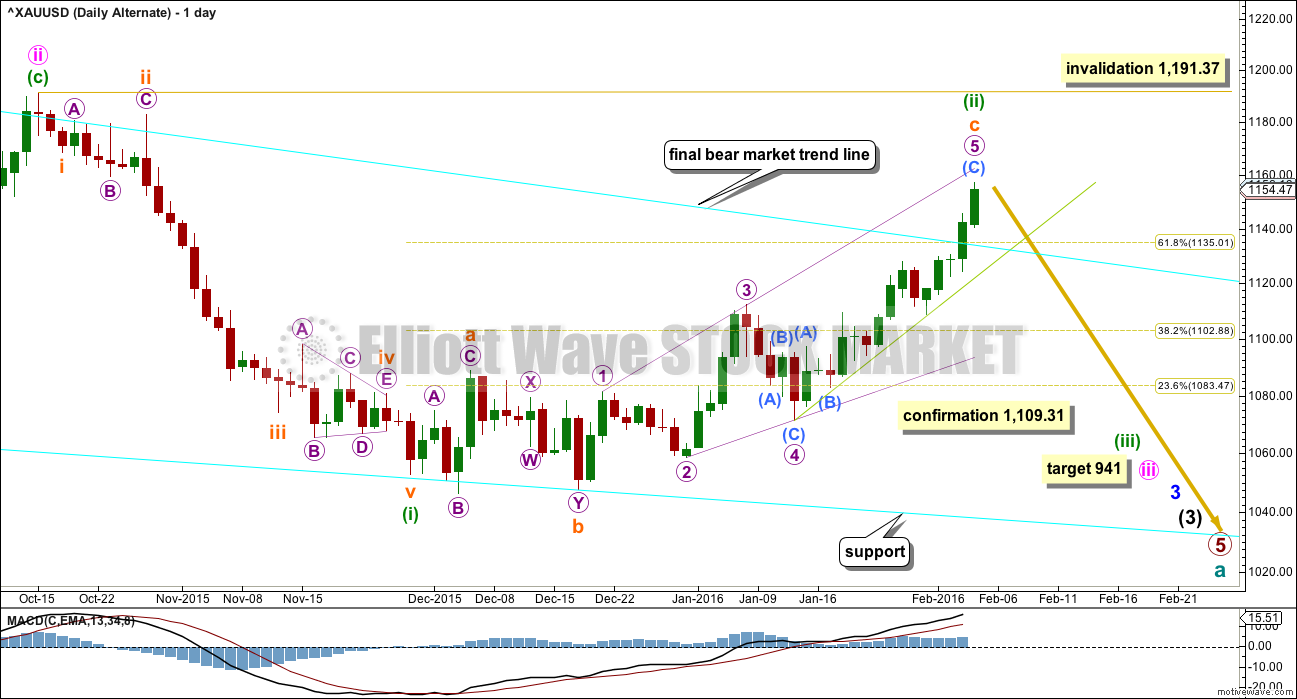
This is now an alternate wave count. With a full daily candlestick above the final bear market trend line and not touching it, this provides simple trend line confirmation of a trend change from bear to bull for Gold.
This bear wave count would expect to see a strong red candlestick for the next session, and it expects price to move strongly lower for a third wave at four wave degrees.
The probability of this wave count has substantially reduced today. It should not be relied upon. If the final bear market trend line is breached at the weekly chart level, this wave count will be discarded.
This wave count requires a new low below 1,109.31 to have any confidence in it.
TECHNICAL ANALYSIS
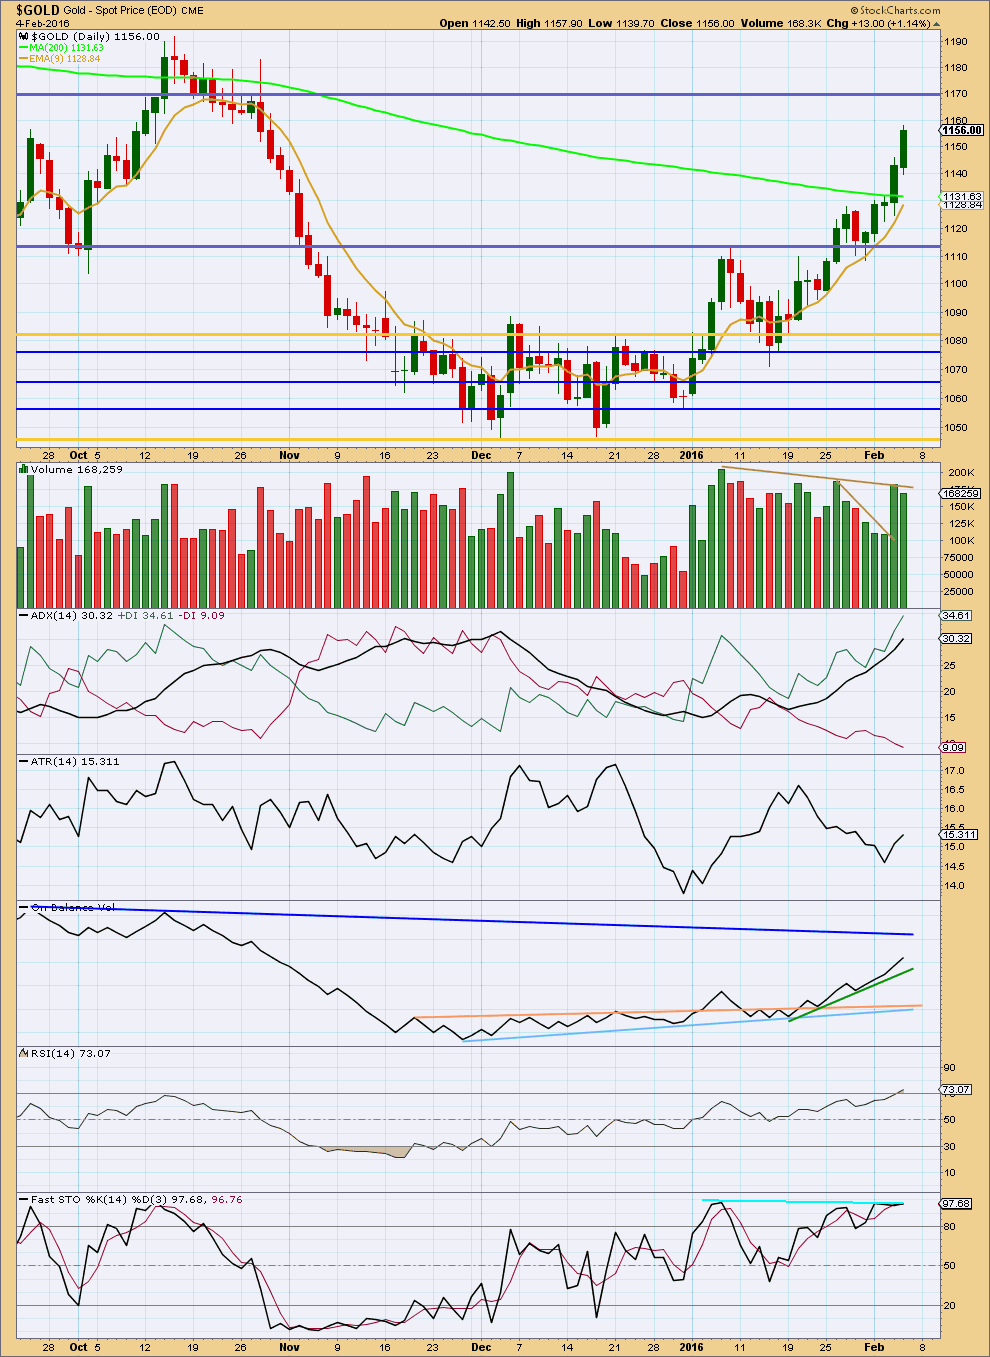
Click chart to enlarge. Chart courtesy of StockCharts.com.
Overall, the volume profile remains unclear. Strongest days of recent movement from the last low are for upwards days which indicates an upwards trend is most likely. However, three times during this upward trend price has moved higher on declining volume. Overall, volume to today’s high is still lighter than volume for 7th January. Overall, as price has made a new high, it comes on overall lower volume.
This may be resolved as the upwards trend continues, or it may be a warning that the Elliott wave count is wrong. This is one reason why I will retain the alternate bear wave count for another week at least.
ADX is very clear. There is a trend and it is up. Price has made a series of higher highs and higher lows; price is clearly in an upwards trend.
RSI is just moving into overbought, so a small correction may be expected about here. This supports the Elliott wave count short term.
ATR is also now turning up and finally agreeing with ADX.
Stochastics shows divergence with price: as price has made new highs in the last few days, Stochastics has not. This indicates some weakness in price. A correction of at least a day or so should be expected to resolve this.
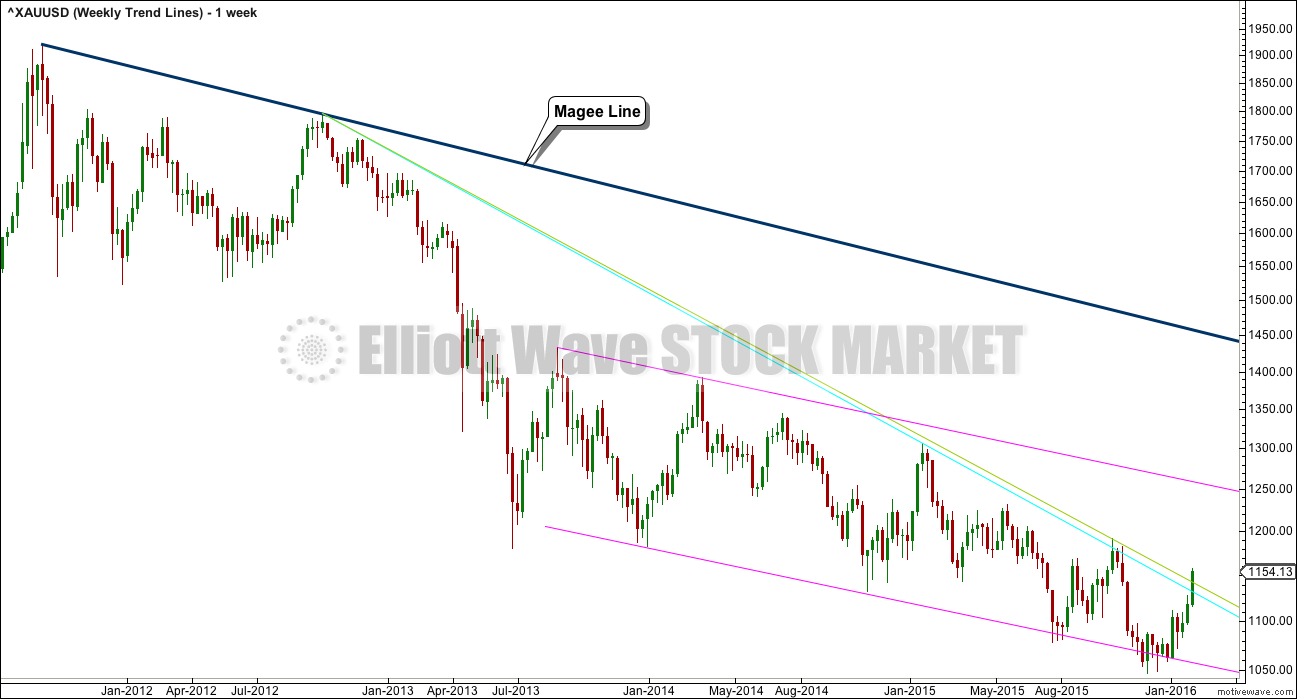
Click chart to enlarge.
This weekly chart shows some trend line possibilities. The final bear market trend line I am using is in cyan.
If a trend line is drawn on this bear market using the approach outlined by Magee in the classic “Technical Analysis of Stock Trends”, then it would not be breached for several months, quite a long way into a new bull market. This final Magee trend line would provide full and final confirmation of a big trend change for Gold, but it is my judgement that it is too far away to be of use. Price should find resistance at that line on the way up, so it will become useful in some months time.
Next to the cyan line is a green line. This green line is today overshot but not breached. If that green line is also breached in the next few days, that would provide further confidence in the bull wave count.
The pink lines are parallel. They do not use the early steeper part of this bear market, so I would not use them for confirmation of a trend change from bear to bull.
This analysis is published @ 09:09 p.m. EST.
Lara how long might subminuette iv last to 1,155 area?
I’m curious as gold is so strong today that micro wave 5 target of 1,172 may be reached by the close unless the 5th wave extends past 1,172 to end subminuette iii.
I’m thinking of buying a small amount of DUST before the close today if subminuette iv may take a day or more, so I can sell DUST higher on Monday, when gold is back down around the target area around 1,155 area on your new hourly chart you presented this afternoon.
Lara I found your comment in Thursday analysis.
“Subminuette wave iv may be expected to last one to three sessions and also show on the daily chart. It may be more brief though; when Gold’s fifth waves extend they force fourth wave corrections to be more brief than usual.”
Leveraged Miners ETF Struts Its Stuff
Todd Shriber, ETF Professor , Benzinga Staff Writer
February 04, 2016 1:19pm
http://www.benzinga.com/trading-ideas/long-ideas/16/02/6211909/leveraged-miners-etf-struts-its-stuff
2016 as of Feb 4th
GLD up 8.91%
GDX up 18.51%
NUGT up 55.07%
So far here is my hourly chart for today.
I’m going to look at finding a lower trend line that may provide support along the way up for the next wave, that lilac line looks to be too far away now, I don’t think price will come that low for a test.
Hi Lara, wave b of micro wave four is more of two time of wave a….is this permitted for the rules?
There is no rule which limits the length of wave B within a flat.
There is a convention which states when the B wave is longer than 2X the A wave that the probability of a flat unfolding is very low.
But you can only know for sure when the structure is finished.
I have seen a fair few flats where B is longer than 2 X A.
And now we have a sharp thrust higher to new highs… that was most certainly it for micro wave 4.
Micro 5 is underway.
If micro 4 was over at todays low then a possible target for micro 5 would be to reach equality with micro 1 at 1,172.
If micro 5 is extended then obviously that target will not be high enough.
but I don’t think it will be as long as micro 3 which was 64.87
I think micro wave 4 may be over as a quick shallow expanded flat.
It would have perfect alternation with micro wave 2 and almost perfect proportion. The wave count would look textbook perfect.
And as that is what Gold does fairly often (and why I love analysing it) I’ll expect that’s what it is.
And so back on the way up we should be 🙂
I have a Fibonacci ratio of 4.236 between submicro (A) and (C) within this expanded flat; submicro (C) would be 0.94 short of 4.236 X (A)
Can’t Keep A Good Market Down; Retail Investors, Market Analysts Bullish On Gold Next Week – Friday February 05, 2016 12:43
http://www.kitco.com/news/2016-02-05/Can-t-Keep-A-Good-Market-Down-Retail-Investors-Market-Analysts-Bullish-On-Gold-Next-Week.html
The bulls might be celebrating a little to soon. Notice where I have circled the turning point leading with a doji write on trend line and stocastics or over sold. Just something to think about. This could change before the day is out. I hope the chart got downloaded. First time trying it.
Gold is already back up to Thursday’s close of 1155.95 now at high of 1155.87 at 11:05 am.
Could Micro 4 be over that fast or might this be a B top of on A-B-C wave down ?
The move up to high of 1163.39 at 8:30 am would of changed lower targets for Micro 4
Richard
Clue is here: “I have confidence that micro wave 4 should unfold lower and should show up on the daily chart as one to three red candlesticks, doji or a mix of the two.”
AND: “When Gold’s fifth waves extend, then the next correction often ends within the price territory of the fourth wave within the extension. This gives a target zone for micro wave 4 of about 1,145.40 to 1,137.29.”
The first target of 1,145.40 for micro wave 4 was hit with today’s low of 1,145.27 at 9:23 am. We have had cases where the analysis had target further away and then hit much faster. This morning that may of already happened for micro wave 4.
Lara may clarify this before the close today.
Maybe the peak at 1163 can be the top of wave 3
Great work Lara.
“If super cycle wave (a) is a three wave structure, then super cycle wave (b) may make a new price extreme beyond its start above 1,921.15 as in an expanded flat or running triangle.”
Now that cycle wave a is complete what is the structure of cycle wave 3 or 5?
I am sorry, your question does not make sense to me.
There is no cycle wave 3 or 5 on the weekly chart?
The Paradigm Shift
http://goldtadise.com/?p=362065
Great article thanks Dreamer.
Hi Lara,
Why do you not consider that Grand Super Cycle wave iv can be finished?
Thanks
Lara talks about this in the video and refers to this post.
http://elliottwavegold.com/2015/05/gold-elliott-wave-technical-analysis-grand-supercycle-8th-may-2015/
Thanks Dreamer!!
Grand Super Cycle wave iv takes more than years to finish nearer to decade or decades.
Take a look at the Grand Super Cycle analysis here.
This could move Gold and the US Dollar Friday 8:30 am EST
FRIDAY, FEB. 5
8:30 am US Nonfarm payrolls Jan. forecast 180,000 previous 292,000
Hi Richard: IMHO as it stands now, more likely 1157-58 gets taken out for more rather than a break below 1153/pivot, the low for Friday may just be in already~! Takes a break below 1148-47 to seek lower…. Since 1098 (and perhaps a little lower) Gold price has been steadily working off its daily pivots moving higher…. NFP later may impact, but that should not take away from the fact that Gold price remains highly bullish. Momentum is indicating for an upside move to likely occur, maybe NFP will trigger that upside move (to likely target 1163-73 range). Although daily RSI is consistently tagging 73+, MACD, ROC etc. are bullish, CCI is long…. Good luck!
Huge week for the Gold bulls from 1116 to 1163, hoping for the bears to get back at least 50% of this lol… a break below 1144 ought to target 1137…lets see…Kind of fun trying to keep on the right side of things…. 🙂
NFP US nonfarm payroll had a huge effect by pushing gold up $ in 1 minute to a new high of 1163.39 at 8:30 am when the news was released then gold dropped $18.12 to a new low of 1145.27 in less than an hour at 9:23 am.
Yes gold is still bullish, however NFT was a huge event worth knowing about and being ready for.
Dollar could hit ¥115 if jobs data disappoints: analyst
Feb 5, 2016 1:20 a.m. ET
http://www.marketwatch.com/story/dollar-could-hit-115-if-jobs-data-disappoints-analyst-2016-02-05
GDX chart
That looks like a runaway gap. Or a measuring gap.
It could well be filled, but not for a while perhaps.
The classic use of that is to measure the height from the low to the gap, and then expect after the gap for price to move the same distance. That gives a target.
Not that you don’t know this, but an explanation for those who may not
Thanks Lara.
I added to my dust and gld put position today. This is do or die time for gold. Time to prove it. Torn here a bit because I don’t think we are done to the downside, but I would love to see this bear market over.
Lots of miners with topping candles today. I sold some of my individual miner positions midday. Will look to add more back on completion of a correction.
I am still extremely bearish and expect one last run down. I just have a hard time accepting that gold is going to continue (much) higher. Gold is well above its 200 day moving average, is far above 70 RSI and all of that on declining volume.
For volume analysis, take a good look at the chart above. In particular, the move down from 1191 has ascending red candlesticks, while the recent move comes on descending green candlesticks.
I think after so many fake outs by gold – it requires a substantial correction (like this one) to convince the majority that this time is different. We shall see.
Tomorrow is the monthly jobs report in the US. If it is positive, the dollar and stocks will get a boost and gold will get knocked down.
While I believe that US stocks will ultimately fall for a couple years (the S&P peaked in May 2015), a relief rally may be brewing. This, in turn, will put pressure on gold. Again, only for the next few months.
On the currency front, the dollar may be weak. However, it is stronger than many other currencies. Because of the inverse relationship with gold, there may be some pressure from that too.
I think we could get another Sunday night top and drop. I added to my Gld puts today. This felt like short squeeze. My COT analysis is at week 10 on Tuesday, gold has been peaking in its cycles between 9 and 11 COT weeks. There is also a measured move on GLD from the cup/handle that hit precisely at 112.32 today. So I feel good over the weekend, but if we clear the last gold peak at 1191, I’ll wait for the wave 2 pull back and grow horns.