
There is now only one Elliott wave count for Silver.
Summary: The trend is up. Silver looks like today it had a typical blow off top, so a correction against the trend may be expected as most likely here .
New updates to this analysis are in bold.
WEEKLY WAVE COUNT
Click chart to enlarge.
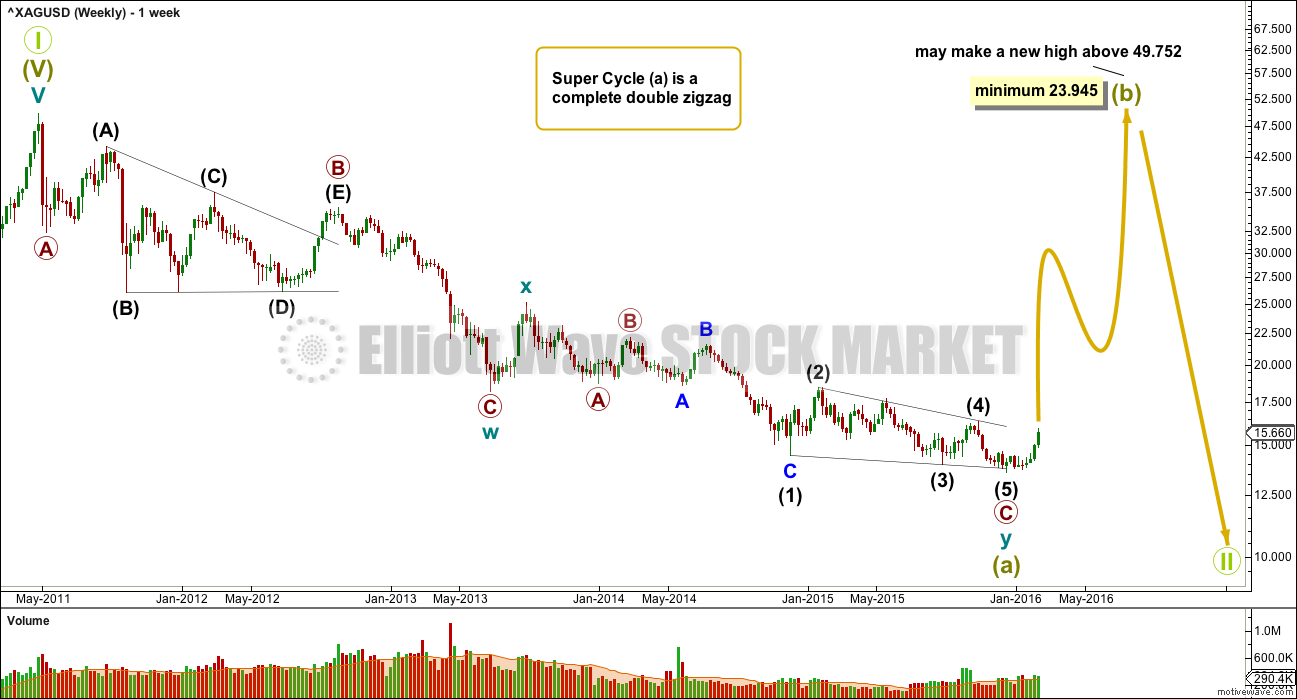
If super cycle wave (a) is a double zigzag, then within the second zigzag of the double labelled cycle wave y the structure may be complete.
Primary wave C is an ending contracting diagonal within the zigzag of cycle wave y. All subwaves subdivide as zigzags. The third wave is shorter than the first, the fifth wave is shorter than the third, and the fourth wave is shorter than the second. The trend lines converge.
There is a small overshoot of the (1)-(3) trend line at the end. This indicates the contracting diagonal structure is very likely to be complete.
If this wave count is correct, then super cycle wave (a) has subdivided as a three wave structure. That indicates Grand Super Cycle wave II may be a flat correction.
If this correction at Grand Super Cycle is a second wave (as opposed to a fourth wave), then a triangle may be eliminated.
A combination may also be eliminated because the first wave is a multiple. Combinations may only consist of a maximum of three corrective structures, so within each of W, Y and Z they may only subdivide into simple A-B-C structures (or A-B-C-D-E in the case of triangles). To label multiples within multiples increases the maximum beyond three, violating the rule.
Super Cycle wave (b) must retrace a minimum 90% of super cycle wave (a) at 23.945. Super cycle wave (b) may make a new price extreme beyond that seen for super cycle wave (a) above 49.752 as in an expanded flat.
Super cycle wave (b) may be any one of 23 possible corrective structures. It is impossible to predict at this early stage which one it will be, only to say it is unlikely to be a rare structure such as a running flat, expanding triangle or triple combination. That still leaves multiple structural possibilities.
The first movement up for a wave of this large degree must subdivide as a clear five at the daily chart level, and probably at the weekly chart level also.
DAILY WAVE COUNT
Click chart to enlarge.
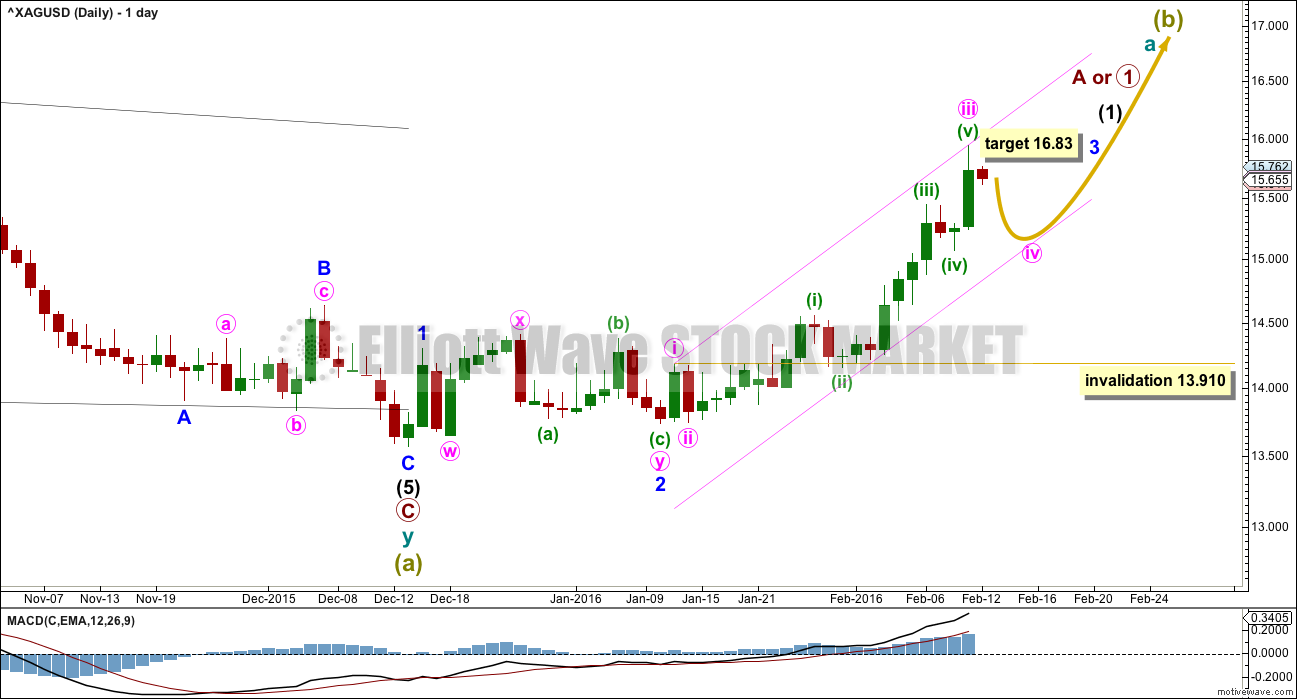
If there has been a trend change at super cycle degree, then a clear five wave structure upwards must develop. This would still be incomplete.
The fist five up may be unfolding as an impulse. The third wave for minor wave 3 is still incomplete. At 16.83 minor wave 3 would reach 4.236 the length of minor wave 1. When minute wave iv within minor wave 3 is complete, then the target may also be calculated at minute degree. At that stage, it may widen to a zone or it may change.
At this stage, upwards movement for Thursday’s session looks like a typical blow off top for Silver. A correction may be very likely to begin about here. Minute wave iv may end within the price territory of the fourth wave of one lesser degree; minuette wave (iv) has its territory from 15.445 to 15.075. This may see minute wave iv end at either the 0.236 Fibonacci ratio at 15.392 or the 0.382 Fibonacci ratio at 15.063 (or just above).
Minute wave iv may not move into minute wave i price territory below 13.910.
Minute wave iv may be brief and shallow. This may be forced due to upwards pressure from a strong fifth wave; like Gold, Silver tends to have swift strong fifth waves which force the prior fourth wave to be quick and shallow. Minute wave v to end minor wave 3 may be very strong.
TECHNICAL ANALYSIS
DAILY CHART
Click chart to enlarge. Chart courtesy of StockCharts.com.
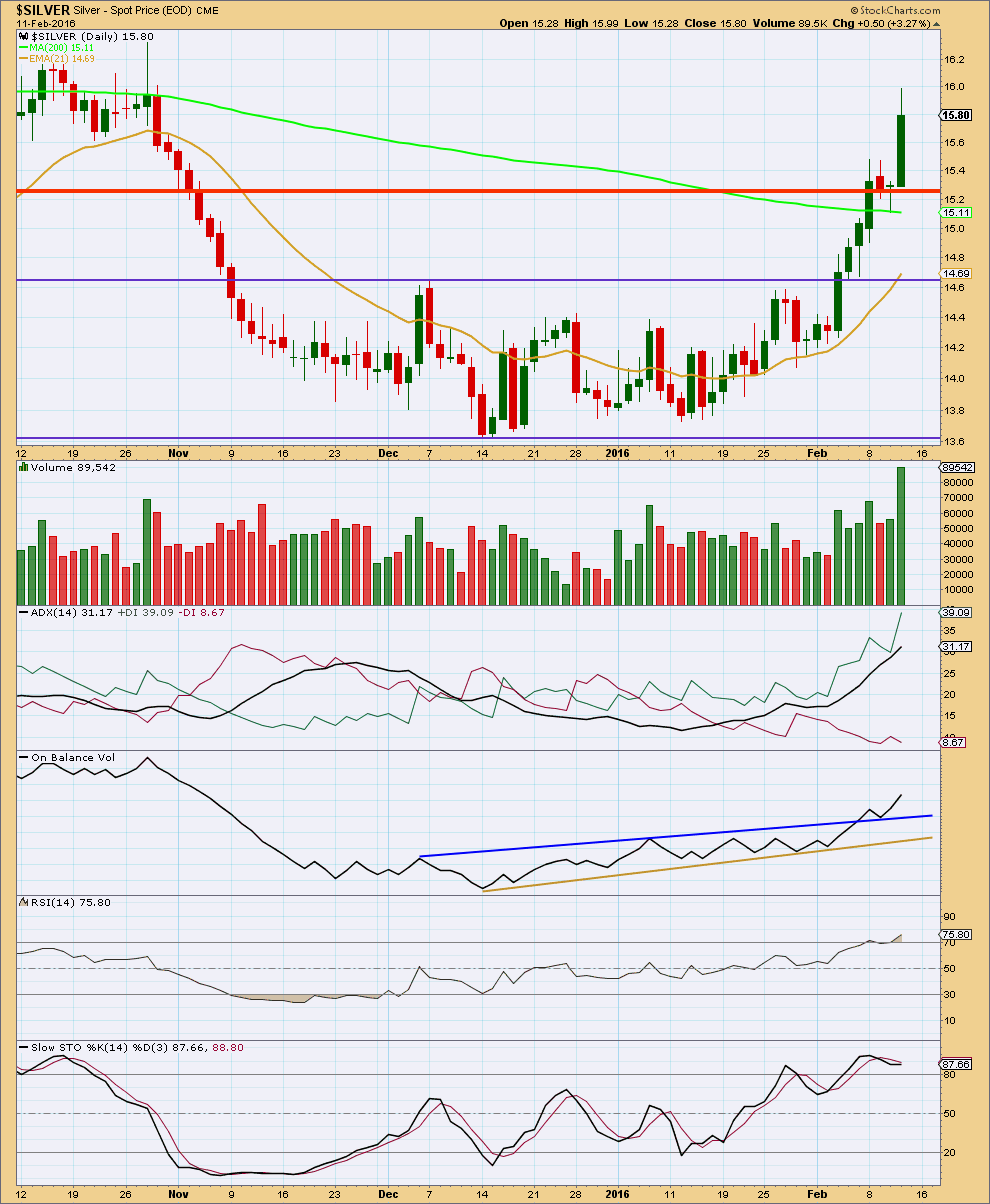
As price rises, it comes with an increase in volume. The rise in price is supported by volume. Thursday saw a very strong upwards day on a strong increase in volume. This is typical to see a volume spike at the end of a movement for Silver. It is likely a correction against the trend may unfold from here.
ADX indicates there is a trend and it is up. Downwards movement should be expected to be a correction against the trend.
Now that the horizontal trend line about 15.25 is breached expect this price point to provide support for a correction.
On Balance Volume broke above the dark blue line and came down to test it. This line now has good technical significance. If OBV comes back down to this line, that may be a leading indicator telling us when the correction for Silver is over.
RSI is now overbought. However, this does not necessarily tell us that upwards movement must stop here. RSI can remain extreme for reasonable periods of time in a trending market. It is a warning; it is not definitive.
Stochastics exhibits divergence today with price. This indicates some weakness in Thursday’s upwards movement and supports the Elliott wave count which expects a correction to unfold about here.
This analysis is published @ 01:25 a.m. EST on 11th February, 2016.
Hi ,
I am a newbie and a little confused. Does the top chart in silver mean we sell in May and
buy back at $10 approx ?
Cheers, Julie
Lara : This is a great Elliott wave analysis. I am watching silver to gold ratio. For PM sector to be in bullish trend this ratio needs to move higher.
With silver turn it is very likely that SGR will turn up and breakout soon once wave iv correction is over.
I plan to overweight portfolio with silver miners vs gold. (60/40)
I have never made profit from other market letters. But from your excellent work I have made very good profit. It is amazing to me.
Fantastic, thank you Papudi.
Beautiful thank you.
You are welcome as always Richard 🙂