
Upwards movement above 33.60 invalidated last week’s US Oil Elliott wave count.
I have three alternates for you today.
Summary: The situation for US Oil for the first time in a long time is remarkably unclear. The only thing that is clear is the monthly chart which requires more downwards movement to complete the structure, but the mid and short term is not clear. Classic technical analysis expects that today saw a classic upwards breakout from a small consolidation, which would expect more upwards movement. A new high above 34.82 would indicate yet more upwards movement. A new low below 26.06 would indicate more downwards movement. Before either of those price points are passed, it is hoped that the Elliott wave structure will be come clearer. All possibilities are considered in today’s analysis.
New updates to this analysis are in bold.
MONTHLY ELLIOTT WAVE COUNT
Click chart to enlarge.
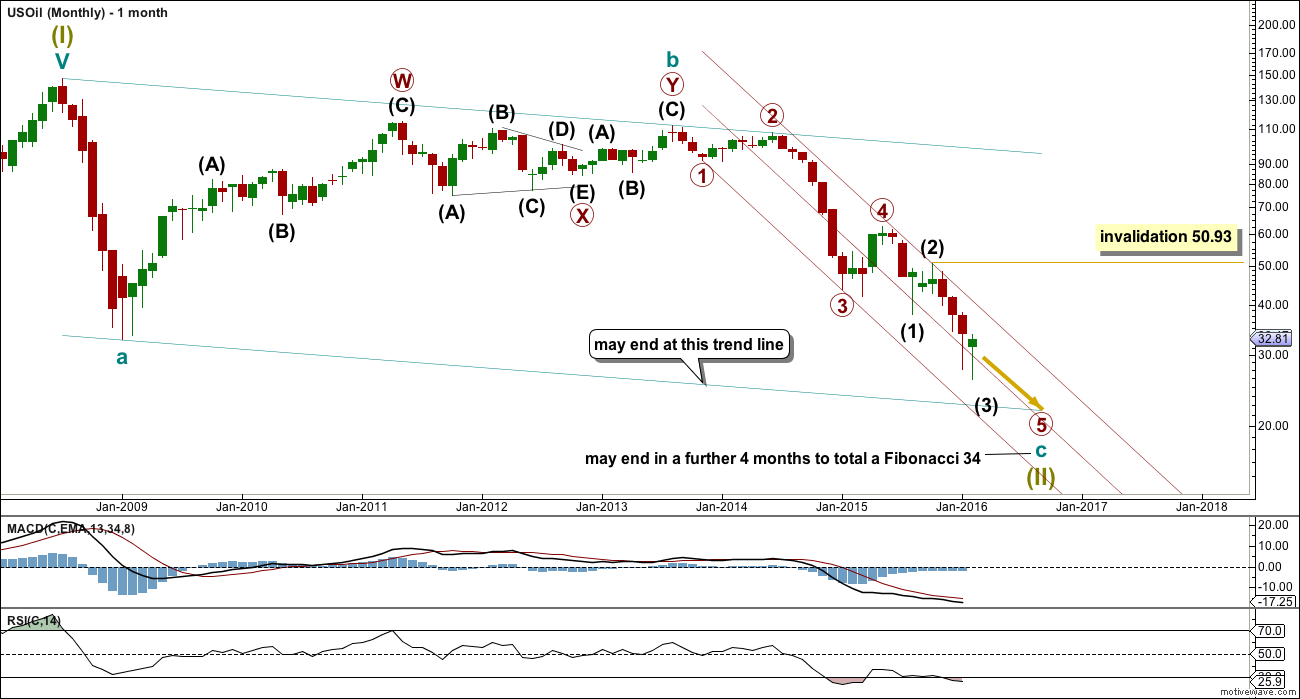
US Oil has been in a bear market since August 2013. While price remains below the upper edge of the maroon channel drawn here and below the 200 day simple moving average it must be accepted that the bear market most likely remains intact.
The structure of cycle wave c is incomplete.
This wave count sees US Oil as within a big super cycle wave (II) zigzag. Cycle wave c has moved below cycle wave a at 32.70 avoiding a truncation. At this stage, as soon as the structure for cycle c could be seen as complete an alternate wave count expecting an end to the Oil bear market would be published. That cannot be done yet because the structure is incomplete. Primary wave 5 has to unfold lower.
When the structure is complete and an alternate bull wave count is published, then it would come with the strong caveat that it is an alternate until there is technical confirmation of a trend change. That confirmation would be a breach of the maroon channel or a break above the 200 day moving average, or both.
Within cycle wave c, primary wave 5 is expected to be extended which is common for commodities.
No second wave correction may move beyond the start of its first wave above 50.93 within intermediate wave (3).
Draw a channel about this unfolding impulse downwards. Draw the first trend line from the lows labelled primary waves 1 to 3, then place a parallel copy up not the high labelled intermediate wave (2), so that all movement is contained. Add a mid line. Copy the channel over to the daily chart.
The wider teal green channel is drawn about this whole correction. Cycle wave c may end when price finds support at the lower edge of this channel. But sometimes these channels are breached by C waves, particularly if the C wave has a swift strong extended fifth wave to end it. How price behaves when it gets to the lower teal trend line, and how complete the structure is at that stage, will indicate if price may stop there or if it would continue.
MAIN DAILY ELLIOTT WAVE COUNT
Click chart to enlarge.
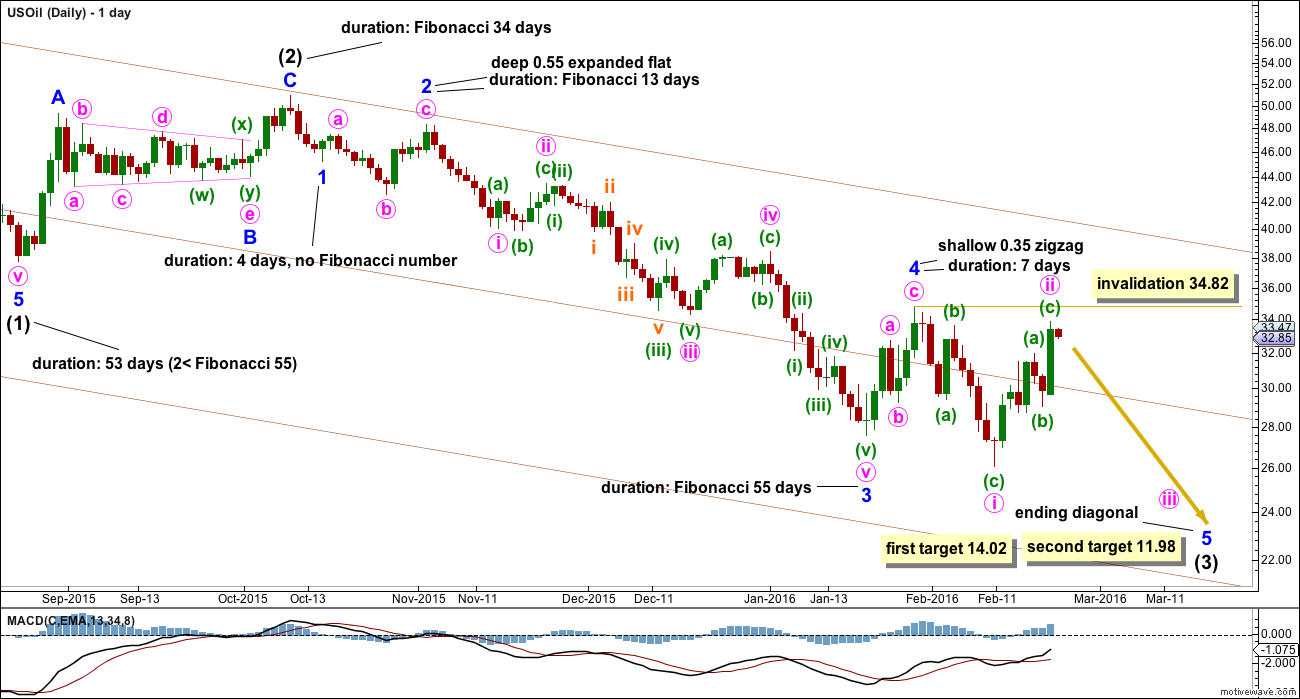
Despite strong upwards movement, this wave count must be the main wave count based on Elliott wave guidelines and proportion.
Minor wave 4 is still likely to be over as a quick shallow zigzag. This provides perfect alternation with the deep expanded flat of minor wave 2. Minor wave 4 lasted 7 days and minor wave 2 lasted a Fibonacci 13 days. The proportions between the two corrections give the impulse of intermediate wave (3) the right look.
So far intermediate wave (3) has not yet shown an increase in momentum beyond that seen for intermediate wave (1). Third waves should be stronger than first waves, so it is most likely that intermediate wave (3) is incomplete.
Minor wave 5 may be unfolding as an ending diagonal. All the subwaves within an ending diagonal must subdivide as zigzags.
At 14.02 minor wave 5 would reach equality in length with minor wave 3. At 11.98 intermediate wave (3) would reach 1.618 the length of intermediate wave (1). The next target is now 14.02. If that target is met and passed, then the next target would be 11.98.
It is unlikely though that an ending diagonal would be able to exhibit an increase in downwards momentum enough to see intermediate wave (3) end more strongly than intermediate wave (1). Other ideas are considered for this reason.
FIRST ALTERNATE DAILY ELLIOTT WAVE COUNT
Click chart to enlarge.
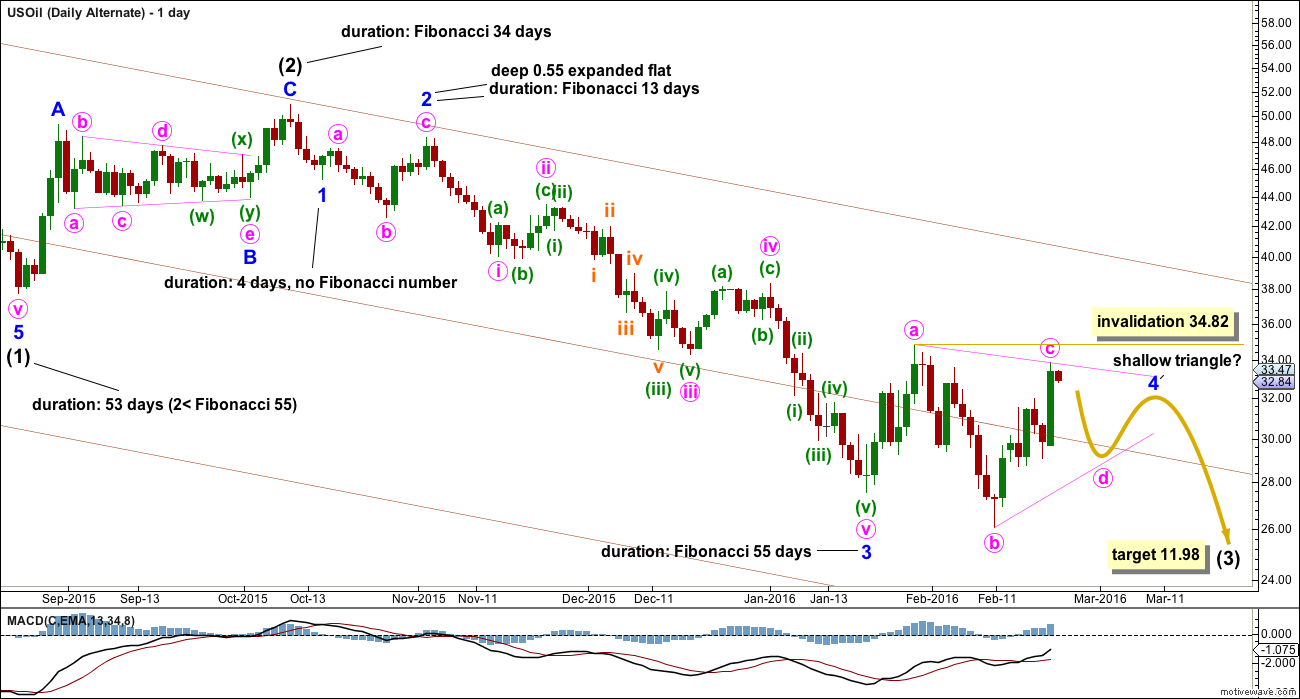
What if minor wave 4 is not over? It may still be continuing sideways as a running contracting or barrier triangle.
Minute wave c may not move beyond the end of minute wave a above 34.82 within a running contracting or barrier triangle.
This wave count would see minor waves 2 and 4 still exhibit alternation: minor wave 2 as a deep expanded flat and minor wave 4 as a shallow triangle. Minor wave 4 would be much more time consuming than minor wave 2 though. Triangles are sometimes much more time consuming than other corrective structures, so this wave count is valid although it does not have a very typical look.
The target is 11.98 where intermediate wave (3) would reach 1.618 the length of intermediate wave (1).
This wave count would allow for minor wave 5 to be a strong extension, and intermediate wave (3) to end more strongly than intermediate wave (1). The only problem with it is the lack of proportion between minor waves 2 and 4.
SECOND ALTERNATE DAILY ELLIOTT WAVE COUNT
Click chart to enlarge.
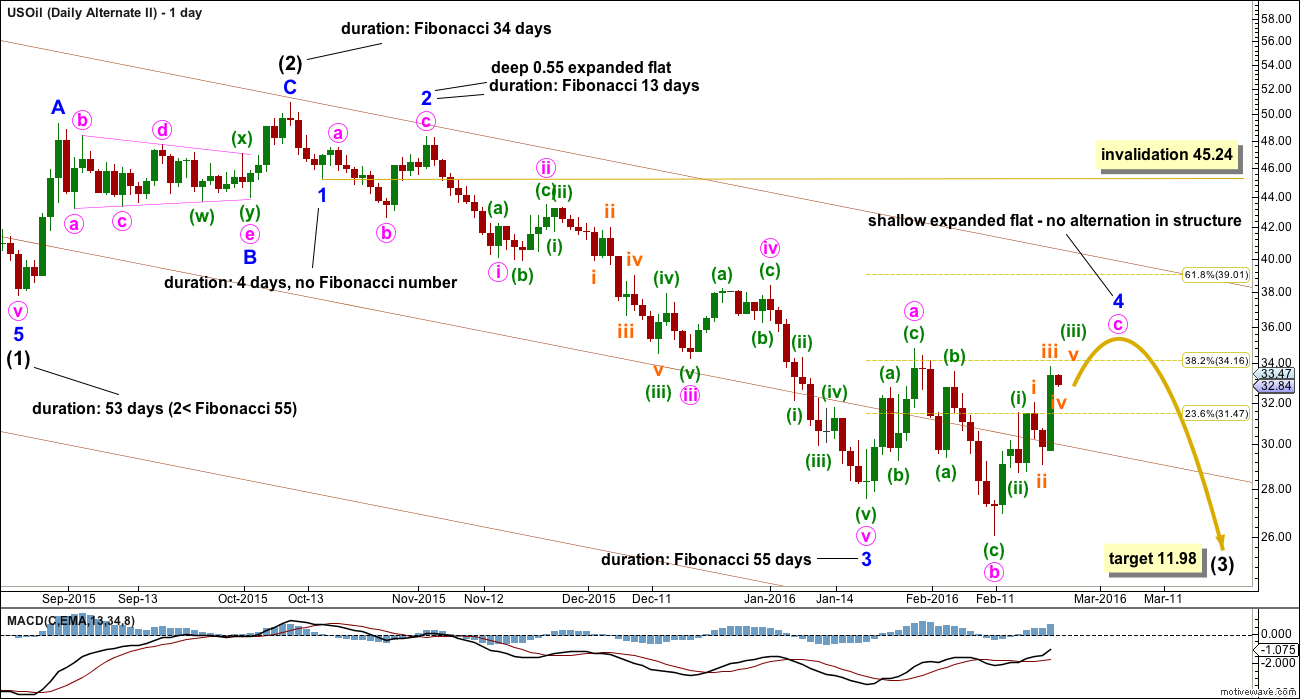
What if minor wave 4 is continuing as an expanded flat? There would be no alternation in structure between minor waves 2 and 4. Minor wave 4 would be much longer in duration than minor wave 2 despite both structures being the same. This second alternate wave count must necessarily have a very low probability due to these problems.
The target is the same. At 11.98 intermediate wave (3) would reach 1.618 the length of intermediate wave (1).
Minor wave 4 may not move into minor wave 1 price territory above 45.24.
THIRD ALTERNATE DAILY ELLIOTT WAVE COUNT
Click chart to enlarge.
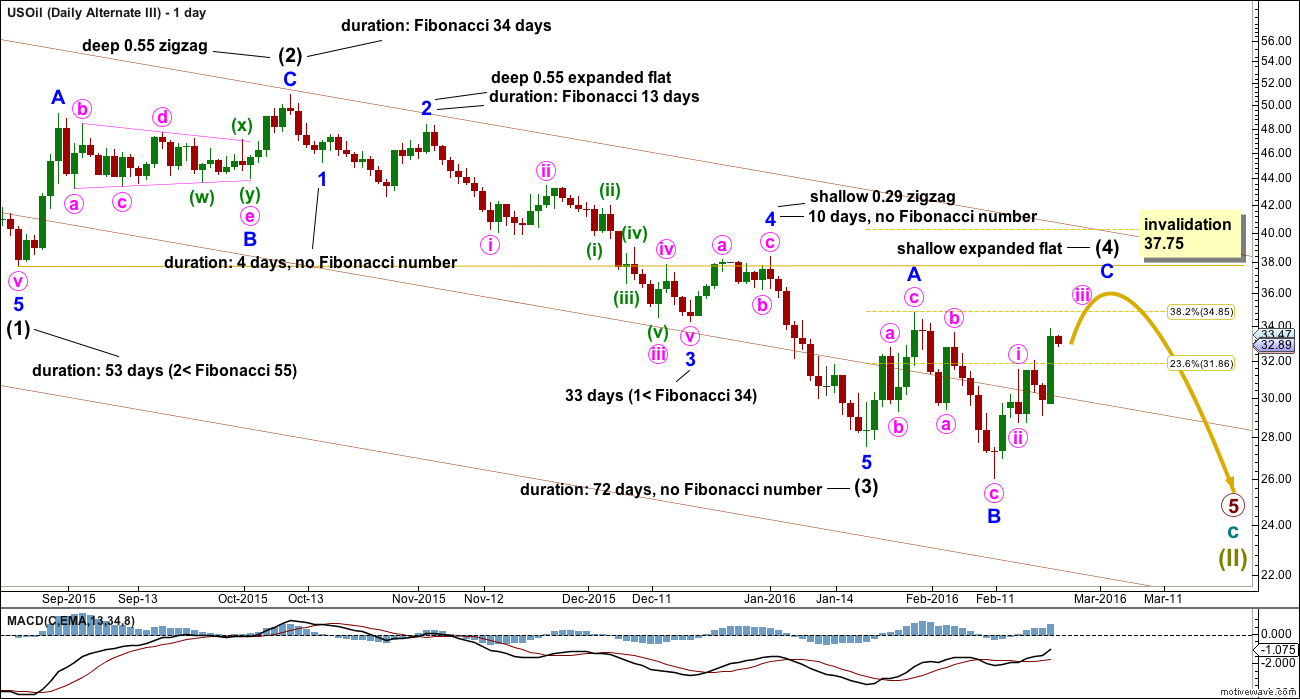
Despite having a good overall look, this wave count must have the lowest probability of all due to the lack of momentum. This wave count would see intermediate wave (3) shorter than intermediate wave (1) by 0.7 and weaker using MACD as a momentum guide. This is possible but rare, giving this wave count a low probability.
Intermediate wave (2) was a deep zigzag lasting a Fibonacci 34 days. Intermediate wave (4) may be exhibiting alternation as a shallow expanded flat. So far it has lasted 24 days. If it were to continue for a further 10, it would equal the duration of intermediate wave (2) giving perfect proportion.
A new high above 34.82 would see the probability of this wave count increase.
If intermediate wave (3) was more brief and weaker than intermediate wave (1), then intermediate wave (5) should also be more brief and weaker than intermediate wave (3). A third wave may never be the shortest, so intermediate wave (5) would be limited to no longer than 23.37.
It is much more common for commodities to exhibit swift strong fifth waves than it is to see weak short fifth waves.
TECHNICAL ANALYSIS
DAILY CHART
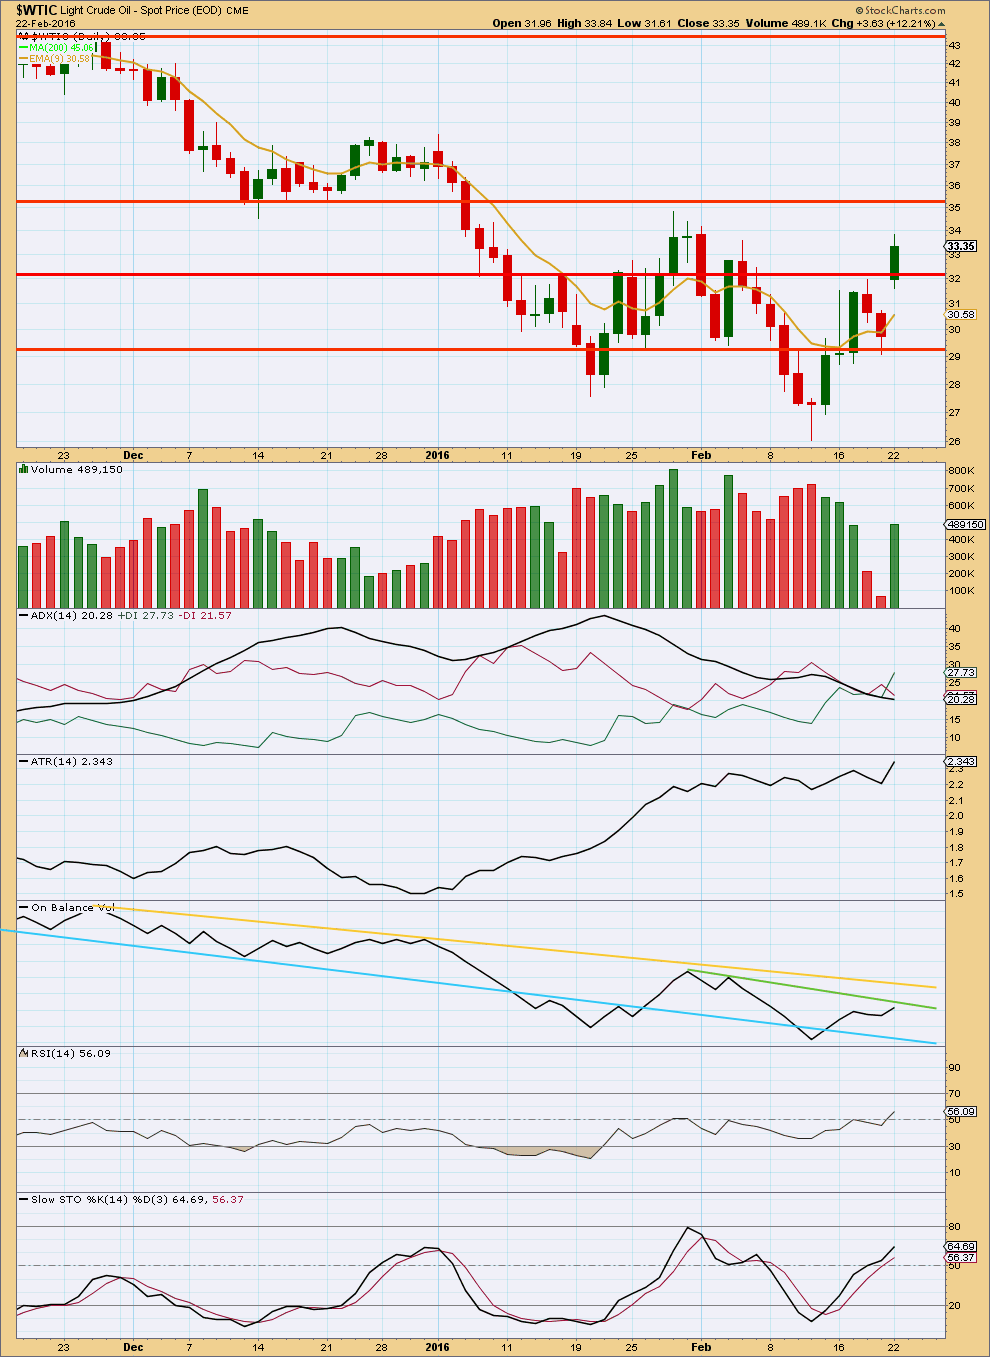
Click chart to enlarge. Chart courtesy of StockCharts.com.
Upwards movement came with declining volume until the last session of 22nd February which sees a gap up and an increase in volume. This looks like a typical upwards breakout from a consolidation zone, supported by volume.
ADX does not yet indicate the market is trending as it is still declining. The +DX line has crossed over the -DX line indicating a potential trend change, but this signal needs to be completed by ADX turning upwards.
ATR is now increasing which indicates the market may now again be trending. If so the trend would be up, supported by an upwards breakout.
On Balance Volume may find some resistance at the green line, but this does not have much technical significance. The yellow line has more significance as it is longer held. This may provide resistance. To the downside, the blue line may provide support for OBV.
Stochastics is not yet overbought, so there is more room for this market to rise.
RSI is just above neutral. There is room for the market to move up or down.
This analysis is published @ 03:09 a.m. EST on 23rd February, 2016.
Finally. Finally I have a wave count which resolves the problems I had this week with Oil analysis.
It resolves problems of momentum, proportion and structure.
I have confidence in it. To be proofed and published momentarily.
Good read on oil fundamentals
http://oilprice.com/Energy/Energy-General/The-Oil-Market-Is-Beginning-To-Crack.html
Thank you for the link Dreamer!
This explains (for me at least) why Oil has been falling on light volume. It seems like there is a lack of buyers, not necessarily more sellers. That is enough to push price down.
Oversupply and lack of demand.
The continued move up in oil today still looks like a corrective structure. It may have morphed into a more complex WXY to complete wave c of the triangle or Minute wave 2 for Lara’s main ending diagonal count. If oil goes higher than 34.81 on Monday, then a different structure will need to be considered, maybe an expanded flat if this final wave up can be properly labeled as an impulse or ending diagonal for a 5 wave structure.
Daily oil has reversal candlestick chart pattern: inverted hammer. Next week oil should move down.
Waiting for Lara’s EW count on Monday.
Lara: “A new high above 34.82 would indicate yet more upwards movement. A new low below 26.06 would indicate more downwards movement.”
Oil moved to 34.65 today. AND turn back down.
Will it takeout this high next week????
Monday will need new EW counts. Perhaps the third alt will remain same.
Or maybe ready to turn down???
Oops. I attached a chart, and then edited the comment. It looks like the chart disappeared. Here it is…
Now there it is twice. Sorry folks.
After reviewing all alternatives I go with the third alternative daily wave count. That yes, we are in a huge espanded flat with oil going much higher. Even though that one is mark as the one with the samllest probability.
March is for the bulls, Booyah!
I thought the same a week or so ago. However, the upside looks finished for now and (C) should really exceed (A). It could still be a wave 4 triangle really dragging things out. Either way, all the recent strong upside doesn’t seem to fit well with Lara’s main count.
Do the seasonals favour March?
If the main (ending diagonal) or alternate (triangle) count is correct, we should move down over the next few days. Triangle chart shown.
Our chart levels look slightly different, but essentially, I’m saying the same thing.
Yea, the different data sources and timing on the March futures expiration is really affecting the charts. Hopefully we got it right and we go down from here for a few days.
Thank you, Dreamer, for your charts and thoughts.
I noticed yesterday that there appears to be some missing price data in the feed that Investing.com publishes. The missing data is for Feb.18, just prior to the big gap up on Monday. It’s at the place you have marked as the end of wave ii.
Check PMBull.com for what seems to be a more complete price plot. Better yet, I grabbed the freely-available Dukascopy Bank source code that PMBull uses and cobbled together my own, much cleaner web page with 1-hr charts for both WTI Crude and GOLD. I plan to keep it up indefinitely, so feel free to check it out at:
http://track17.com/charts.html
I don’t think the more complete data would change your proposed wave count, but it would have wave ii ending quite a bit lower, as the second of four touch points so far on the current upward sloping trend line that Lara showed us in her most recent comment below.
Curtis, thanks for your thoughts. I think it’s all related to different websites switching from the March futures contract to the April contract at different times. There was approx a $2.00 difference in the futures (backwardation). Investing.com switched late at night after the close on the 18th, resulting in a big gap up, which you describe as missing data. The official expiration for March futures was not until the 22nd after the close. I don’t know why Investing.com switched early. You would think all the websites would change at the same time according to the official Comex date. It’s confusing and frustrating for sure!
oil is there 33.83. It should start moving down here?????
oil is there 33.83. It should start moving down here?????
Gold to Oil ratio is high. How high??? Who will give up Gold or oil???
It can not be that gold goes higher and oil drops. The ratio will keep going higher.
Normal range has been 26 to 6 and average 15.
A good place to short oil again around $33 (basis April contract) IMO. It tagged the downtrend line joining the recent tops and also Lara’s most recent uptrend line from below. Stop on hourly close above the downtrend line.
Also the GM went to recent new highs but oil followed reluctantly. We shall see.
NB I’m working off the 60 min chart.
US Oil two X Etf SCO HnS in 2 hour period.
Draw a trend line across the last few lows on the daily chart as shown by the lilac line in this chart.
If price breaks below that line and throws back it should offer a good entry to join a downwards trend.
This has happened before. If it happens again then again we would have another series of lower highs and lower lows.
US oil is developing a bottom bullish Head and Shoulder pattern. Unless it get invalidated by price closing below pink line soon.
Lara: Can you comment on the price broke above the blue trend line and not touching for several days now?? Is that bullish and has trend changed?
Sometimes fourth waves just aren’t contained within channels.
That’s why Elliott developed a second technique to use when the fourth wave breaches the channel.
I see the head and shoulders pattern, but I think the lower low which I have labelled minor 3 should be seen as the left hand shoulder. Which would mean the right hand shoulder has yet to form.
Yesterday US Oil put in bearish engulfing candlesticks chart pattern. Currently oil is inside the gap of last week at 30.
If closes below the gap may be then Lara can comment on EW structure before it takes out 26 price point.
Lara: ” Before either of those price points are passed, it is hoped that the Elliott wave structure will become clearer”
Special thanks to Saudi’s Oil Minister for helping oil move down today…
http://www.marketwatch.com/story/why-comments-by-saudi-arabias-al-naimi-slammed-oil-futures-2016-02-23
The move down today invalidated the more bullish short term second and third alternate counts by moving into 1st wave territory below 31.53. No surprise, Lara had the probability correct! Now it’s between the main count (ending diagonal) and the triangle. Posting the triangle scenario as we need to keep an eye on it.
Lara, please refresh my memory, what is the target range for a triangle wave to retrace the prior wave? Something like .6 to .8?
I’ve noticed they’re often about 0.8. That’s my experience over the years, I’ve used that as a handy guide for targets.
One of the triangle subwaves is often about 0.618 its predecessor.
Thanks for taking the time to show all the options!
You’re welcome.
While Oil isn’t clear at this time I’ll be avoiding trading it.