
Last week expected downwards movement from Oil.
Price came back up to touch the trend line and then has overall moved lower.
Summary: A fifth wave may be extending, and it may be strong as is typical for commodities. If targets are wrong, they may not be low enough. The target remains the same so far at 26.87 – 26.1. In the short term, confidence may be had in strong downwards movement with a new low below 29.40. A new high above 33.60 would see the second alternate wave count confirmed.
New updates to this analysis are in bold.
MONTHLY ELLIOTT WAVE COUNT
Click chart to enlarge.
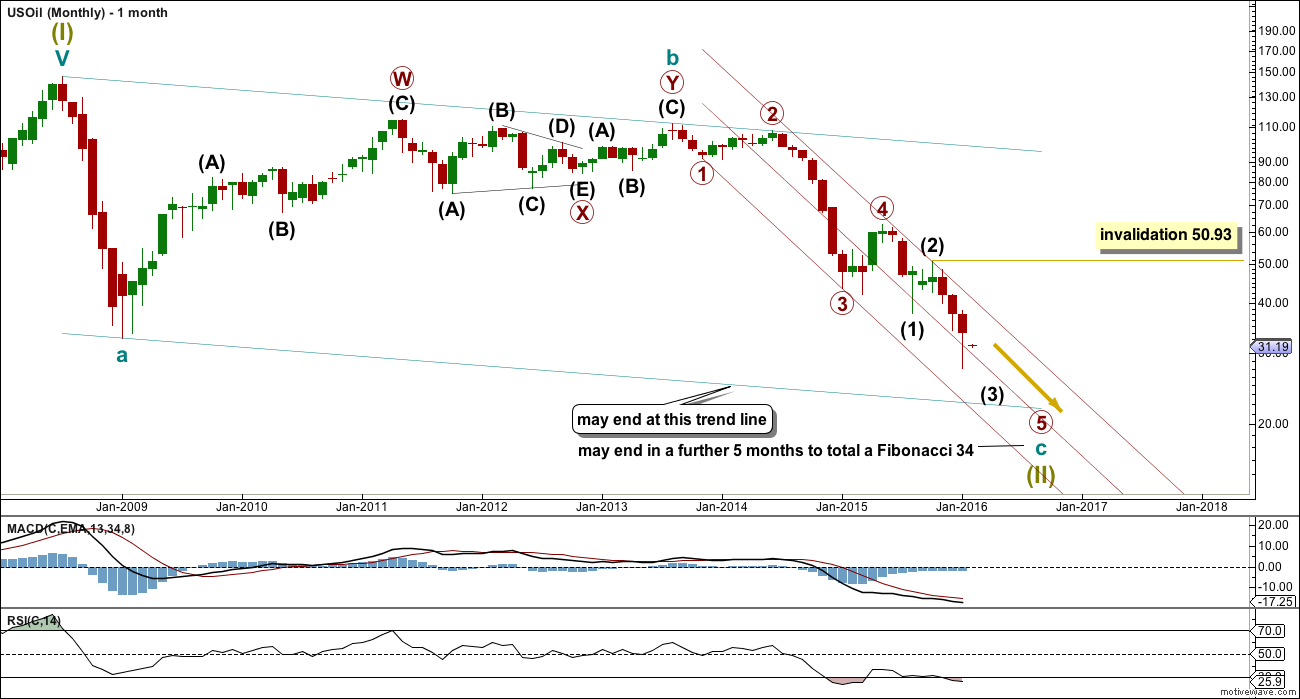
US Oil has been in a bear market since August 2013. While price remains below the upper edge of the maroon channel drawn here and below the 200 day simple moving average it must be accepted that the bear market most likely remains intact.
The structure of cycle wave c is incomplete.
This wave count sees US Oil as within a big super cycle wave (II) zigzag. Cycle wave c has moved below cycle wave a at 32.70 avoiding a truncation. At this stage, as soon as the structure for cycle c could be seen as complete an alternate wave count expecting an end to the Oil bear market would be published. That cannot be done yet because the structure is incomplete. Primary wave 5 has to unfold lower.
When the structure is complete and an alternate bull wave count is published, then it would come with the strong caveat that it is an alternate until there is technical confirmation of a trend change. That confirmation would be a breach of the maroon channel or a break above the 200 day moving average, or both.
Within cycle wave c, primary wave 5 is expected to be extended which is common for commodities.
No second wave correction may move beyond the start of its first wave above 50.93 within intermediate wave (3).
Draw a channel about this unfolding impulse downwards. Draw the first trend line from the lows labelled primary waves 1 to 3, then place a parallel copy up not the high labelled intermediate wave (2), so that all movement is contained. Add a mid line. Copy the channel over to the daily chart.
The wider teal green channel is drawn about this whole correction. Cycle wave c may end when price finds support at the lower edge of this channel. But sometimes these channels are breached by C waves, particularly if the C wave has a swift strong extended fifth wave to end it. How price behaves when it gets to the lower teal trend line, and how complete the structure is at that stage, will indicate if price may stop there or if it would continue.
MAIN DAILY ELLIOTT WAVE COUNT
Click chart to enlarge.
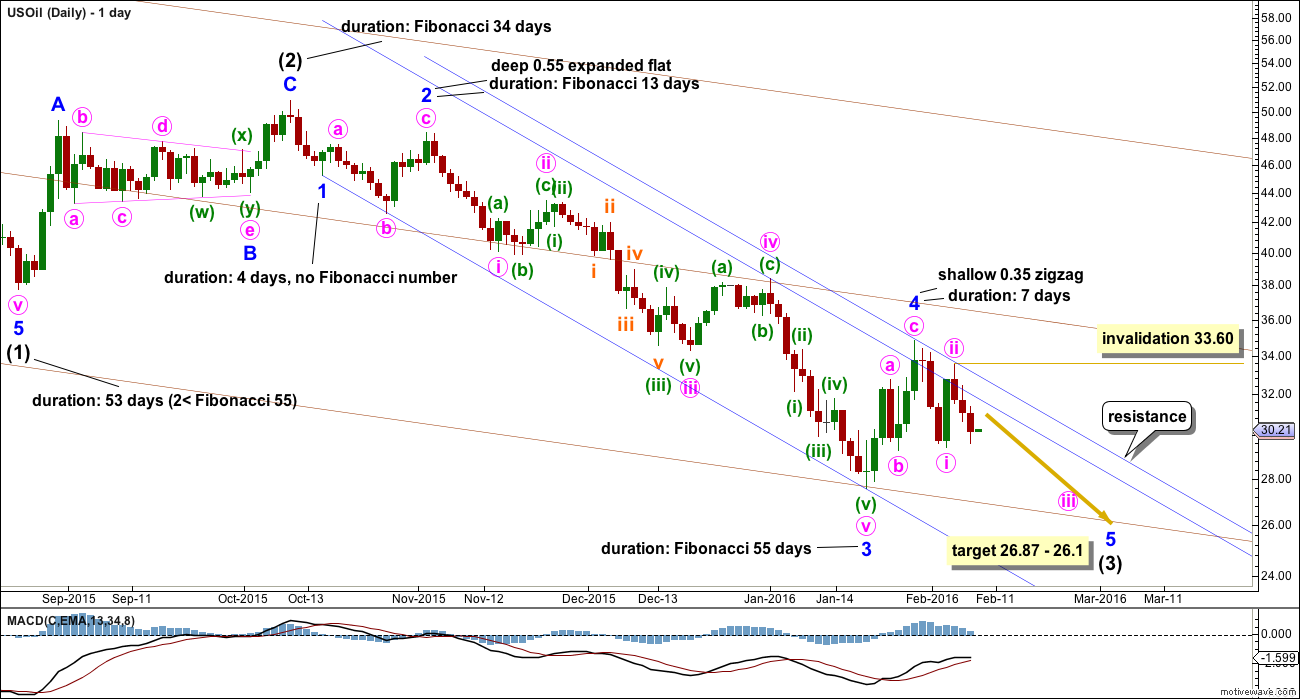
Within intermediate wave (3), minor wave 3 shows an increase in downwards momentum beyond that seen for minor wave 1. But intermediate wave (3) has not yet seen an increase in momentum beyond that seen for intermediate wave (1). A further increase in downwards momentum should be expected.
Minor wave 2 was a deep expanded flat which lasted a Fibonacci 13 days. Alternation between minor waves 2 and 4 should be expected. If minor wave 4 is over now, then it would be a shallow zigzag lasting 7 days, one short of a Fibonacci 8. This gives the wave count the right look and provides perfect alternation in both structure and depth.
Within minor wave 4, minute wave c is just 0.38 longer than equality in length with minute wave a.
Minor wave 4 has slightly overshot the channel which is drawn using Elliott’s first technique. This is another indicator that it is likely to be over.
Create a parallel copy of the upper edge of the dark blue Elliott channel and place it on the high of minor wave 4. This trend line is currently providing resistance.
Typical of commodities, US Oil often will exhibit very swift strong fifth waves. That means that the strongest part of downwards movement may be ahead, and this tendency is particularly strong for fifth waves to end third waves. My targets may be too high; minor wave 5 to end intermediate wave (3) may be a strong extension.
At 26.87 minor wave 5 would reach 0.382 the length of minor wave 3. At 26.1 intermediate wave (3) would reach equality in length with intermediate wave (1). This gives a 0.77 target zone calculated at two wave degrees. If this target is wrong, it may be too high. For this reason I also provide lower calculated targets.
At 14.02 minor wave 5 would reach equality in length with minor wave 3. At 11.98 intermediate wave (3) would reach 1.618 the length of intermediate wave (1). If the first target zone of 26.87 – 26.1 is met and passed, then the next target would be 14.02. If that target is met and passed, then the next target would be 11.98.
Minor wave 1 lasted 4 days (not a Fibonacci number). Minor wave 3 lasted exactly a Fibonacci 55 days. If the first target zone is met, then minor wave 5 may last a Fibonacci 21 days. If the lower targets are met, then minor wave 5 may last a total Fibonacci 55 days. (Note: I am counting only trading days and not calendar days).
When waves extend in price they also necessarily extend in time. When waves extend they show their smaller subdivisions clearly at higher time frames. Within minor wave 5, minute wave ii is clear, again finding resistance at the upper parallel copy of the Elliott channel. This indicates minor wave 5 may be extending, so the lower targets must be considered seriously.
Within minute wave iii,, no second wave correction may move beyond the start of its first wave above 33.60.
ALTERNATE DAILY ELLIOTT WAVE COUNT
Click chart to enlarge.
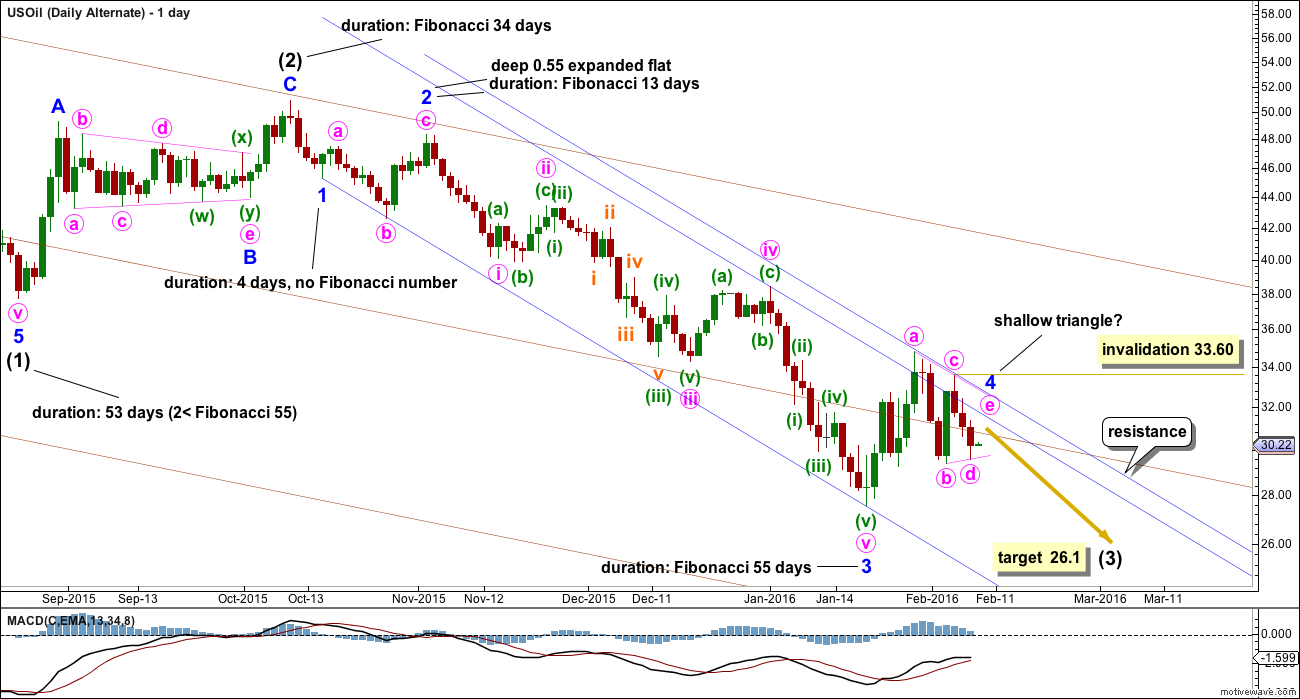
At first glance it looks like minor wave 4 may be continuing sideways as a triangle. However, when this idea is charted it does not have the right look. Minute waves b and d within this possible triangle look to be too brief and shallow.
This movement has a more typical look of a series of first and second waves as per the main daily chart.
If a triangle is unfolding, then within it minute wave e may not move above the end of minute wave c at 33.60.
Fifth waves to follow triangles are often surprisingly short. For this idea the target at 26.1 looks reasonable.
It is my judgement, based upon experience, that this alternate wave count has a low probability. But low probability does not mean no probability. It is a possibility that should be considered. At this stage, it makes no difference to the expected direction or invalidation point.
SECOND ALTERNATE DAILY ELLIOTT WAVE COUNT
Click chart to enlarge.
This alternate wave count has the lowest probability today. But all possibilities should be considered.
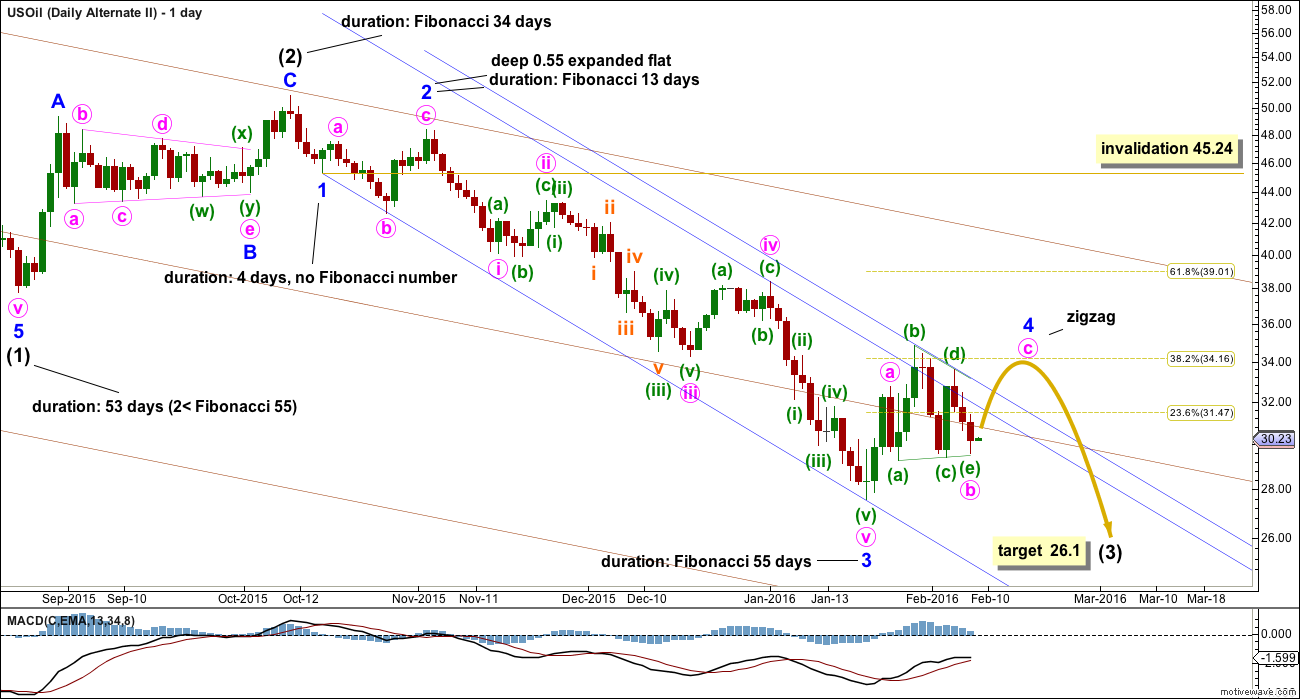
What if there is a triangle forming and it is a B wave within a fourth wave correction?
There would still be structural alternation between minor waves 2 and 4. There would also be alternation in depth if minor wave 4 ended at the 0.382 Fibonacci ratio at 34.16.
Minor wave 4 would breach the Elliott channel and also break through resistance at the upper parallel copy. Sometimes fourth waves are not contained within channels.
Minor wave 2 lasted 13 days. So far minor wave 4 has lasted 13 days. It would still have good proportion if it continued for a very few more days.
Minute wave c would be highly likely to move at least slightly above minute wave a at 32.74 to avoid a truncation.
If price breaks above 33.60, then this wave count would be confirmed and, would be the only wave count. If that happens, then expect only a little more upwards movement to end about 34.16.
Of the two ideas including triangles for recent movement, it is my judgement that this idea has a better look. I judge this wave count to have a lower probability though due to the breach of resistance required for minor wave 4 to complete.
This wave count should only be used if it is confirmed with a new high above 33.60.
In the short term, a new low below 29.40 would invalidate the triangle for minute wave b because minuette wave (e) may not move below the end of minuette wave (c).
Minor wave 4 may not move into minor wave 1 price territory above 45.24.
TECHNICAL ANALYSIS
DAILY CHART
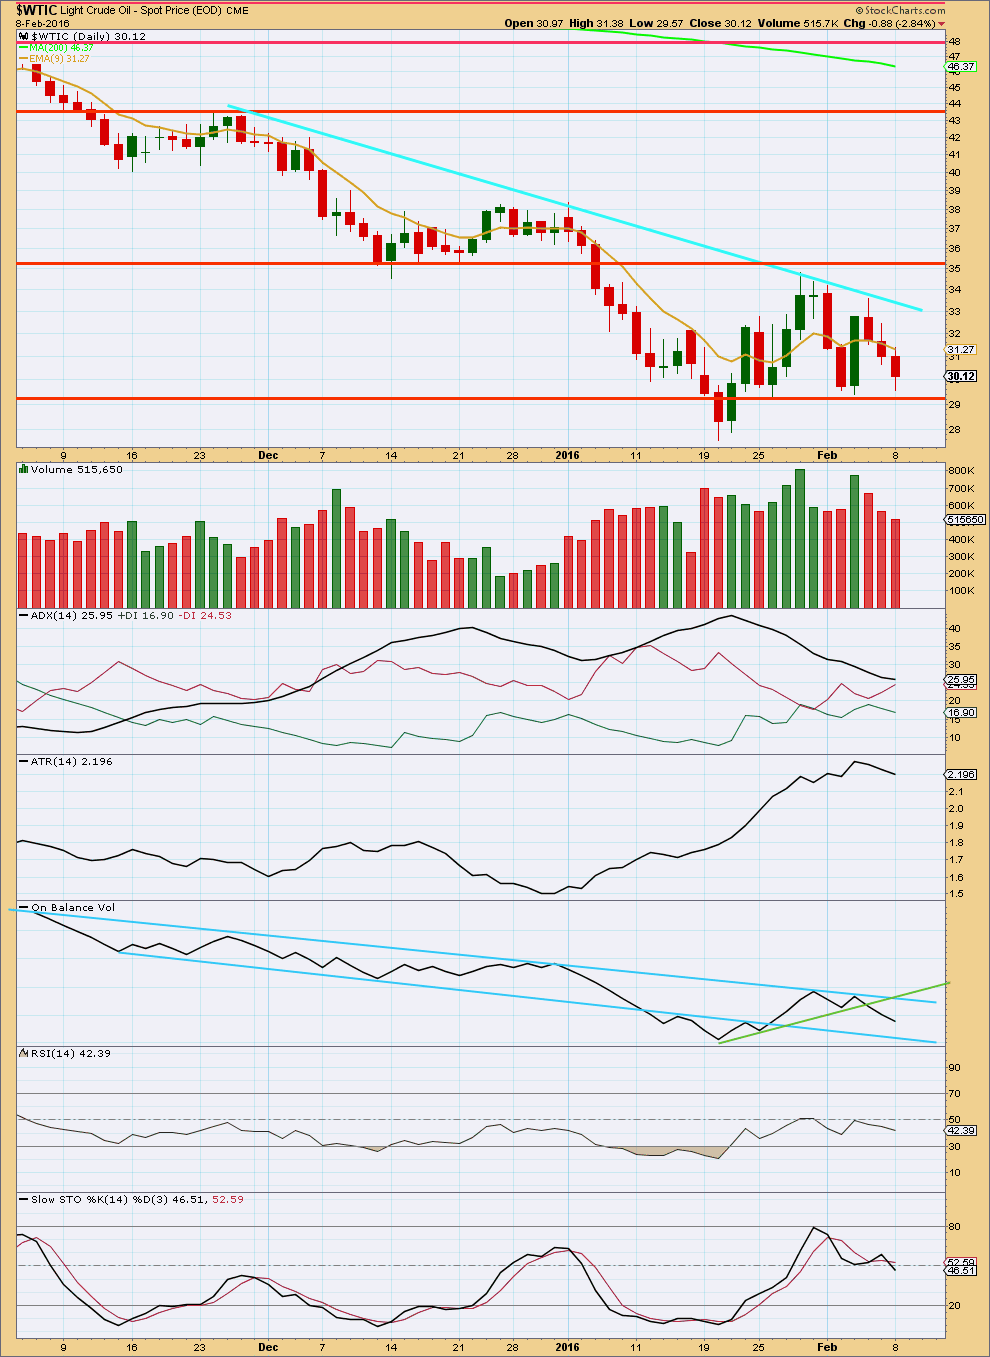
Click chart to enlarge. Chart courtesy of StockCharts.com.
ADX and ATR indicate the market is not trending. The market is consolidating. Price is swinging from resistance to support and back again, bound between about 34.80 and 29.30. It is two upwards days which have strongest volume during this consolidation. This indicates an upwards breakout is more likely than downwards. However, although this trick works well for Gold it does not work so well for Oil.
The consolidation which lasted from 6th May, 2015, to 1st July, 2015, had three strongest upwards days yet price broke out downwards.
The consolidation which lasted from about 1st September, 2015, to 11th November, 2015, had a strongest day which was upwards yet price broke out downwards.
For the last three days as price has fallen volume has declined. The fall in price was not supported by volume. However, this is only a small cause for concern as price can fall of its own weight. It does not require an increase in sellers to push price lower, an absence of buyers will do it on light volume.
At this stage, the most reliable volume indicator for Oil may be On Balance Volume. The upper light blue trend line is now tested five times, so it has reasonable technical significance. While OBV remains below that line the main daily Elliott wave count should be favoured. A break below the lower light blue line would be a strong bearish indicator from OBV.
A range bound trading approach to this market would expect more downwards movement from here to continue until price finds support at the next horizontal red line and Stochastics is oversold at the same time.
This analysis is published @ 08:37 p.m. EST.
Hi Lara, I am really looking forward to today’s update, see what you think is the turning point and the next target down.
Thanks
I can see three possibilities for Oil.
1. Another first and second wave correction is completing. Minor 5 is extending. Use lower targets as provided in the analysis above. This is the most likely because fifth waves to end third wave impulses are very commonly extended for commodities.
2. Minor 5 is an ending diagonal. This is less likely for a commodity. The upwards movement may be a second wave of a diagonal. The move down from the end of minor 4 may be a zigzag for the first wave of a diagonal.
3. Minor 4 may be continuing sideways as a triangle.
What I cannot see is minor 5 complete. It must continue lower.
I still expect lower prices. Use the lower targets. If price comes up to touch either of the two trend lines I will enter another short.
On second thought, if Minor wave 4 is continuing, it may be a triangle. we’ll have to wait and see which scenario plays out or if there is another one?
Agree that as minor 2 was a flat it is less likely that minor 4 is also a flat. However, that is not a hard and fast, rule plus minor 4 would be longer at 21/22 days and therefore alternate in duration.
Dreamer,
If minor wave 4 is still unfolding as a triangle, it could be double the time frame of minor wave 2. I don’t think it would look right.
However, your ending expanding diagonal for minor wave 5 looks possible.
Another possibility could be minor wave 5 has minute wave 3 extension.
Yes, it could be a running triangle.
But two problems I can see with that:
1. it would end well outside the channel
2. it would be much longer in duration than minor 2
The second problem is less of a concern than the first though, because triangles do tend to be more time consuming structures and can be much longer in duration than flats. And still the wave count can have the right look.
As noted below, Minute wave 4 moved into wave 1 territory, so we may have an ending expanding diagonal in play. Minor wave 1 was an expanded flat, so I think it’s less likely that Minor wave 4 is continuing. If an ending expanding diagonal is in play, it may look something like this.
Would love to hear from Lara if this is likely.
The thing that would confirm it is if the last two waves down are zigzags.
An ending diagonal must have all subwaves subdivide as zigzags.
But unfortunately when I look at those waves on the hourly chart it is just not clear.
They could be five wave impulses, or they could be three wave zigzags.
What I can say though is for an ending diagonal the subwaves of 1 and 3 do normally look like three wave structures, they normally are clearly zigzags. These ones aren’t.
So it is a possibility and I will chart it. It must be considered. The invalidation point would be where I have it now at 33.60; the fourth wave of a diagonal can’t move beyond the end of the second wave.
But…
this could also be another first and second wave. If minor 5 is extending.
Fifth waves in commodities most often extend, particularly the fifth wave to end a third wave impulse.
That has a higher probability.
Ups, I edit and my chart disappear, so here is it again.
That always happens if you edit a post with a chart attached, but the chart is actually still there and will show up for you again if you exit the post and then reenter. Just some kind of quirk with the comment add-in I suppose.
True. Just refresh the page.
We already breach the area of minute wave 1 on the march light crude oil futures contract. Which by Elliott Wave rules means this recent rise cannot be minute wave 4.
Also a big positive divergence on MACD and a breach of the 8 day exponential moving average.
I say we finish minor wave 5 yesterday.
Lara what do you think?
Thanks
I think rules never say that wave 4 can not enter wave 1 area…i think rule says that wave 4 can not go beyond the end of wave 2..
Im i right..???
It have to be a diagonal…structure is incomplete…
Or, we are still in MINOR wave 4 and it’s a flat. We have just started minute C up.
Minor 5 is not over because it cannot be a three. It must be a five.
Oil very impulsive looking from the bottom can go places. Might be part of a-b-c flat that will get to 34-36 range?
Deflationary Spiral in the Commodities Sector: Some commodities long term charts.
http://rambus1.com/2016/02/10/wednesday-report-108/
Lara:” At 14.02 minor wave 5 would reach equality in length with minor wave 3. At 11.98 intermediate wave (3) would reach 1.618 the length of intermediate wave (1). If the first target zone of 26.87 – 26.1 is met and passed, then the next target would be 14.02. If that target is met and passed, then the next target would be 11.98.”
Oil is inside the target zone. May be time to tighten stop. OT if oil passes 26.1 then it heading for 14.???
I feel oil vl touch hourly trend line at 24$ in next 2 to 3 trading session to end minor 5
Yes. The lower targets should be used. The target of 26.87 – 26.1 was inadequate.
The structure is incomplete.
Oil is dropping like a rock.
Thanks Lara for your excellent work on oil.
Been following your analysis since oil was at $95 and have made a few bucks along the way.
Just wanted to show my appreciation, keep up the great work!
I agree. Excellent call on oil Lara $$$
Lara..
Oil is near 27 dollar..1$away from our expected targrt..
Does the structure looks to get complete ther..??…or you are having a feeling that it will drop lower..??
Ruppu, this is a rough look at what I see for oil without trying to be exact on the hourly count. I think we go lower, but it’s going to be choppy and a bit challenging to trade. Watch the trend line for an upward break. That may be Minute 4. Being short can be risky as there may be some sharp spikes before the bottom of Intermediate 3 is in. I exited my DWTI trade today with a healthy profit in just 5 days and will wait for another opportunity. Good luck!
Dreamer..
Nice chart.. 🙂
Dreamer
I’m expecting a low just below $23 basis March Crude using other types of analysis. However, I do agree with you that it is not going to be plain sailing on the way down. That price level would conform nicely to your channel.
I’m looking forward to some nice trades on the upside once that channel is broken.
We might get that low. I’ll be looking to go long when it looks like Intermediate wave 3 is over for a swing trade. Could be a sharp move up, then sideways. Intermediate wave 2 was 34 days.
It needs to move lower. The structure is incomplete. Use the lower targets given in the analysis.
Thank u Dreamer….
Can you post an hourly chart with wave labelling…im trying to figure out minutte waves in minor 5..
I think it’s likely that we have 3 small first and second waves and then yesterday was the middle of the 3rd wave since the start of Minute 3. If this is correct, we should see a series of 3 small 4th waves before the bottom of Minute 3. So basically, a slow step down over the next few days.
Looks like both of the alternate counts were invalidated today with a drop down below 28. Lara’s first target zone for the main count is 26.87 – 26.1. With the break of the neckline, the H&S pattern looks valid also.
Weekly chart. Watch the wedge for support and resistance. A break above the wedge will be very bullish when it happens.
Zoom out look at the wedge.
I agree, good analysis, and yes $24 seems to be the target for that short term H&S pattern. The wedge pattern in the weekly chart also seems clear and bullish.
I guess we will have a strong intermediate wave 4, if thats the case. But it concerns me that intermediate wave 3 seems less impulsive than intermediate wave 1. Maybe we are still just in minor wave 1 of intermediate wave 3. That would make more sense to me.
Thanks
H&S pattern needs a break below the neckline to confirm
I’m looking at that H&S formation too. A solid breach of that neckline could be early confirmation of Lara’s main count.