
Price has moved sideways since last analysis.
The Elliott wave count remains valid.
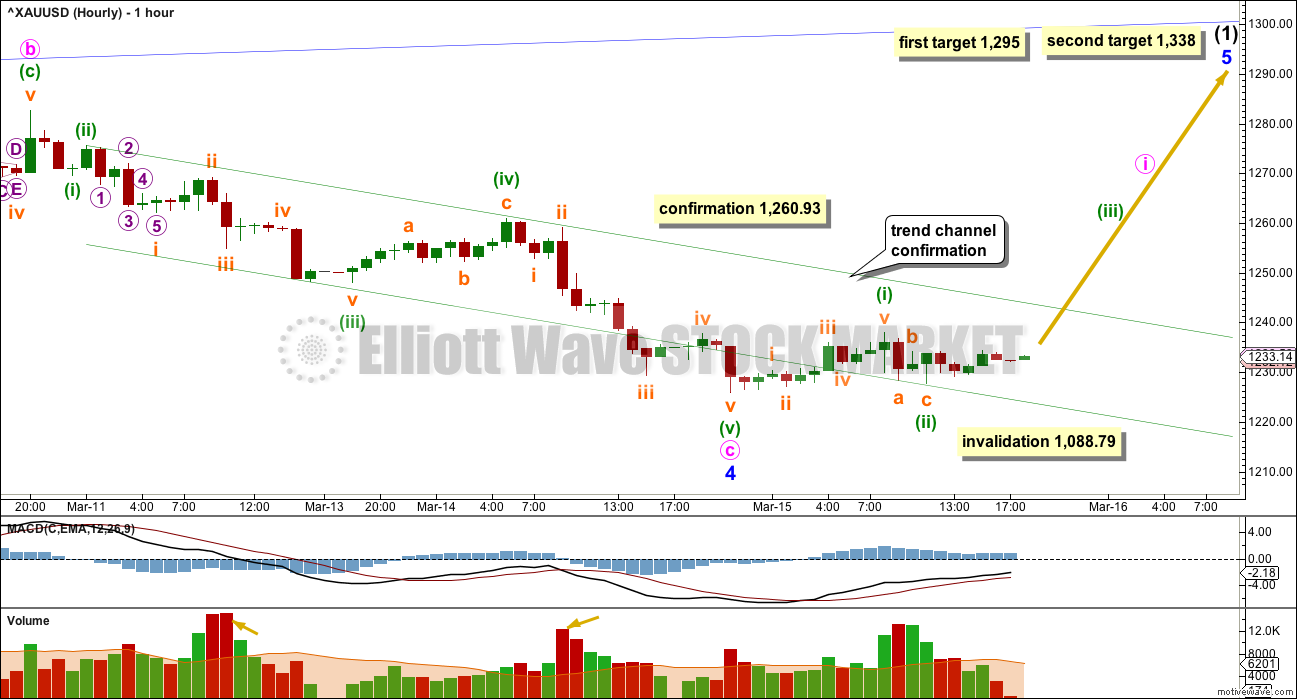
Summary: A new high above 1,260.93 by any amount at any time frame would provide confidence that Gold is most likely in a fifth wave up. Fifth waves for commodities can be swift and strong. The first target is at 1,295. If price keeps going up through the first target, the next target is at 1,338. If downwards movement continues, these targets must move correspondingly lower.
New updates to this analysis are in bold.
Last published weekly chart is here.
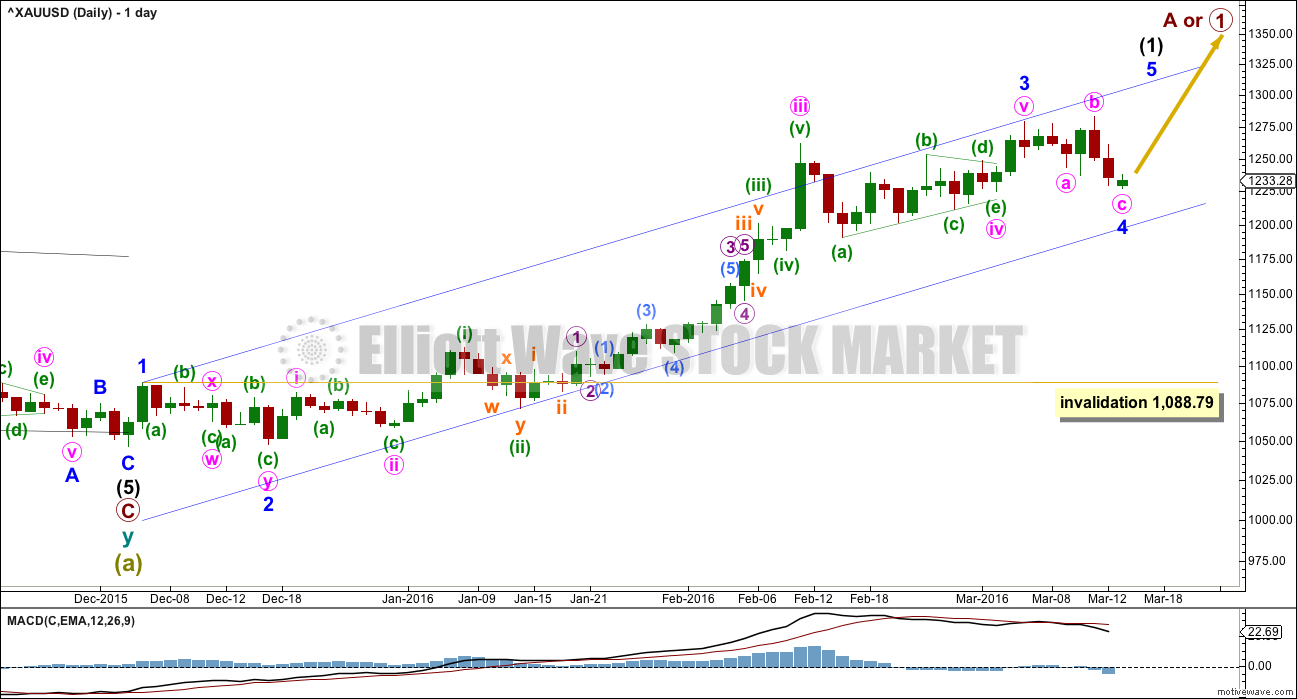
DAILY ELLIOTT WAVE COUNT
Click chart to enlarge.
Gold has very likely changed from bear to bull.
So far, within the first five up, the middle of the third wave is now most likely complete. The strongest move may still be ahead. Gold often exhibits swift strong fifth waves typical of commodities. Minor wave 5 may be strong and may end with a sharp upwards day on a volume spike.
Ratios within minor wave 3 are: there is no Fibonacci ratio between minute waves iii and i, and minute wave v is just 0.07 short of 1.618 the length of minute wave i.
Minor wave 2 was a very deep 0.97 double zigzag lasting nine days (one more than a Fibonacci eight). Minor wave 4 may be complete today as an expanded flat correction lasting seven daily candlesticks (one less than a Fibonacci eight). This gives the wave count a reasonable look in terms of proportions. There is perfect alternation between the deep double zigzag of minor wave 2 and the very shallow 0.23 expanded flat correction of minor wave 4.
Minor wave 4 is within the price territory of one lesser degree. Minute wave iv has its range from 1,261.94 to 1,190.9.
At this stage, it looks like minor wave 4 may be over but this is not confirmed by price. The invalidation point must remain at 1,088.79 while there is no confirmation. Prior to confirmation, this is the risk today with this wave count.
Minor wave 4 may not move into minor wave 1 price territory below 1,088.79.
HOURLY ELLIOTT WAVE COUNT
Click chart to enlarge.
Minor wave 4 may now be complete as an expanded flat correction. Within minor wave 4, minute wave b was a 1.09 correction of minute wave a. There is no Fibonacci ratio between minute waves a and c.
Ratios within minute wave c are: there is no Fibonacci ratio between minuette waves (iii) and (i), and minuette wave (v) is just 0.12 longer than 2.618 the length of minuette wave (i).
Within minuette wave (iii), the third wave of subminuette wave iii shows strongest volume.
Within minuette wave (v), the third wave of subminuette wave iii shows strongest volume.
Minuette wave (iii) has stronger momentum than minuette wave (i) and minuette wave (v) has stronger momentum than minuette wave (iii).
This wave count fits with momentum and volume.
1,260.93 is the start of minuette wave (v). If minuette wave (v) is not over and extending further, then within it no second wave correction may move beyond the start of its first wave. A new high above 1,260.93 could not be a second wave correction within minuette wave (v), so at that stage minuette wave (v) would have to be over. This would provide some price confirmation of a trend change.
It is possible that the expanded flat structure is the first flat in a double flat for minor wave 4, or only wave A of a larger flat for minor wave 4. A five up at the hourly chart level would eliminate this possibility.
It is very likely that minor wave 4 is over today because the wave count has the right look with good proportions at the daily chart level. If it were to continue further as a double flat, it may begin to be out of proportion.
If minor wave 4 has ended here, then at 1,295 minor wave 5 would reach 1.618 the length of minor wave 1. If price keeps going up through this first target, or when it gets there the structure of minor wave 5 is incomplete, then the next target is the next Fibonacci ratio in the sequence. At 1,338 minor wave 5 would reach 2.618 the length of minor wave 1.
So far it looks like there may be a small five up on the hourly chart, although minuette wave (i) will also subdivide as a zigzag. What is clear today is the following downwards movement labelled minuette wave (ii) is a three wave structure.
There is still no confirmation of a trend change. In the first instance, a breach of the channel about minute wave c would provide earliest confirmation. When price breaks above the channel look for a throwback to test the upper edge for support. If price behaves like that, it would offer a reasonable low risk entry to join the trend.
TECHNICAL ANALYSIS

Click chart to enlarge. Chart courtesy of StockCharts.com.
Three days in a row now of red candlesticks (on StockCharts data) on clearly declining volume indicates that the fall in price is not supported by volume, so is suspicious.
During the consolidation which began on 7th March, it remains an upwards day which has strongest volume. This indicates an upwards breakout is more likely than downwards.
ADX is declining, indicating the market is not trending. ATR for the last day is also declining.
On Balance Volume has come down to find support at the short orange trend line. This line is not long held, but it has been tested three times now and is almost horizontal. It has some technical significance. A break below this line would be a bearish signal. If OBV turns up from this line, the strength would be reinforced and would be a bullish signal. A break above the blue and green lines by OBV would be further bullishness.
RSI is now very close to neutral. This correction has resolved RSI being overbought. Stochastics has also returned from overbought. There is room for price to rise or fall.
This analysis is published @ 07:10 p.m. EST.
The close above 1260 on the NY Comex portends further gains in store.
And we have price confirmation of a trend change.
If volume for todays green candlestick is high that would add further confidence that this is an upwards breakout underway at the daily chart level.
From a regular TA POV though we don’t have a breakout yet, that would require a new high on a day with increased volume.
For the EW count though this is enough.
As always, volume will be interesting and indicative of what price is likely to do next.
Dont be surprised if we get further upward action overnight in Hong Kong that many of the present Commercials holding short hedge positions may wish to cover . This could add to upward impetus !
Hmmm. Kind of reminds me of the time I made over $500,000.00 in under 6 months on a $50,000 .00 investment in March Sugar futures. Golden Moments.!
Not sure where we are at E.Wave wise , but we still look good technically with stochastics and RSI etc. So although I have taken profits on half my comex positions I am going home still long o n any close over 1260 and change. Good Luck all.
What is your best guesstimate as to where we are now , lara ? I have sold half my positions as we seem to be experiencing resistance at the 1260 level .
Maybe at or close to minuette (iii) end.
But remember, this is all most likely within only minute wave i of minor 5.
Looking for a small fourth wave correction to move sideways, to be shallow, and not move below 1,237.90. That’s the high I have labelled minuette (i) on the hourly chart.
Starting to write up analysis now. Should be published in another hour or so.
And I think I can see an exhaustion gap on the five minute chart.
That may be all for now.
A small fourth wave correction may begin about here to remain above first wave price territory, minuette (i) has its high at 1,237.90.
And no… it keeps on going. No correction yet.
It will come. But not yet.
It’s a dream wave, too bad we can’t have one of these every week 🙂
IKR
It’s a clean three foot peeler to the left 🙂 And I’m in the barrel!
Closed out my GLD April 15th call I bough yesterday for $1.53; buy average price 0.905. It’s a 69.4% gain…
Thank you Lara!
I’ll wait for that 4th wave now…
Hope everyone is enjoying surfing the wave today 🙂
Incredible trade 69.4% in 1 day.
I don’t like to be in and out. I like to ride the wave all the way to the beach 🙂
I’ve got a good entry within minuette (i) price territory so I’ll hold that for another day or two at least, and only exit when I can see the structure of minor wave 5 possibly complete and preferably a break below a trend line or channel.
These price spikes are typically severely retraced.
However, that does not mean it must be fully retraced and that price will make a new low. I do not expect that.
I expect this is the start of minor wave 5 upwards to new highs still. Along the way there will be corrections. I will plan on using those corrections to add to my position, which was small because we didn’t have any confirmation of a trend change.
Now we have a clear channel breach. For Gold that is some reasonable confirmation. But its not as good as price confirmation.
This strong move up looks like a third wave. It is supported by volume. This may be minuette (iii) as per the hourly chart above.
The invalidation point will now be moved up to the end of minor 4 at 1,226.59 on the hourly chart.
When price breaks above 1,260.93 then I may move it up on the daily chart also.
Good luck everybody!
Pfew… was long too… had some emotions today with stop at 1224.5… 🙂 Aparently, I think we had a expanding ending diagonal for wave 5 of C at 1234 so wave 1 is 1225-1234 gives us 9 points, target for a wave 3 can be 2,618x or more if it takes out 1250 now! Then 4 then 5 up to… 1295? 🙂 Thx Lara
You made my DAY!!!! Thanks Lara
You’re welcome 🙂
My day’s looking pretty profitable too
TELL ME WHERE TO SEND YOUR case of wine . Do you and ceasar prefer red ?
🙂
The dryer the better.
TRUST IN SURFER GIRL! I have been long bou-coup April Gold comex contracts from 2 days ago knowing our NewZealand Kiwi would get it right Thank you Lara.
Yay. I held on too for a couple of days watching paint dry.
I was checking the hourly volume data last night and noticed that during that tired sideways move it was an upwards hour with strongest volume. So I felt pretty confident leaving that position.
Gold and GDX, MACD short and longer terms and looking more bearish today than Tuesday although GDX and NUGT didn’t go quite as low as Tuesday lows. Gold is in a 2 day consolidation waiting to move. Lara has mentioned the breakout up may be more likely. I’m hoping the FED FOMC at 2 pm turns gold and GDX up, otherwise I’ll sell the small quantity that I have. Sometimes FED FOMC news can have a effect for days or longer.
Minuttee 2 is a double zigzag till now..
Comment
Yes it was a dz…now breakout happend…and its hard one…still in 1 of wave 3
http://www.capitalmarketssummit.com/
Wednesday 2:00 pm EST US FED FOMC news release
then 2:30 pm Janet Yellen conference
Dollar tips higher on signs U.S. inflation continues to rise
Mar 16, 2016 10:19 a.m. ET
Buck may be sensitive short-term to hawkish surprise at Wednesday’s 2 pm Fed meeting
http://www.marketwatch.com/story/dollar-tips-higher-with-us-rate-gap-in-play-2016-03-16
Fed Meeting Could Be Negative For Gold; Watch $1,220 Level – Analysts
By Neils Christensen of Kitco News
Tuesday March 15, 2016 12:48
http://www.kitco.com/news/2016-03-15/Fed-Meeting-Could-Be-Negative-For-Gold-Watch-1-220-Level-Analysts.html
Gold price appears top heavy under 1238/20dma…. A short term down move (pullback) is expecting before an upside move; lets see if the expected drop can take out 1221…
*just wondering: narrow range inside day so far, this could be explosive!* lol….
yeah it looks like gold is pointing down… the COT data is probably right. Seems like we can’t get above 1235 on gold… GDX and NUGT getting hammered going into the FED announcement.
Here’s my rough game plan for GDX. If this is correct, we may move up in the AM to complete wave D, then a quick move down to complete wave E (maybe after the Fed announcement), then a move up with gold for maybe 3 days. Then a larger correction for maybe 3 weeks.
Dreamer, Thanks for sharing your great chart.