
Upwards movement was expected but did not happen.
Downwards movement has invalidated one Elliott wave count.
Summary: It looks like price has broken out of a range to the downside. The main wave count will expect intermediate wave (2) downwards is underway. A clear break below the blue channel on the daily chart would add confidence and see this the only wave count. A new high above 1,240.65 would put this idea in doubt, and a new high above 1,270.85 would invalidate it. If that happens, then an alternate wave count expects a fifth wave up to 1,284.
New updates to this analysis are in bold.
Last published weekly chart is here.
MAIN DAILY ELLIOTT WAVE COUNT
Click chart to enlarge.
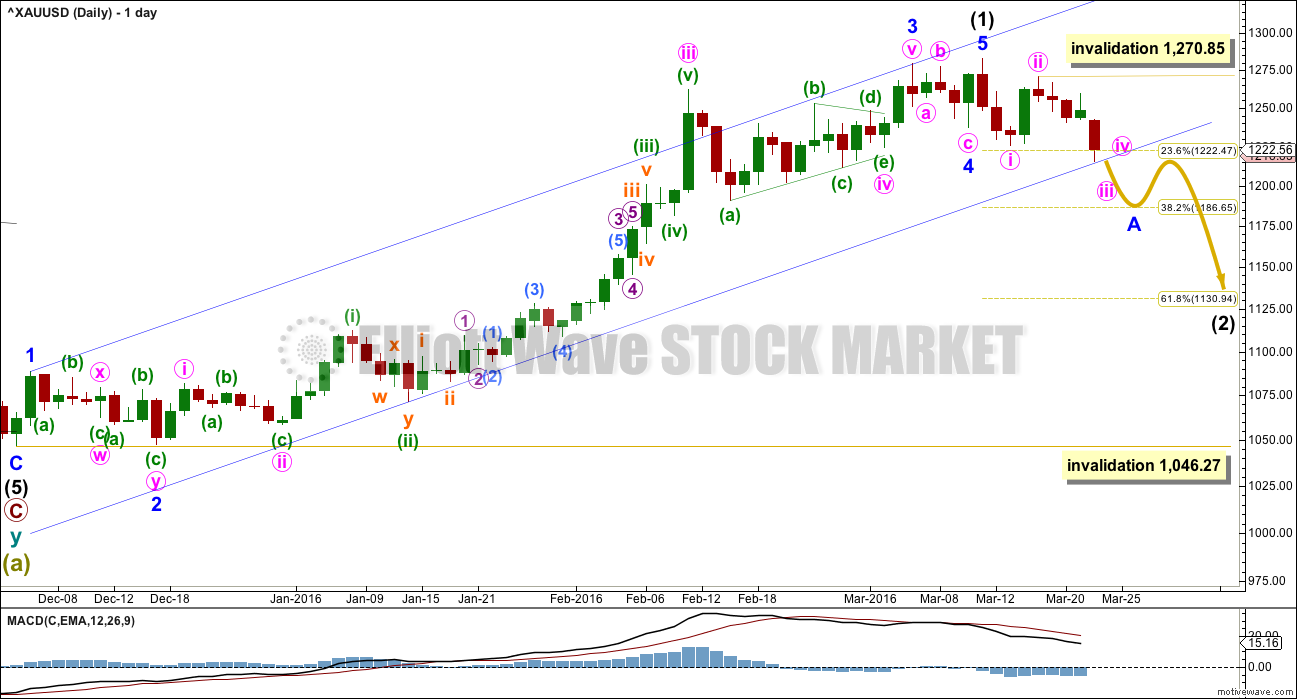
Intermediate wave (1) may be a complete impulse. Intermediate wave (2) may have begun. COT supports this wave count; the majority of commercial traders are currently short. While this does not pinpoint when price should turn, it does support a larger downwards trend about here.
This wave count is identical to the alternate wave count up to the end of minor wave 3 . Thereafter, this main wave count sees minor wave 4 over earlier as a regular flat correction. There is still alternation between minor waves 2 and 4: minor wave 2 is a deep 0.97 double zigzag and minor wave 4 is a shallow 0.18 regular flat. The proportions are not as good though: minor wave 2 lasted nine days and minor wave 4 only four days. This slightly reduces the probability of this wave count; the alternate will be published until it no longer has the right look.
Ratios within intermediate wave (1) are: there is no Fibonacci ratio between minor waves 1 and 3, and minor wave 5 is 2.95 points longer than equality with minor wave 1. This good Fibonacci ratio adds a little support for this wave count.
A movement at intermediate wave degree should begin with a five down on the daily chart. That is incomplete. The invalidation point may be moved lower today. Within minute wave iii, no second wave correction may move beyond the start of its first wave above 1,270.85.
MAIN HOURLY ELLIOTT WAVE COUNT
Click chart to enlarge.
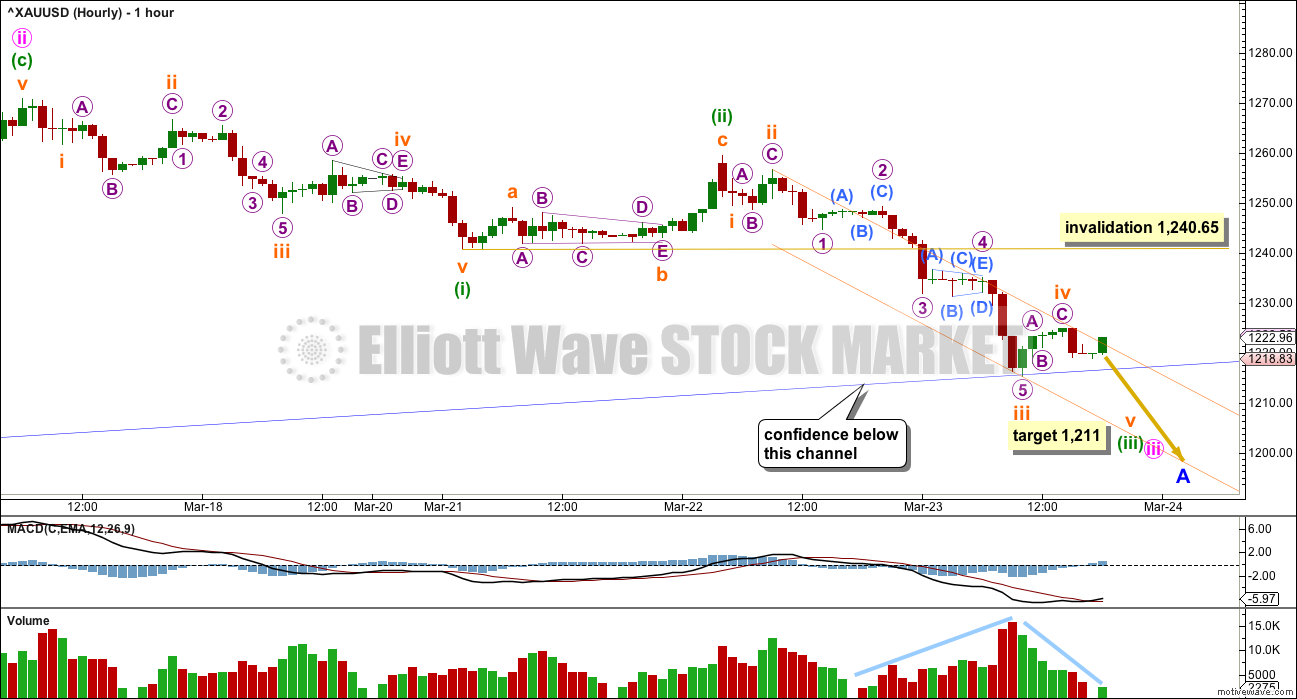
Minute wave iii should be underway for this wave count; it has made a new low below the end of minute wave i. MACD shows momentum so far within minute wave iii is slightly stronger than momentum within minute wave i. Minute wave v downwards may be stronger still, which is typical of commodities.
At 1,211 minuette wave (iii) would reach 1.618 the length of minuette wave (i).
If the lower edge of the blue channel copied over from the daily chart is clearly breached by at least one full hourly candlestick below and not touching it, and if that candlestick is a strong red candlestick, then this wave count would increase in probability.
If the blue channel is breached at the daily chart level, then this would be the only wave count.
Within minuette wave (iii), subminuette wave iii is just 1.06 short of 4.236 the length of subminuette wave i.
One more wave down for subminuette wave v would be required for this wave count to complete minuette wave (iii). The subdivisions of this downwards movement are seen differently for each wave count, and both ways work on the five minute chart.
In the short term, the volume profile fits this wave count better. The volume spike may have been to end subminuette wave iii (third waves should have strong volume). Upwards movement from the low for subminuette wave iv comes on a decline in volume. In the short term, this indicates upwards movement is most likely a counter trend movement.
The small orange channel is drawn using Elliott’s second technique: draw the first trend line from the ends of subminuette waves ii to iv, then place a parallel copy on the end of subminuette wave iii. Subminuette wave v may find support at the lower edge of the channel. Along the way down, upwards corrections should find resistance at the upper edge of the channel.
For this wave count, because minuette wave (ii) shows on the daily chart as one small green candlestick, when minuette wave (iv) arrives it may also show on the daily chart as one or more green candlesticks or doji. Minuette wave (ii) lasted one day and was a deep 0.625 zigzag. Minuette wave (iv) may be a little longer lasting and may be a shallow sideways flat, combination or triangle to exhibit alternation.
Minuette wave (iv) may not move into minuette wave (i) price territory above 1,240.65.
ALTERNATE DAILY ELLIOTT WAVE COUNT
Click chart to enlarge.
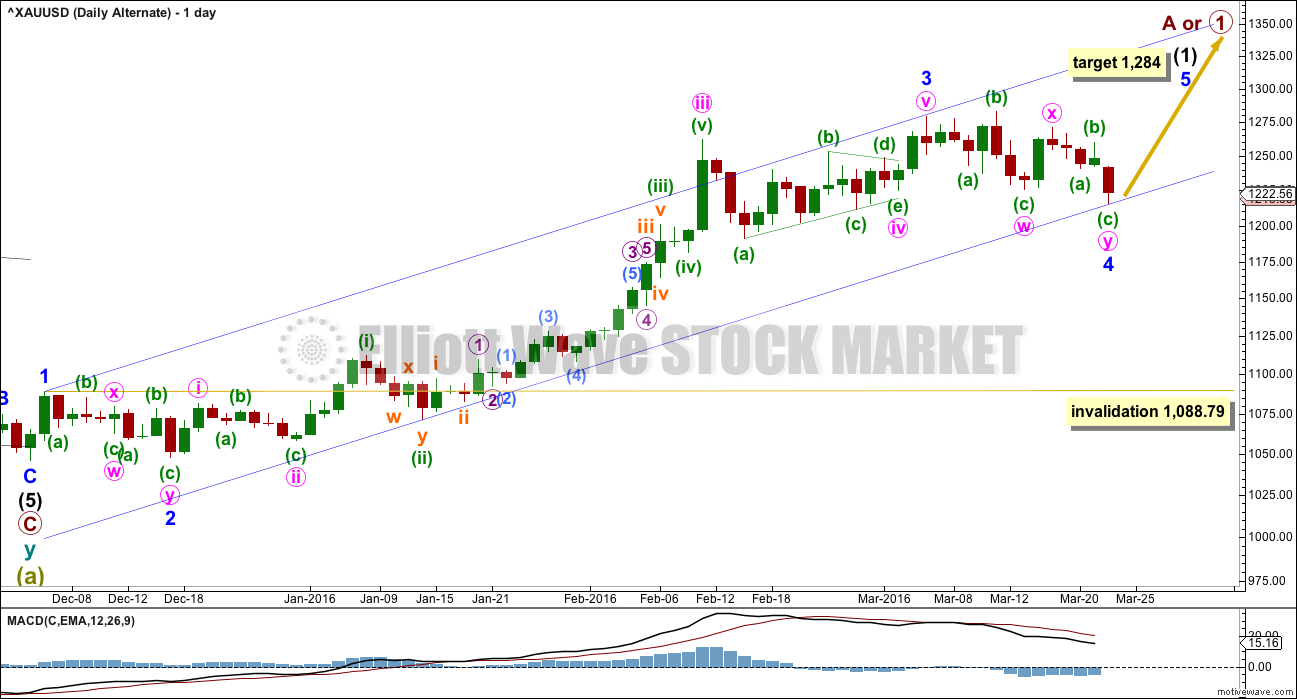
The strongest move may still be ahead. Gold often exhibits swift strong fifth waves typical of commodities.
Ratios within minor wave 3 are: there is no Fibonacci ratio between minute waves iii and i, and minute wave v is just 0.07 short of 1.618 the length of minute wave i.
Minor wave 4 may be complete as a double combination: expanded flat – X – zigzag. The structure is now complete and price has found support at the lower edge of the blue best fit channel. Downwards movement must end here for this wave count.
Minute wave y has ended slightly below minute wave w; the structure still has a mostly sideways look to it. But it must end here if it is to retain the right look.
At 1,284 minor wave 5 would reach 1.618 the length of minor wave 1.
Although the invalidation point must technically be placed at the high of minor wave 1, this wave count would be discarded if price breaches the lower edge of the blue channel at the daily chart level. Minor wave 4 may not move into minor wave 1 price territory below 1,088.79.
There is perfect alternation and good proportion between minor waves 2 and 4. Minor wave 2 is a deep double zigzag lasting nine days (one more than a Fibonacci eight), and minor wave 4 is a shallow combination lasting a Fibonacci thirteen days.
ALTERNATE HOURLY ELLIOTT WAVE COUNT
Click chart to enlarge.
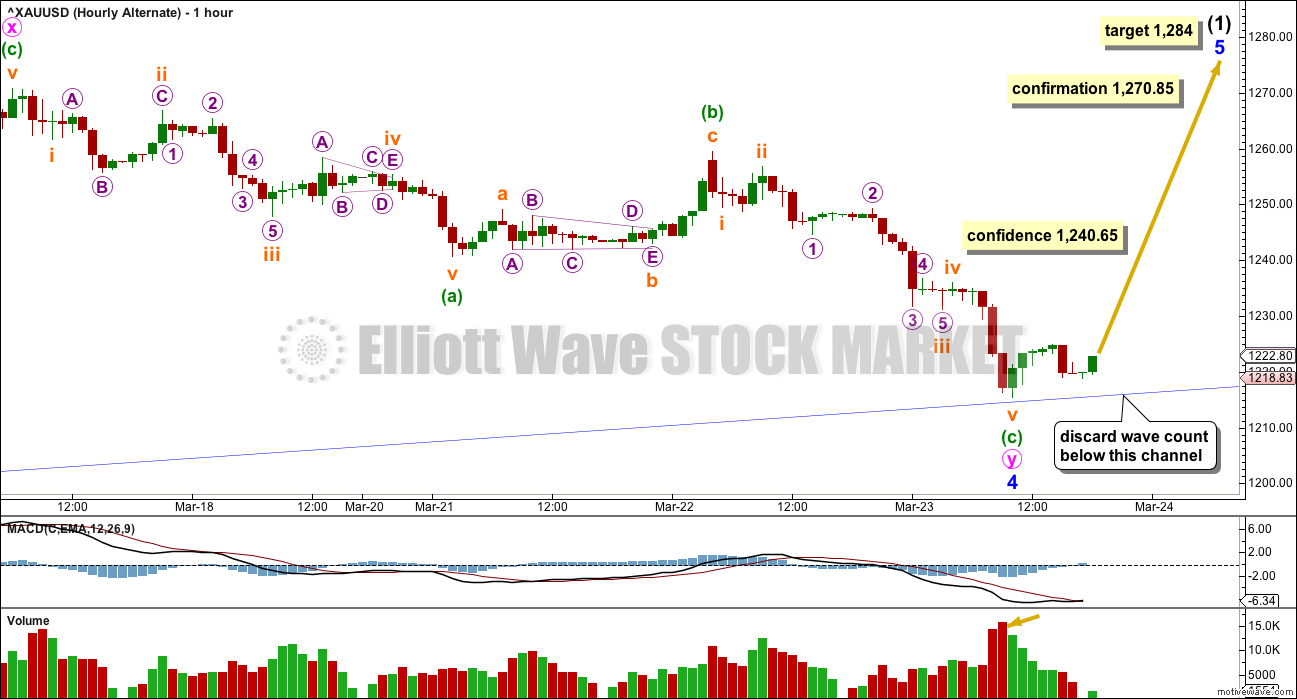
My analysis yesterday of the downwards wave labelled minuette wave (a) was wrong.
This movement does not work with the larger picture anymore if seen as a three. It must be a five and will fit as an impulse, if subminuette wave ii is seen as an expanded flat with a very long B wave, which is over twice the length of the A wave. Although this has a low probability, all Elliott wave rules are met, and this low probability labelling has now been proven correct by subsequent price movement.
Downwards movement for minuette wave (c) will subdivide as a completed five wave impulse on the hourly and five minute charts. There is no Fibonacci ratio between minuette waves (a) and (c).
Minuette wave (c) may have ended with a volume spike for the final fifth wave. However, it is concerning for this wave count in the very short term that subsequent upwards movement is not supported by volume.
Some confidence may be had in this wave count with any movement above 1,240.65. At that stage, the main wave count would be invalidated at the hourly chart level. This wave count would be confirmed with movement above 1,270.85.
If the target is wrong, it may be too low. If this wave count is confirmed, then higher targets may also be added.
TECHNICAL ANALYSIS
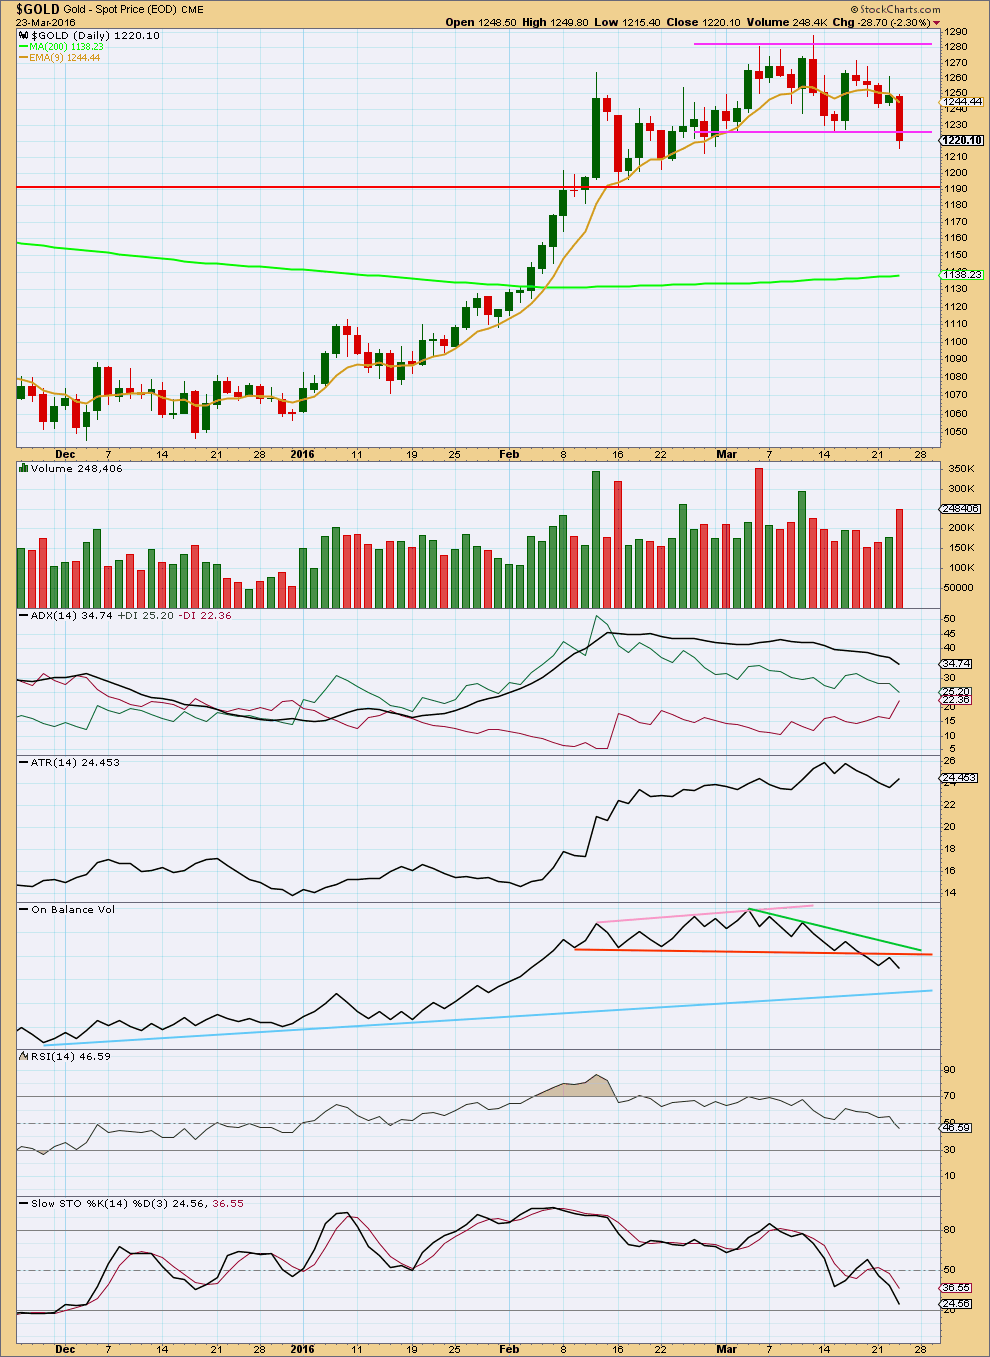
Click chart to enlarge. Chart courtesy of StockCharts.com.
A strong downwards day with a clear increase in volume has closed below the lower support line. This looks like a downwards breakout.
On Balance Volume has turned down from the orange trend line, reinforcing the strength of this trend line. This is a further bearish signal. That line is horizontal and now tested four times, so it has reasonable technical significance.
ADX is declining indicating the market is not trending. ATR today is increasing which may be the earliest signal of a trend returning. Less confidence may be had that a new trend is beginning while these two indicators disagree.
RSI and Stochastics are moving lower and neither is yet extreme. Stochastics may remain extreme for reasonable periods of time during a trending market. If RSI reaches oversold and then exhibits divergence, then an interruption to a downwards trend should be expected. For now there is room for price to fall.
This analysis is published @ 07:57 p.m. EST.
I would stick with Lara’s analysis any time for the clarity, attention to detail, precise and concise like no other…..How any one of us trades this and what Gold price ends up doing at the end of the day is another matter! Good luck all and Happy Holidays…. 🙂
Syed, very well said about Lara. When I’ve checked out the rest, I stay with the best, gold adviser I’ve ever found in many, many ways, Lara.
FYI Analysis today will be done in a few hours.
I have to travel today to Muruwai. I’ll be doing Gold analysis when I arrive.
You have the hourly charts already. They won’t change while price hasn’t moved out of that range.
Tomorrow is Easter Friday. I know NY will be closed, so I’m not sure there will be any price movement to analyse for Friday for Gold.
For the alternate wave count price has to move above 1,240.65 now.
If we see a new low before that happens then I am struggling to see how that would fit ATM. Which is not to say that’s not possible, just that I can’t see it yet. A new low would see a stronger break below the blue trend line, that would further reduce the probability of this alternate wave count.
For the main wave count price now has to move up / sideways for several more hours, probably about 24. This should be a small fourth wave correction for minuette (iv). This sideways and upwards movement from the low is too long in duration to be part of the prior wave down, it breaks too far out of a channel containing that last wave down.
Minuette (ii) was a deep 0.625 zigzag lasting 26 hours. Minuette (iv) may be more shallow and time consuming; a flat, combination or triangle. The 0.382 Fibonacci ratio is the best target for it at 1,231. Use the green Elliott channel for resistance.
Now, although there is a complete 5-3-5 down this movement is far too shallow and too brief to be intermediate (2) either complete here or close to completion.
I would expect intermediate (2) to be longer lasting and deeper. It hasn’t even reached the 0.382 Fibonacci ratio yet. The 0.618 ratio is more likely.
A weekly close below $1,222 within the next 3 trading weeks will activate the $1155 target in 4 weeks -GUNNER24
http://www.gunner24.com/uploads/RTEmagicC_gold_weekly_11candle_G24up.jpg.jpg
Gary Wagner does Elliott Wave for Kitco.
He has gold intermediate wave (1) already completed at the March 11th high and now has gold already in intermediate wave (2) heading down in a C wave.
Lara’s analysis Wednesday main wave count has gold in an intermediate wave (2) down.
Go to the chart at the bottom of the article and click on it to enlarge it.
Gary gives an updated gold chart every day on thegoldforecast.com
http://thegoldforecast.com/video/stocks-swoon-along-gold-and-oil-keep-your-eye-fed-rates
Oh dear. That’s the nicest thing I can say about that chart.
Wave 1 looks strongly like a three wave structure, as does wave 5.
First and fifth waves may only subdivide as fives within an impulse.
I do not think that analysis is of much use, the person doing it does not appear to have a very good grasp of Elliott wave.
That’s funny as Gary is Kitco’s EW star and give gold analysis daily for their clients. I guess you don’t have to make good EW charts to have a popular column. Your one of a kind Lara. You’re an Elliottician who makes proper EW charts.
I’m looking at a few more of his EW counts. This one has a first wave which is a big three wave structure. And an ending diagonal which violates the rule for wave lengths, the third wave is longer than the first but the diagonal is contracting.
I would not follow this persons work. It would more likely point you in the wrong direction.
That’s the thing about EW. The rules are black and white.
Sometimes (like when I saw EWI publish a wave count which violated the rule for wave lengths within a contracting diagonal) I wonder, am I doing this wrong? Why are other Ellioticians treating the rules as not black and white?
I don’t understand.
They don’t understand EW enough.
Gary said it takes years to learn EW and a lifetime to master EW.
Hopefully he is still studying EW.
Oh dear…
I have contacted Kitco once before to ask them if they’d like some more EW analysis. I never heard back from them.
I guess Mr Wagner is quite entrenched there.
I am sure he is an experienced and good technical analyst. The assumption is he must be if he’s doing analysis for Kitco. But I see technical problems with his EW counts.
I’ll try contacting Kitco again in the nicest most polite way possible…
Gary Wagner used to only write a Kitco EW gold article once a week and often did and still does a short video about gold with Daniela Cambone at Kitco.
http://www.kitco.com/news/video/show/Chart-This/1168/2016-02-04/Will-Nonfarm-Payrolls-Help-Gold-Silver-Bulls—Gary-Wagner
I think Danirla may be the top person there and also interviews about 4 experts weekly about gold. Gary went to a daily article and chart about 1 1/2 years ago. He does offer numerous packages of his EW analysis service. Kitco is in Montreal but Gary lives in Hawaii.
Avi Gilburt has for about the last year done a once a month short EW gold video interview with Daneila.
Opinion: You can expect gold to extend its decline
Published: Mar 24, 2016 10:24 a.m. ET
Sentiment conditions don’t favor a strong rally
http://www.marketwatch.com/story/you-can-expect-gold-to-extend-its-decline-2016-03-24
The Hulbert Gold Newsletter Sentiment Index
http://hulbertratings.com/gold-sentiment/
MACDTwoLines for GDX came back to Buys again for 5, 15, 39 and 78 minutes now
MACDTwoLines for Gold came back to Buys for 39 and 78 minutes now
This activity from 1212.3 low looks like subminute iv. I am hoping for a 38% retrace back to 1230-1231. I do hope I am wrong and it somehow morphs into a 1-2 but cannot see that on 1 or 5min chart. My hope is also because of personal reasons because I have 2 trading accounts, 1 for day trading and 1 for long term and on last I have a very long position that I took like 2months ago at around 1180 and was waiting to close it 1300+. Guess it is time to reconsider that for now, if indeed there is a 5th wave coming that would be bad, though good for short i guess but with bigger risks because of going against the major long trend 🙁 Does anyone think now maybe minor 4 ended at 1212.3 and somehow the activity since low looks impulsive? Because I absolutely agree with Lara, if it is minor4 end it must end at this low 1212.3 and take out 1225 and then 1230 and 1240… And Lara, do you think it is possible if this intermediate 2, maybe where you have placed minute i at 1225.65 (15.03 low) that is actually wave A and where you placed minute ii at 1270.85 (17.03 high) that is actually wave B so that now we just make an extended 1-2-3-4-5 wave C and end the intermediate 2 abit shorter then expected in price and time (maybe around the 50% retrace?) Thanks in advance 🙂
DORIAN, what I can tell you is that I had small GDX position overnight and already sold it at 9:42 am for $19.47 as then it looked like GDX and gold would drop and also this comment from Lara at 5 am below scared me about a new low. You may want to re-read her whole comment.
“Subminuette wave v may be an ending expanding diagonal (there’s a lot of overlapping in there) requiring one more low to complete the structure.
And then for the main count minuette wave (iv) should begin to move up / sideways for a day or so.”
I didn’t want to hold my GDX over a long weekend if direction is unclear.
Right now on http://www.pmbull.com/gold-price/ it looks like gold just hit a 10 or 15 minute upper trend line and may go down?
Yep… if it looks like a wave iv, that is probably what it is, it might not be able to take out even 1224-1225, unless it overshoots above to 1231 and that’s it… hard to trade this, gonna sit and wait abit now… already closed half my longterm positions… I go to walk in the park or smth I think lol :))
I have asked you three times now to break up your walls of text.
Any further walls of text will be deleted.
Its a very tough market right now Lara…
You are correct…being away and watchng it is a gud call..
For me a full DAILY candlestick breaching the lower edge of blue channel on daily chart and not touching it will be the end of int(1)..
At least now we have two relatively close by price points to tell us which wave count is correct: 1,212.72 and 1,240.65.
A break above and the alternate is correct, the trend for now is up.
A break below and the main is correct, the trend for now is down.
We should have price indication and some clarity in one or two trading sessions.
Thursday ‘all day’ I want GDX to stay above $18.86 for Avi Gilburt bullish
and Gold to stay above $1,219 for Lara bullish not breached
and Gold to close above $1,222 for GUNNER24 so doesn’t drop to 1,155 target in 4 weeks.
Richard, I can now see two full hourly candlesticks below the lower blue trend line.
At the daily chart though this is just a small overshoot. So it is not enough to discard the alternate wave count… yet.
I can also see declining volume as price moves lower and divergence with MACD. Again, doesn’t say price must turn up from here, only that downwards movement is weak.
Subminuette wave v may be an ending expanding diagonal (there’s a lot of overlapping in there) requiring one more low to complete the structure.
And then for the main count minuette wave (iv) should begin to move up / sideways for a day or so.
If you are holding longs and your loss reduces with that then you may want to rethink holding them if price cannot break above 1,240.65. Because there is a very real possibility that intermediate wave (2) may be underway.
If price can break above 1,240.65 then the probability that we shall see a final fifth wave up to new highs will increase. And then your longs would become profitable.
I am hoping that structure of the upwards movement when it arrives may provide clues. But as you know and we have seen, sometimes I get that wrong. I thought the wave down I’ve labelled minuette (i) was a double zigzag. But it wasn’t.
Lara, I’m thankful that you were able to see a possibility for minor 5 end. (I agonized a couple days over suggesting it) The price points that you’ve provided us now for determination of which wave count is correct is exactly ‘the exciting’ info I’m confident you do right. I’m confident price WILL NOT elude EW forever!
“If price can break above 1,240.65 then the probability that we shall see a final fifth wave up to new highs will increase.”
“if price cannot break above 1,240.65…there is a very real possibility that intermediate wave (2) may be underway.”
Keep up the good work! 🙂
Always have to consider “what if I’m wrong?”
Because in the world of technical analysis, an analyst will always be wrong from time to time. That is simply the nature of the markets.
If anyone could always be right then we’d all be billionaires.
It’s an exercise in probability and risk management.
Even The Bulls Are Expecting A Pullback In The Gold Price
Avi Gilburt EW – March 23, 2016
The last line of the article has links to charts on GDX, GLD and Silver.
http://www.gold-eagle.com/article/even-bulls-are-expecting-pullback-gold-price
Avi Gilburt lower support level
GDX 18.86 March 23 close 19.03
If follow through below 18.86 GDX that tells me that wave ii is likely in progress, with an outside possibility as much as 35% that lower lows may be seen.
GLD 117.95 March 23 close 116.61
Silver 15.17 March 23 close 15.25
Gold likely to have topped, Silver and Miners going to join –
GUNNER24 March 20, 2016
SELL A WEEKLY GOLD CLOSE BELOW $1,222
http://www.gunner24.com/newsletter/nl-032016/
Signal situation: A weekly close below $1222 within the next 3 trading weeks will activate the $1155 for the 21st week of the uptrend. $1155 is the center of the first square, so it would mean a sane 50% correction of the 11 week first initial up impulse!
Here’s the COT graph from last Friday showing the extreme short positions of the Commercials
A slight new low indicates the labelling of the hourly chart for this last wave down was more likely correct than the alternate. This last low may be a fifth wave.
Price is right on the blue trend line. Let us see what happens here. If price breaks below that line then the main wave count would be supported and increase in probability.
If price bounces up from there then the alternate needs movement above 1,240.65 for confidence.
I reckon we still need a slight new ‘slight new’ low to make a (micro?) five down. Thereafter, my heart still says this is minor 4 ending. Heart, of course, is dangerous. We shall see.
I have a small position of GDX and I am praying now that gold gets bullish NOW and follows the new hourly alternate without a proper breach below that blue trend line at around 1,218 now. It finishes a quick and short fifth wave to end minor wave 4 then high tails it into North country.
Gold just dropped $7 in 16 minutes to make a new low for minor wave 4 at 1,214.89 at 11:16 pm EST. Now the gold bull heads north.