
Upwards movement was unexpected and invalidated the hourly Elliott wave count.
Summary: Two wave counts today both expect more upwards movement. It is reasonably likely that price will reach to 1,275.24. Upwards movement is most likely a B or X wave within a larger correction for intermediate wave (2). It is possible but unlikely that this upwards movement is the start of intermediate wave (3).
New updates to this analysis are in bold.
Last published weekly chart is here.
MAIN DAILY ELLIOTT WAVE COUNT
Click chart to enlarge.
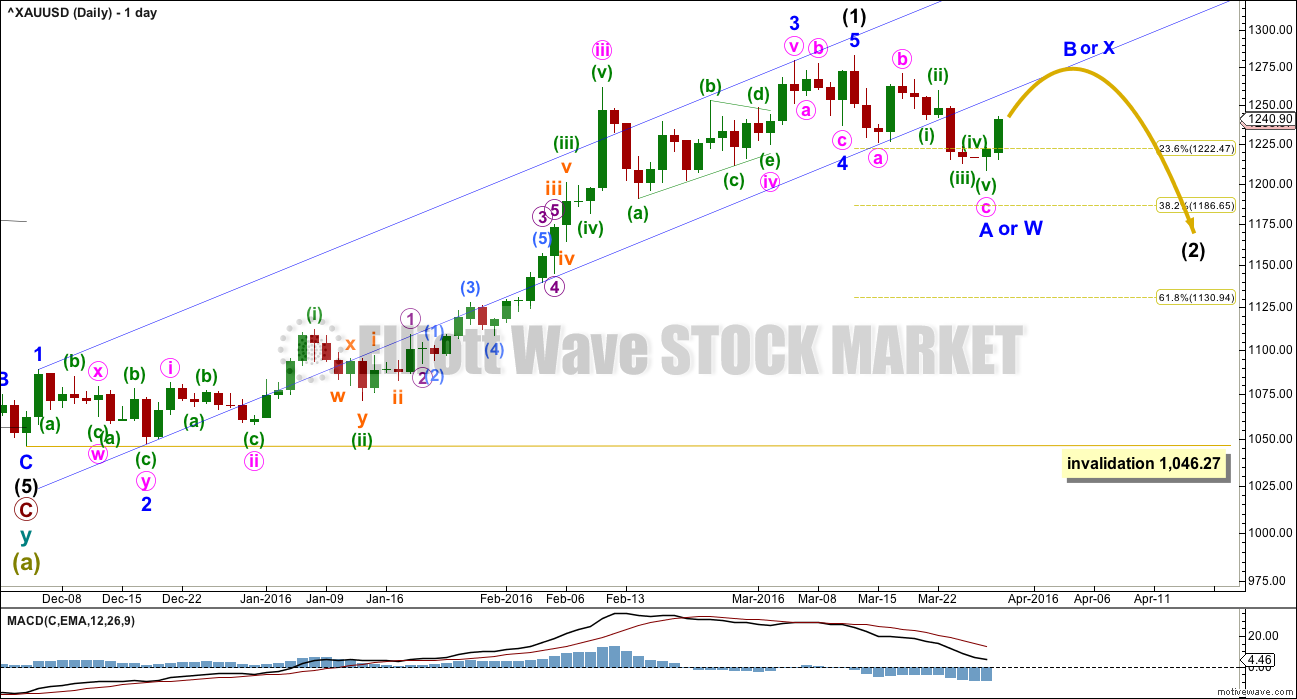
Intermediate wave (1) is a complete impulse. Intermediate wave (2) may have begun. COT supports this wave count; the majority of commercial traders are short (as of 22nd March). While this does not pinpoint when price should turn, it does support a larger downwards trend about here.
The first movement down within intermediate wave (2) subdivides as a three, not a five. This indicates intermediate wave (2) is not unfolding as the most common zigzag, so it may be unfolding as a flat, combination or double zigzag. The first three down may be minor wave A of a flat or minor wave W of a double combination or double zigzag.
If the correction up labelled minor wave B or X is shallow, then intermediate wave (2) would most likely be a double zigzag. Double zigzags have a slope against the prior trend; they are not sideways movements. A double zigzag may end close to the 0.618 Fibonacci ratio at 1,131.
If the correction up labelled minor wave B or X is deep and reaches to 1,275.24 or above, then intermediate wave (2) would most likely be a flat or combination. These are both sideways movements. A combination or flat may end closer to the 0.382 Fibonacci ratio at 1,187.
The channel about intermediate wave (1) is today drawn using Elliott’s technique. Upwards movement may find resistance at the lower edge.
This wave count expects the upwards movement to be a counter trend movement. The trend remains down at intermediate wave degree. Minor wave B or X would be likely to look like a three wave structure at the daily chart level.
HOURLY ELLIOTT WAVE COUNT
Click chart to enlarge.
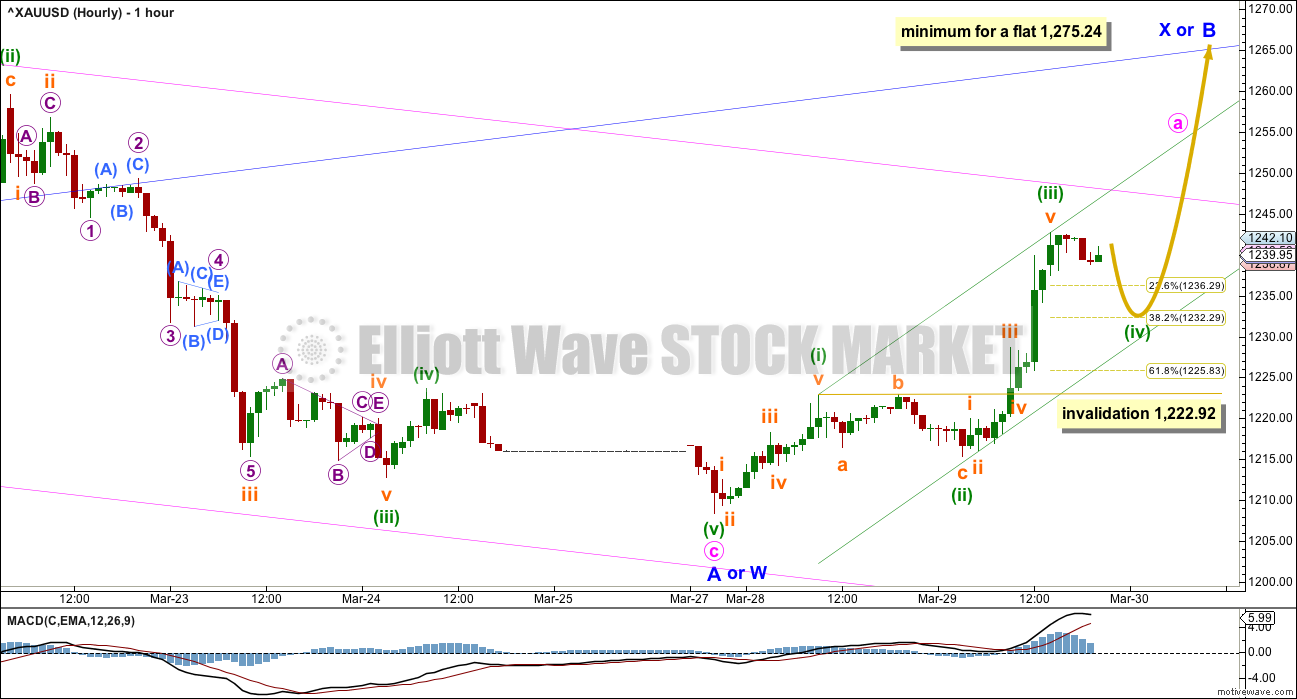
Minor wave A or W subdivides as a 5-3-5 zigzag. This structure is complete.
Minor wave B or X must subdivide as a corrective structure. This may be any one of 23 possible structures. The labelling will change as it unfolds. It is impossible for me to give you a road map for a B wave. They are the most difficult of all Elliott waves to analyse, and usually it is only clear what structure they take at the end. There is too much variety within B waves.
So far upwards movement looks like an unfolding impulse. This may be minuette waves (i) to (iv) for an impulse of minute wave a. Minuette wave (iv) may not move into minuette wave (i) price territory below 1,222.92.
If price remains above 1,222.92 and moves to new highs, then minute wave a could be complete. The invalidation point must move down to its start at 1,208.33. If minute wave a subdivides as a five, then the following correction for minute wave b may not move beyond its start.
If intermediate wave (2) is unfolding as a flat correction, then within it minor wave B must reach to 0.9 the length of minor wave A at 1,275.24 or above. Minor wave B may make a new high above the start of minor wave A at 1,282.68 as in an expanded flat.
If intermediate wave (2) is unfolding as a double combination, then there is no minimum requirement for minor wave X within it. It must only subdivide as a corrective structure. X waves within combinations are normally deep.
If intermediate wave (2) is unfolding as a double zigzag, then there is no minimum requirement for minor wave X within it; but minor wave X should not be deep, it should be shallow.
ALTERNATE DAILY ELLIOTT WAVE COUNT
Click chart to enlarge.
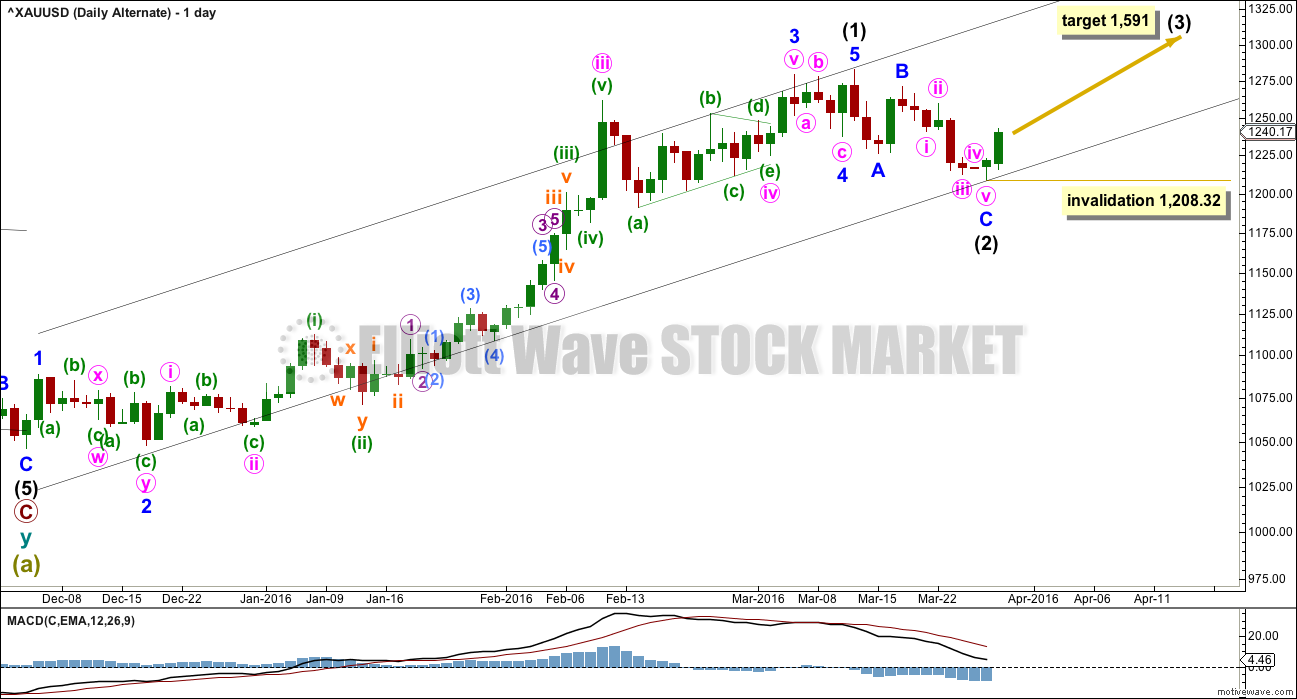
It is technically possible but highly unlikely that intermediate wave (2) is over. This wave count requires confirmation with a five up on the hourly chart for confidence. A new high is not confirmation of this wave count.
If intermediate wave (2) is over, then it is a very brief and shallow 0.31 zigzag lasting only eleven days (intermediate wave (1) lasted 69 days). The probability of this is very low.
At 1,591 intermediate wave (3) would reach 1.618 the length of intermediate wave (1).
Within intermediate wave (3), no second wave correction may move beyond its start below 1,208.32.
I do not want to give too much weight to this alternate by publishing an hourly chart. The subdivisions would be exactly the same as the main hourly chart.
TECHNICAL ANALYSIS
Click chart to enlarge. Chart courtesy of StockCharts.com.
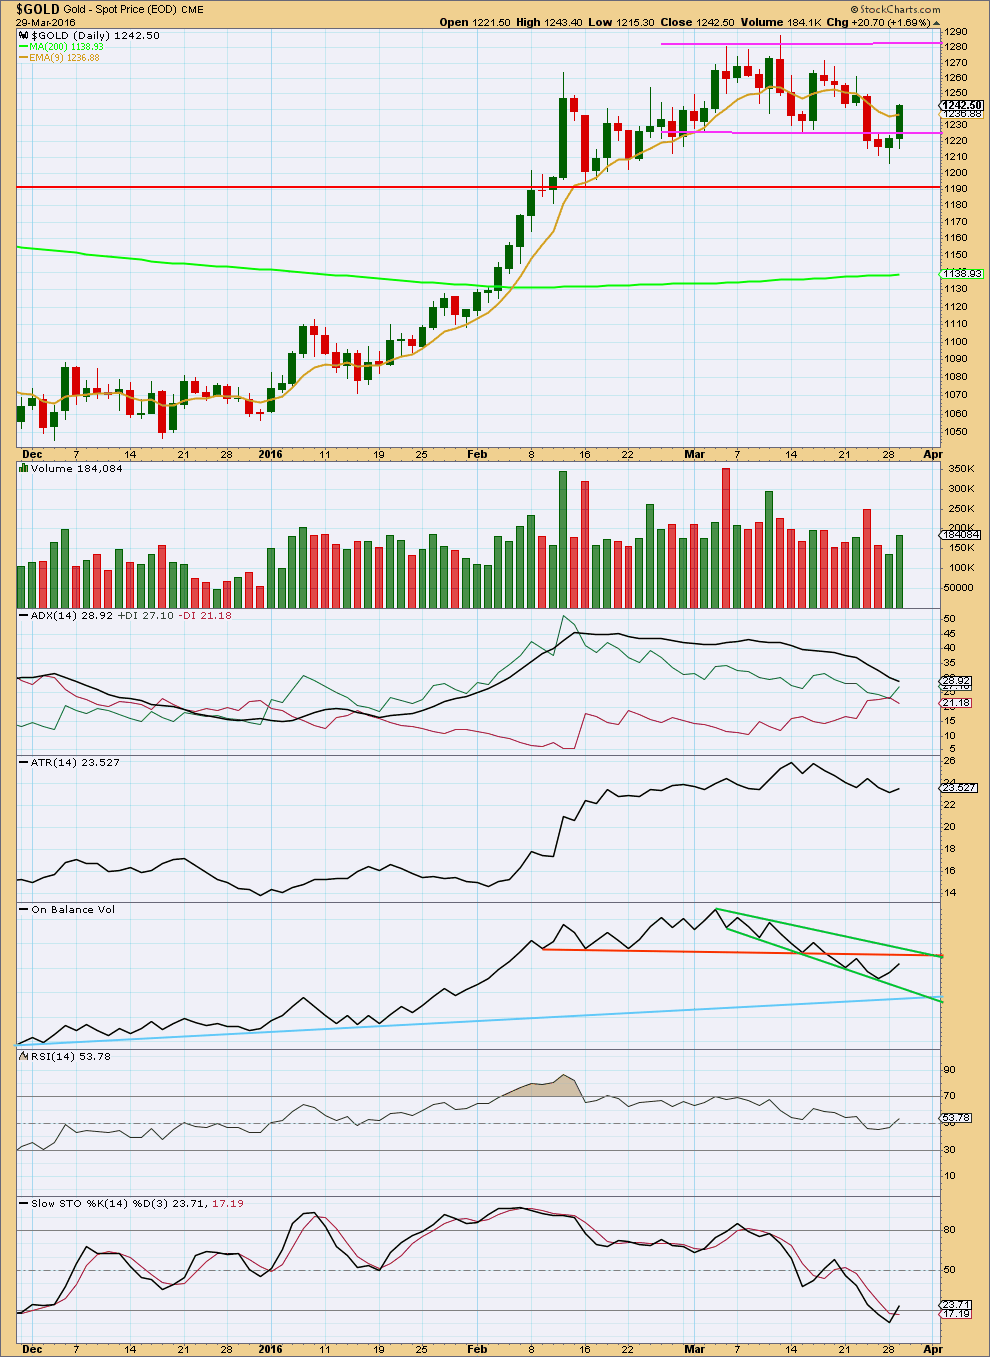
Upwards movement has some support from volume; volume increased over the prior upwards day. However, volume is still lighter than the strong downwards day of 23rd March, just a few days ago. This supports the main Elliott wave count, and also supports the idea of more upwards movement for the short term.
Price did not continue to find resistance at the lower edge of the prior consolidation zone. Price is back within that zone.
ADX is still declining indicating the market is not trending; it is consolidating. With price back within the zone of prior consolidation, it looks like the downwards breakout was false.
ATR is overall still flat, in agreement with ADX.
On Balance Volume remains bearish, supporting the main Elliott wave count. The break below the orange line was bearish and the test of that line by a throwback was further bearishness. OBV may find resistance again at the orange line. A break above that line would favour the alternate Elliott wave count. If that happens, the probability of that wave count would increase and it would be taken more seriously.
More upwards movement should be expected until price finds resistance and Stochastics reaches overbought at the same time.
RSI is close to neutral. There is plenty of room for price to rise or fall.
This analysis is published @ 09:48 p.m. EST.
This is how I see the last upwards wave.
The last high labelled minuette (v) is slightly higher than minuette (iii) (and it does not look like an obvious three, so it may be a five).
And so minute a can now be seen as a complete five wave impulse. Which means this downwards movement may be minute b.
Appreciate timely update.
Lara..
If main count gets invalidated…does the alternate become the main wave count or their is something else which is happening…
If we are in wave 3 of A than the correction will be much deeper…??..
Yaa i know untill main gets invalidated…this query dosent matter…but im curious about it..
The invalidation point has to be moved on the hourly chart down to the start of minute a.
There was a slight new high after a little downwards movement, that was minuette (iv) and (v).
Minute a is a complete impulse up.
This is minute b down. Invalidation point now 1,208.33.
Maybe wave A ( in five waves) is finished to today max and from there a downward zigzag is developping and it can finish with an other min. below 1223,17 …… near 61,8 % of wave A
Exactly.
Sorry ….I had not see that you had already answered
Gold 5 minute fired down at 11:05 am 15 minute at 11:15 am DUST 5 minute fired up at 11:10 am.
Gold at 11:36 is at 1223.32 very close to invalidation at 1222.92
Lara, my sincerest thanks to you for doing your best everyday making sense of gold so we have an idea of what may be going on and can venture to trade it. I’d pick you as my EW gold analyst everyday because I really couldn’t trade gold with anyone else. They may have a vague idea of what gold might do but don’t present it in enough detail for me to even consider trading it. Nobody’s perfect and I am far from that and I can’t expect anyone’s analysis to be perfect as it is impossible, especially forecasting gold. Your my favorite gold analyst in the world. The only one I would and do trade with. Thank you.
Thank you Richard
Fire the FED or else shut them up in between official meetings.
The world economy would be less confused and could make more progress.
Or just stop listening to them?
Works for me anyway.
Thank you lara..
Is it possible that the zigzag was not A..??
It was minor 4…??..
Than what target will be for minor 5..??
Possible but extremely unlikely.
It doesn’t look right. That movement is too far out of the Elliott channel (although it only breaches a best fit channel slightly), and would have inadequate alternation with the double zigzag of minor wave 2.
Ciao Lara,
one question….
you said ” That movement is too far out of the Elliott channel…..”, but if I draw the Elliott channel for minute degree, we should have the same problem….or not ?
Thanks in advance
An excellent point, you’re absolutely right.
I’ll give more consideration to the idea that the last low was minor 4. This could be minor 5 up.
After the next five up the price point which will differentiate this idea from my main wave count will be 1,243.69. If minor 5 up is unfolding then the fourth wave correction can’t move back down into first wave price territory which would have its high at 1,243.69
It doesn’t work.
Minor 4 doesn’t fit as either a combination or flat. If its a combination as labelled then minute y doesn’t subdivide as a zigzag very well, it fits best as a five wave impulse.
Also, if that’s a combination then it’s not a sideways movement, it has a slope against the prior trend.
I can’t relabel it A-B-C as a flat because B is < 0.9 X A. So I'm discarding the idea. The subdivisions don't work.