
Upwards movement was expected from last analysis, but this looks to be too weak to be a breakout.
Summary: One final short wave down to about 1,220 should complete a fourth wave triangle. The next move for Gold should be a short sharp thrust up and out of the triangle which is likely to be about $34 in length. The next likely length would be $55.
New updates to this analysis are in bold.
Last published weekly chart is here.
DAILY ELLIOTT WAVE COUNT
Click chart to enlarge.
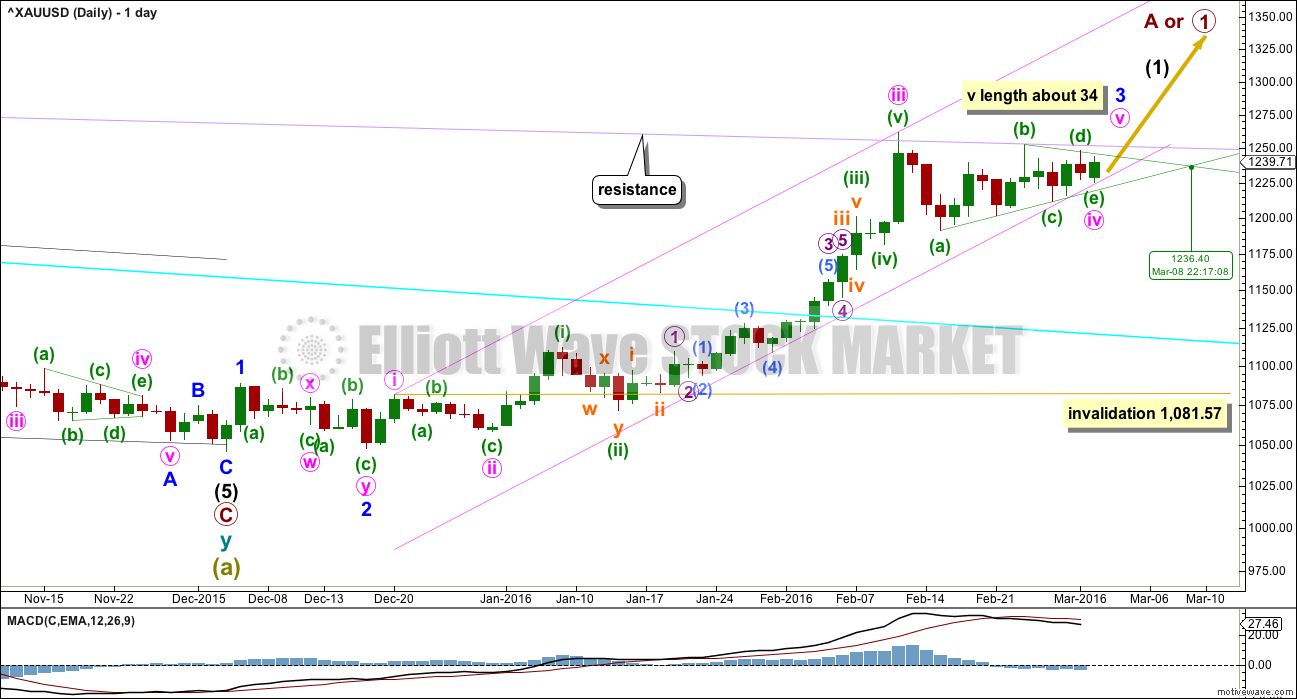
Gold has very likely changed from bear to bull.
So far, within the first five up, the middle of the third wave is now most likely complete. The strongest move may still be ahead. Gold typically exhibits swift strong fifth waves to end its third wave impulses. Look out for surprises to the upside for minute wave v and minor wave 5.
Minute waves i, ii and now iii are complete within minor wave 3.
The pink channel is a best fit. Draw the first trend line from the highs labeled minute waves i to iii then place a parallel copy lower to contain the whole upwards wave. Minute wave iv may find support at the lower pink line. If price touches that line, it should offer a low risk entry point to join the upwards trend.
The main hourly wave count now expects a triangle is very close to completion. Upwards movement is finding resistance at the lilac line and downwards movement is finding support at the (a)-(c) triangle trend line. To see how to draw the lilac line see the weekly chart here.
Gold often exhibits very short quick fifth waves after its fourth wave triangles. If this tendency is seen for minute wave v, then it would most likely be about $34 in length to be equal with minute wave i, a common ratio for a fifth wave. If upwards movement keeps going after that first length is reached, then the next likely length would be about $55 where minute wave v would be 1.618 the length of minute wave i.
Extend the triangle trend lines outwards. The point in time at which they intersect often sees a trend change, which would be 8th March. This does not always work, but it works often enough to be something to look out for.
If the alternate hourly wave count is correct, then the lower pink trend line may be breached. Sometimes fourth waves are not contained nicely within channels; sometimes they breach channels.
Minute wave iv may not move into minute wave i price territory below 1,081.57.
MAIN HOURLY WAVE COUNT
Click chart to enlarge.
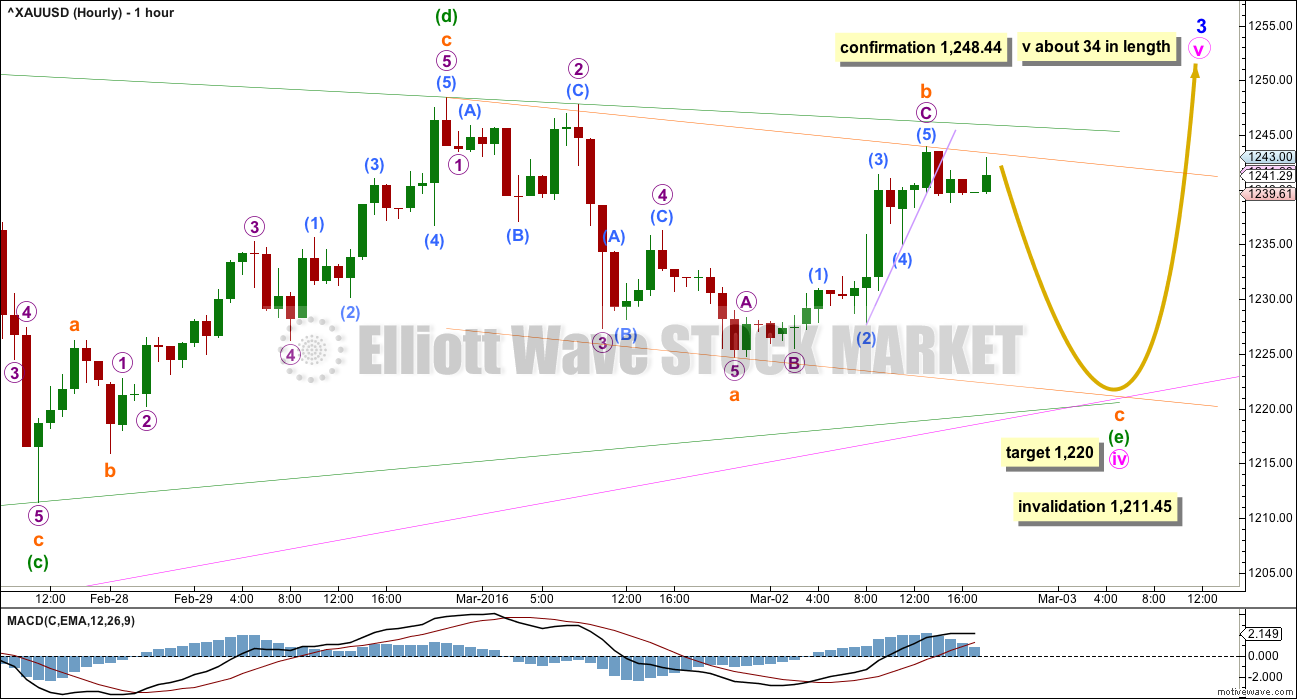
This main hourly wave count expects to see alternation in structure between the zigzag of minute wave ii and the triangle of minute wave iv. This is the main wave count mostly for this reason.
Only one of the triangle subwaves may be a more complicated double. Within this triangle, minuette wave (b) will only subdivide as a double zigzag, so all remaining subwaves of this triangle must be simple A-B-C structures.
Minuette wave (e) is continuing lower and sideways as a longer lasting zigzag. This triangle is incomplete; it has not managed to complete in a Fibonacci thirteen days.
Within minuette wave (e), subminuette wave a continued a little lower to complete a five wave impulse. Subminuette wave b upwards now fits as a complete zigzag.
Triangles normally fit neatly within their trend lines, which are often tested as the triangle unfolds. If my labelling of subminuette wave b as complete is wrong and if price moves higher, then expect it to find very strong resistance at the upper green (b)-(d) triangle trend line. If that trend line is breached and upwards movement shows an increase in momentum, then expect the triangle is over. That would be confirmed with a new high above 1,248.44. At that stage, minuette wave (e) could not be continuing higher because it may not move above the end of minuette wave (d).
At this stage, it looks most likely that subminuette wave b is a complete zigzag. At 1,220 submineutte wave c would reach equality in length with subminuette wave a.
The pink trend line from the daily chart may again be touched about that price point. That line should offer strong support.
Minuette wave (e) would most likely fall short of the green (a)-(c) triangle trend line. If it does not fall short, then the other less likely point for it to end is with an overshoot of that line.
Draw a small channel about the zigzag of minuette wave (e). Draw the first trend line from the start of subminuette wave a to the end of subminuette wave b, then place a parallel copy on the end of subminuette wave a. Price may find strong support at the lower edge of that orange channel.
Fifth waves out of Gold’s fourth wave triangles are often surprisingly short. I do not want to be surprised again by this tendency. The most likely length for minute wave v would be equality with minute wave i about $34. This would see minute wave v surprisingly short. If price keeps rising after a $34 length, then the next length would be $55.
When there is some upwards movement within minute wave v, then draw a trend line along the lower edge. When that trend line is clearly breached, if the length is about $34, then it may be over. Minute wave v may last only one or two days.
There is a competing tendency for Gold to exhibit long strong fifth waves to end its third wave impulses. Minute wave v may be a strong extension as it is a fifth wave to end a third wave impulse, but in this instance I think the tendency for it to be short and quick following a triangle is stronger.
ALTERNATE HOURLY WAVE COUNT
Click chart to enlarge.
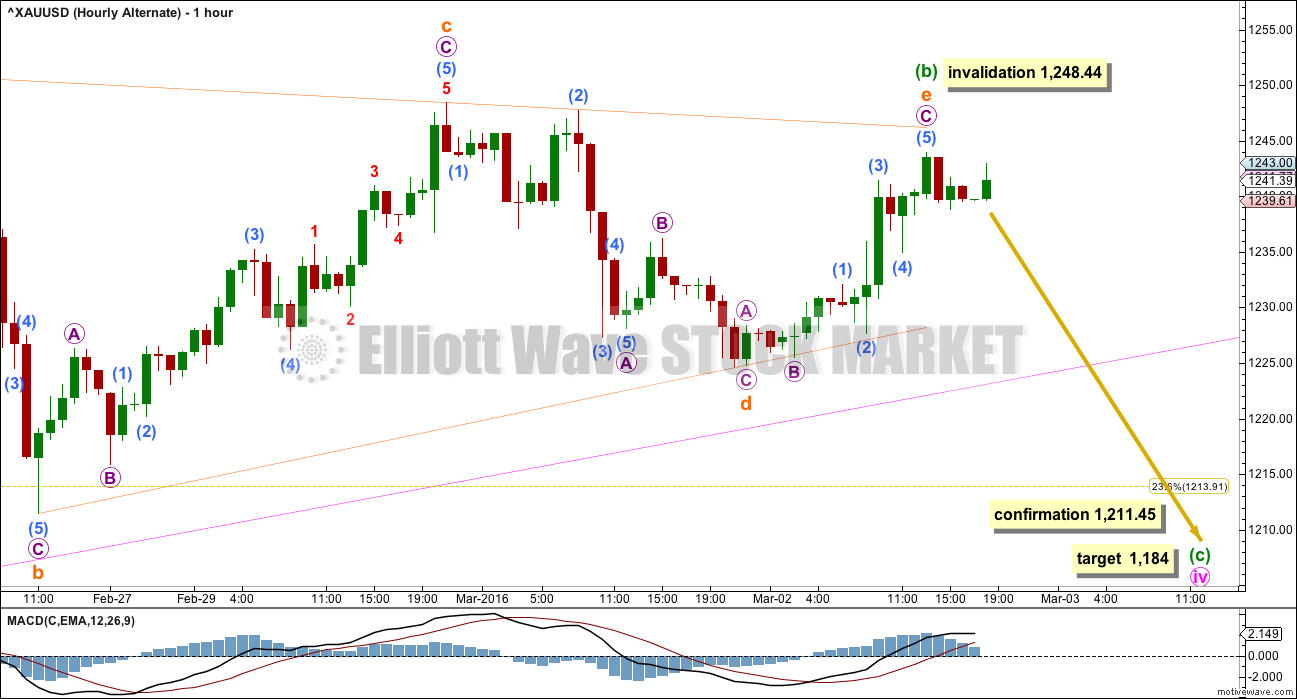
Minute wave iv may be continuing as a zigzag. This would offer no structural alternation with minute wave ii which was also a zigzag. For this reason, this must be an alternate wave count with a lower probability.
At this stage, if minute wave iv is continuing as a zigzag, then minuette wave (b) within it may be a triangle. This wave count no longer has the right look at the daily chart level. A single zigzag for minute wave iv should not have taken this long to unfold and it would be much longer in duration than the single zigzag for minute wave ii which lasted seven daily candlesticks. While a triangle could be expected to be longer lasting a zigzag should not be.
This wave count has a low probability, but alternates should always be considered for triangles. A new low below 1,211.45 would invalidate the main hourly wave count and confirm this alternate.
At that stage, minute wave iv may be expected to end about the 0.382 Fibonacci ratio at 1,184.
Within the triangle of minuette wave (b), the final wave for subminuette wave e may not move beyond the end of subminuette wave c above 1,248.44.
For this alternate, the triangle for minuette wave (b) would now be over with subminuette wave e falling just short of the a-c trend line. A short sharp downwards wave for minuette wave (c) would now be expected.
TECHNICAL ANALYSIS
Click chart to enlarge. Chart courtesy of StockCharts.com.
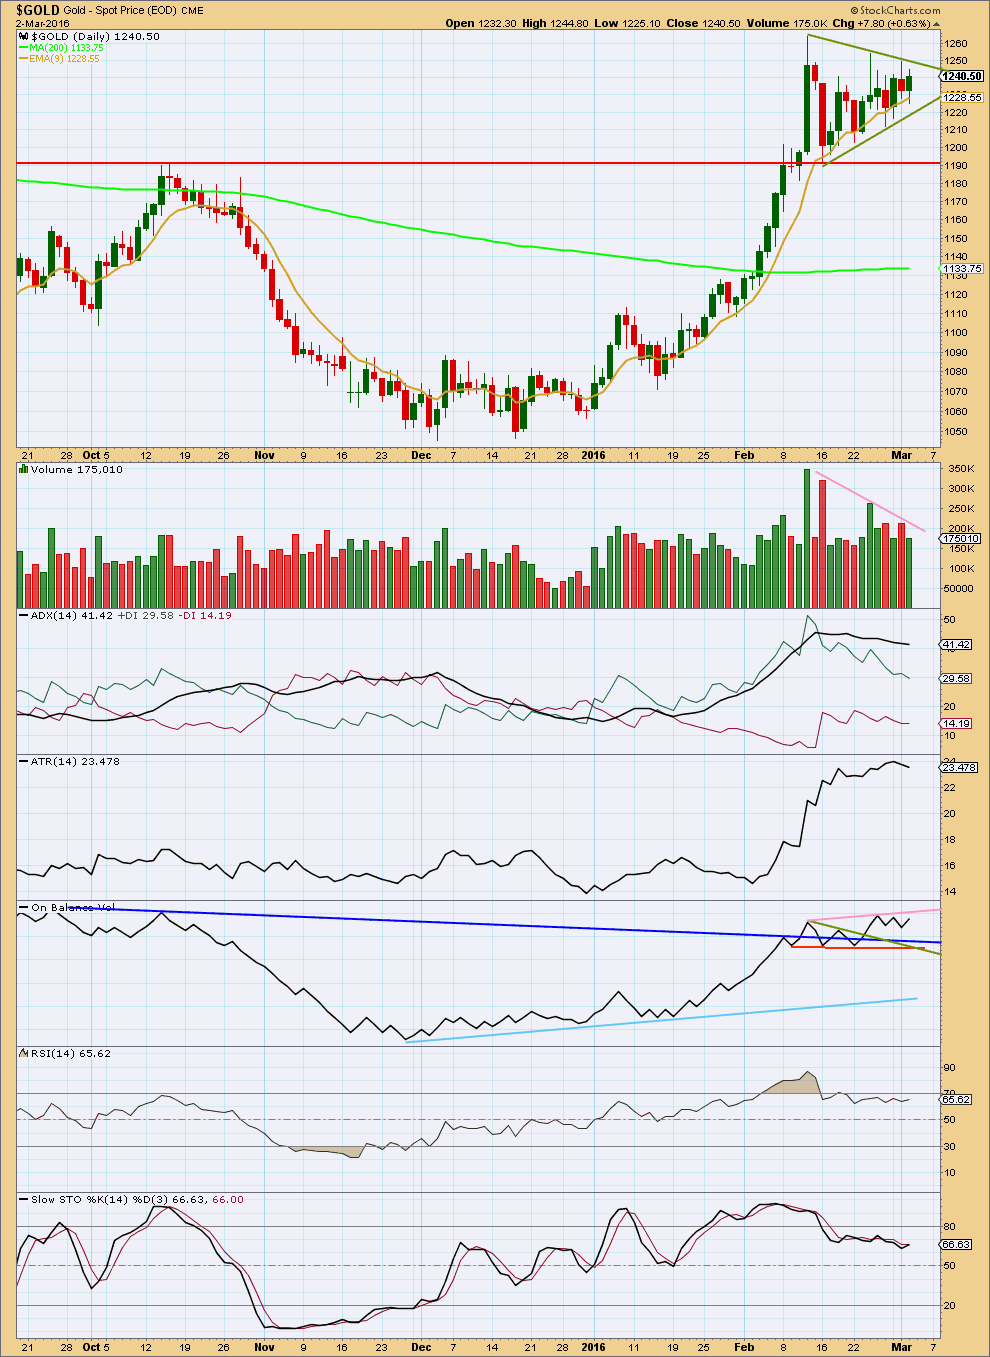
A triangle pattern looks to be forming. The trend lines are drawn across the top and bottom of the pattern. This is a fairly reliable continuation pattern. The breakout should be up. If price breaks above the upper green line on a day with an increase in volume, that would be a classic breakout from this pattern.
A decrease in volume now overall for the last few days again gives this consolidation a more typical look.
ADX is flat to declining indicating the market is correcting. ATR is now flattening off, so it now agrees with ADX.
Apart from the outlier of 16th February, highest volume is for an upwards day. The 16th of February may include data for the holiday session of 15th February for which there is no daily candlestick in StockCharts data. If this candlestick for 16th February is ignored, then the breakout direction indicated by volume should be upwards.
If the volume for the daily candlestick of 16th February is taken into account. then the breakout direction indicated by volume should be downwards.
On Balance Volume may be providing an early indication. It broke above the green and dark blue lines. This is a bullish signal; the direction of a break out of trend lines by OBV often predicts the direction price will break out of a consolidation. I have added a new trend line today to OBV in pink. A break above this line would be further bullish indication by OBV.
RSI has returned from overbought. There is plenty of room for this market to rise or fall. Stochastics has returned from overbought.
This analysis is published @ 07:06 p.m. EST.
I’m doing Gold early today, now.
I have to travel up to Russell in the Bay of Islands 🙂
Will update regular TA after my arrival.
It looks like a 5 wave up since March 1st low and US non farm payroll at 8:30 am EST Friday.
Job will be below consensus tomorrow. From the best macro guy out there. Gold will likely be up.
http://www.calculatedriskblog.com/2016/03/preview-employment-report-for-february.html?m=1st
The target is 1,279 where v = 1.618 X i, and v is above the end of iii avoiding a truncation.
The trend is up. This is a fifth wave. The structure is incomplete.
I’ll be calculating a higher target also.
If price keeps rising through the first target then we need to use a higher target.
I’ll use a trend channel / trend line to indicate when the upwards movement is over. At this stage price remains in the upper half of a channel, a third wave is ending.
Whether this is a third wave of the first, or a third wave of minute v is not something that I can tell yet.
Hello everyone, I would like to bring to your attention some opinions/analysis:
http://www.investing.com/analysis/gld-continues-to-add-gold-200120292
http://timeandcycles.blogspot.ro/2016/03/raj-time-and-cycle-review-and-forecast.html
I also believe if gold closes above 1250 today that is a bulish sign and perhaps this m5 has legs for a few more days/weeks and will target 1300-1340, so that the next m4 correction will have no problem targeting only prior support of the triangle that has now broken. It also seems to me that the indexes just finished or will finish their current upleg major or minor 2 or at least wave A of m2 and a good drop will take place during next days or weeks. If that happens, one would have a hard time imagining gold moving down together with sp500, don’t u agree? Also consider the fact this upleg today m5 and braking of the triangle took most by surprise, including myself… Ofc anything is possible. I am still long from 1249,5 with my stop moved at 1253 right now. What do you think? 🙂
I completely agree.
There are two competing tendencies for Gold for this fifth wave:
1. It’s a fifth wave out of a fourth wave triangle; they’re often surprisingly short. We have been surprised by this before.
2. It’s a fifth wave to end a third wave impulse; they’re often long and strong extensions which end on a spike.
To manage these competing tendencies I propose to have a series of targets. Then using a trend channel or trend line for support, when the line is breached to the downside then it should be over.
I am expecting the bounce on the S&P is either over now or extremely close to being over. As the S&P falls hard I would expect some rise from Gold.
Thank you, Lara. What do you think of this chart as per a roadmap? I think now that 1275-1285 is a good place for a top for this upleg mV of 3. It is interesting that I have 2 lines uniting major swing lows/highs over the past 2-3 weeks that intersect right around 1278. I am expecting 1266ish today for minuete 3 to end which is 1,618xmin.1… I have mIV starting at 1225.3 however as I am counting a very slight truncation there…. 🙂
This chart, forgot to upload it, btw I do trade live, it’s just that I am using MT4 demo version coz my broker has its own trading platform, but i still prefer MT4! :)))
Bingo! Watch price now, if it takes out 1268 and 1272(which is 1,618x(submin.i+iii), then this thing will extend! If not, I am calling min.3 ends here at 1268 today! Incoming min.4 of 38% and then minuete 5 final up tomorrow… I am out today at 1266 with a very nice chunk of profit! Will reenter today overnight only lower at 1256-1257 or at 1273 with a stop and a target of 1282-if min.3 extends but I highly doubt it at this point coz it just spiked! 🙂
I think that’s an excellent roadmap. Trend lines, support and resistance.. usually reliable.
Thank you, Lara 🙂 I have another question non-gold related, whenever you find the time to answer. Do you still view the NZD/USD in the same wave count as in price being stuck perhaps in a major 4 tracing a triangle ABCDE currently being in E up? I ask coz i took a small short and my stop is 0.69. Keep or abandon? My loss is neglijable right now if i close it… 🙂
The breakout today was not fiery…this was not expected..today was a 2nd day of wave 5…expect it to end soon…lack of momentum is seen…this breakout was not in style
I’m looking for Lara to clarify the count.
One would expect minute wave v to end above the minute wave iii high of 1,263.43 on February 11th or there would be a truncation.
Perhaps gold still has another $20 to go up to end minute v.
“If upwards movement keeps going after that first length ($34) is reached, then the next likely length would be about $55 where minute wave v would be 1.618 the length of minute wave i.”
I can see 5 wave impulse in this run…minutte 5 may be over…i may be wrong..i dont know which tool to use to chart it and show…
I’d say taking some profits today is a wise decision.
Especially if you are sitting on a lot of miners.
This run may have ended or tomorrow or next week, however a larger correction minor 4 down is expected very soon and miner prices may be a lot lower, although no new lows are expected.
I have an investing advice over the years.
In investing, greedy pigs may get slaughtered.
Holding too long may see the profits gone.
No one knows for sure when and where the peak is.
Gold had an amazing February.
March may be the opposite?
‘ BULLS MAKE MONEY.Bears make money,but PIGS ,never do!”However I am still a bull as I believe the SPX is topping here and gold is doing the inverse of the SPX and has more to rise to maybe 1281? ,before a correction, then,1339. Next correction target I leave in Lara,s good hands.
The triangle breakout up happened at 10:01 am when this news release came out.
10:01am ISM nonmanufacturing index falls to 53.4% in February
10:01am Factory orders rise 1.6% in January
10:05am US service sector activity eases slightly, ISM says
10:06am Gold extends gains to $1,250/oz after ISM report
Just an alternative thought….
If this breakout stays below the February high, perhaps it is a very deep double zigzag to form a massive 2nd wave. If so, the coming move down could be extremely swift and strong. Naturally, if the February high does not hold this idea would be invalid.
Aside from the fact that this 2nd wave is so very deep (96%), there is also a possible issue with the b wave of the 2nd zigzag looking like a 5 count. Not sure if it can fit as a 3.
What price is the beginning of minute wave v so we can count either $34 or $55?
I think it is 1,224.76 at 9:50 pm March 1st
plus $34 is 1,259
plus $55 is 1,280
wave v start from 1224,67 ( on my platform )…..and if minute wave v will be only 34 dollar in length, it will be truncated…..
Another thing….the triangle trend lines will cross in 6/7 days, so minute wave v may last only one or two or six/seven day….
Due to the breakout of the triangle today I would forget about the triangle ending March 8th or 7 days as it already ended and perhaps minute v up already ended or ends today or Friday.
I have no miners now as I sold yesterday and was waiting to buy lower today.
If I had a lot of miners, I’d be at least selling some of them before the close today as minute v and minor 3 may have just ended or will end today or Friday and Friday there is US non-farm payroll news release at 8:30 am EST.
Minor 4 may start today or Friday and gold may correct down a week or 3 weeks? Holding miners now is a chance to take profits now that may be lost today or overnight.
GDX is at 19.75 high right now and gold direction is in question. Maybe another $20 up or maybe gold has started down at the high today of 1,257.21 at 10:25 am EST.
the point where triangle trend lines cross not determine the end of the triangle, but the time end of minute wave v……..so it is possible that this minute v will end in 6/7 days……but this is not a rule…..
I prefer to count 5 waves on the hourly from 1224,67 before exit from the long…. at the moment I count waves 1 and 2 within minute v ended with wave 3 within minute v in developping…..so my stop is at the top of wave 1 within minute v ( 1243,00 )
Alessandro,
So you are saying the triangle intersect lines is not the breakout up but the trend change of minute wave v / minor wave 3 ending up and gold starting going down in minor wave 4.
“Extend the triangle trend lines outwards. The point in time at which they intersect often sees a trend change, which would be 8th March. This does not always work, but it works often enough to be something to look out for.”
Yesterday’s summary had this comment,
“If the target at 1,261 is reached and the structure is incomplete, then more upwards movement should be expected. If price keeps rising through the target at 1,261, then the next target is at 1,316 where minute wave v would reach 1.618 the length of minute wave i.”
Maybe we may get more clarity before the close.
the triangle trend lines are a point in time at which a trend change may occur
the end of one wave and the beginning of the next wave
but the method does not say / cannot say which wave
sometimes it is the end of the wave which broke out of the triangle, sometimes it is a correction within a wave…
it could be the end of minute v and so the end of minor 3 and the start of minor 4
it could be the end of minute a within minor 4
or it could be the end of minute b within minor 4
At 10:01 am EST Gold went above 1,248.44 up to 1,250.70 and confirmed the main hourly and invalidated the hourly alternate wave count. The triangle and is over and gold has broken out to the upside. Minuette wave (e) and minute wave iv are over. Minute wave v upwards has already begun.
The most likely length for minute wave v would be about $34. This would see minute wave v surprisingly short. If price keeps rising after a $34 length, then the next length would be $55. When there is some upwards movement within minute wave v, then draw a trend line along the lower edge. When that trend line is clearly breached, if the length is about $34, then it may be over. Minute wave v may last only one or two days.
“upper green (b)-(d) triangle trend line. If that trend line is breached and upwards movement shows an increase in momentum, then expect the triangle is over. That would be confirmed with a new high above 1,248.44.”
The up movement from 1227 seems in 5 wave on the hourly…..maybe it can be the first wave of minute v…….what you think about it ?
You were very right.
Lara is on right track as far as market is concerned with excellent EW analysis.
Noise??
http://goldtadise.com/?p=364242#comments
Investment leveraged to POG in junior miners. many juniors are up by 200 to 300 % in last month.
———————————————
In the early phase of the return to the gold bull market, whilst the gold price breaks above the falling 200 and 300 day moving averages (MA’s) and overcomes various inherited resistance levels around US$ 1,250 and 1,350 / ounce gold prices, it is wise to build portfolios in companies that have the following main characteristics:
Low debt exposure especially substantial longer term liabilities;
Carry a good cash balance of greater than C$ or A$ 20 million;
Have operating cash costs of between US$ 450 – 650 / ounce;
All in Sustaining Costs (AISC) per ounce of gold produced of between US$ 800 – 950 / ounce;
Gold reserves of > 8 years of current production;
Are valued at little more than the companies “Enterprise Value” and sometimes less than this. This is a clear buy signal in the emergent gold bull market;
Are leveraged to the US$ gold price and may have been seriously undervalued like RSG in Australia which operates its largest producing assets in West Africa;
Do not invest in gold producers operating in counties offering increasing Sovereign and business risks such as Turkey, Greece and China for example; and,
Have strong Board of Management with track records of success in the gold mining industry.
……. Of the Australian mid cap producers, there are two plays which are quite different. The 1stTier Mid – Caps which includes Northern Star Resources Ltd (ASX: NST), Evolution Mining Limited (ASX: EVN) and Oceana Gold Corporation Limited (ASX and TSX: OGC), have all recently advanced strongly and now represent safe investments to trade on the “dips” and sell on the “highs” or merely hold longer term. However, their upside profit potential as they are now already at an elevated level is in the order of 150 – 300% depending on how high gold goes in the coming resumption of its bull market. However, amongst this group, OGC could really appreciate given its low cost production profile and the eventual bringing on stream of the large, low cost, open pit Haile gold project in South Carolina, USA, which will bring OGC’s annual production up to > 500,000 ounces per annum and make it one of the lowest cost mid – cap gold producers in the world.
The real upside in the Australian mid-cap gold producers will come in those companies that have been largely ignored by the market for several reasons as follows:………
http://www.clivemaund.com/article.php?art_id=3735
Noteworthy bullish call
http://kingworldnews.com/alert-legendary-analyst-louise-yamada-just-turned-bullish-on-gold/