
One final wave down was expected to finish the correction, but this did not happen.
A new high above 1,248.44 confirmed the correction was over and price was breaking out upwards.
Summary: The target is at 1,280 in the first instance. Thereafter, if price keeps rising, the next target is at 1,350.
New updates to this analysis are in bold.
Last published weekly chart is here.
DAILY ELLIOTT WAVE COUNT
Click chart to enlarge.
Gold has very likely changed from bear to bull.
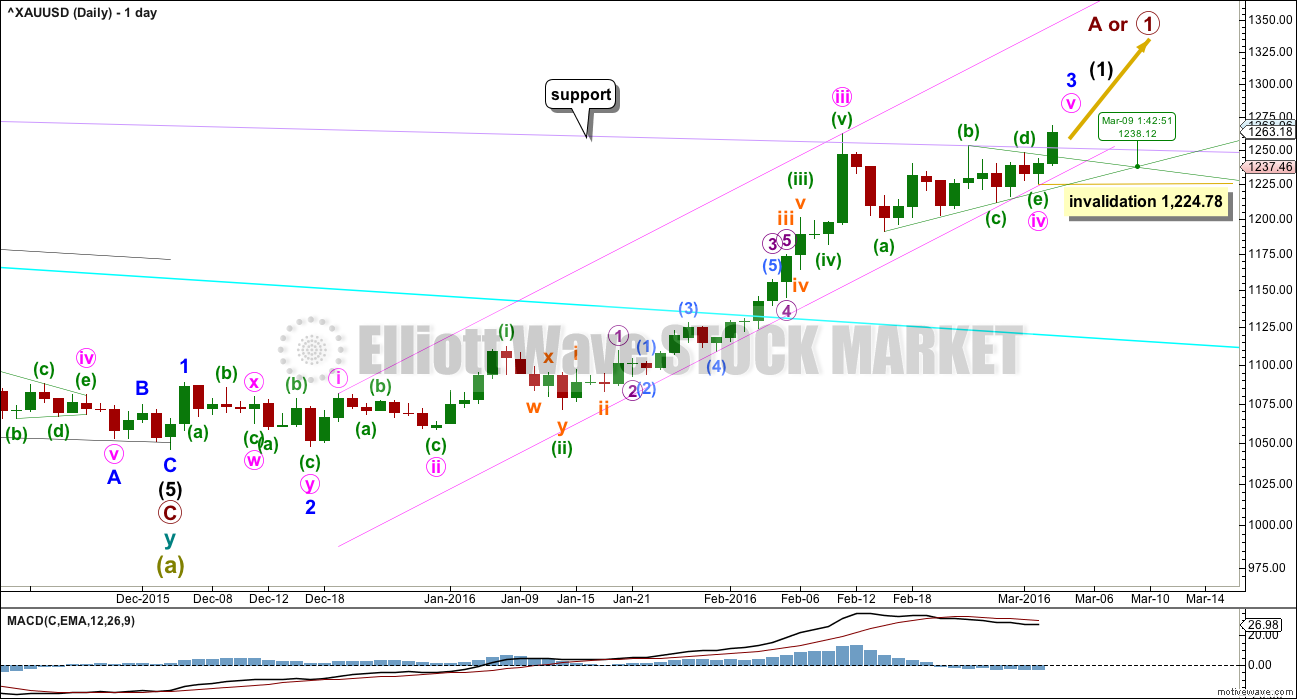
So far, within the first five up, the middle of the third wave is now most likely complete. The strongest move may still be ahead. Gold typically exhibits swift strong fifth waves to end its third wave impulses. Look out for surprises to the upside for minute wave v and minor wave 5.
Minute waves i, ii and now iii are complete within minor wave 3.
The pink channel is a best fit. Draw the first trend line from the highs labeled minute waves i to iii then place a parallel copy lower to contain the whole upwards wave. Minute wave iv may find support at the lower pink line. If price touches that line, it should offer a low risk entry point to join the upwards trend. Price touched that line three times in the last week.
A triangle is complete for minute wave iv. Minute wave v of minor wave 3 is underway and the structure is incomplete.
There are two competing tendencies for this fifth wave. It is a fifth wave to follow a fourth wave triangle and the fifth wave can be surprisingly short. It is also a fifth wave to end a third wave impulse, and the fifth wave can be long strong extensions. Multiple targets should be used to allow for both tendencies. A channel may be used to confirm when it is over, but structure at the hourly chart level will also be important.
Now that price has broken above the lilac trend line, if price turns down, it should find support there. A typical throwback to that line would offer a low risk entry opportunity to join the trend.
Extend the triangle trend lines outwards. The point in time at which they intersect often sees a trend change, which would be 9th March. This does not always work, but it works often enough to be something to look out for. This does not have to be the end of minor wave 3 (although it may be). It could be the end of minute wave a within minor wave 4, or the end of a smaller correction within minor wave 3.
Within minute wave v, no second wave correction may move beyond its start below 1,224.78.
MAIN HOURLY WAVE COUNT
Click chart to enlarge.
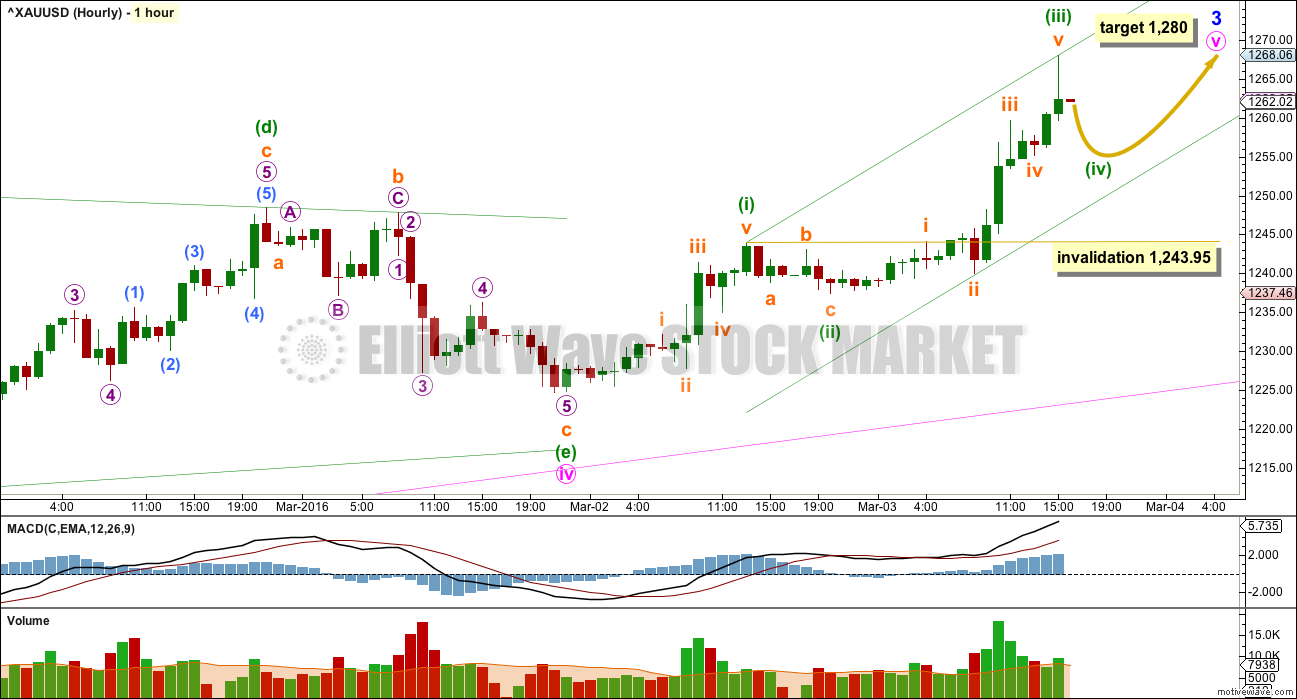
The triangle for minute wave iv is complete. The final wave down of minuette wave (e) looks like a five, not a three.
So far within minute wave v the structure is incomplete. Minuette wave (iii) is just 0.42 short of 1.618 the length of minuette wave (i). Minuette wave (iii) shows stronger momentum than minuette wave (i).
I have noticed that volume spikes on the hourly chart in the middle of third waves, which fits the personality of third waves neatly. Volume declines at fifth waves. The volume profile at the hourly chart level fits this wave count perfectly.
Minuette wave (iv) may not move into minuette wave (i) price territory below 1,243.95.
The green channel is a best fit. Minuette wave (iv) may not move low enough to find support at the lower edge. It may end within the price territory of the fourth wave of one lesser degree, between 1,259.66 to 1,253.53.
When minuette wave (iv) is complete, then minuette wave (v) upwards should make a new high above minuette wave (iii) at 1,268.06 to avoid a truncation. Minuette wave (v) is most likely to exhibit equality in length with minuette wave (i), so to be $19 in length. This may see it end close to the target calculated at minor degree. At 1,280 minor wave v would reach 1.618 the length of minute wave i.
This five wave impulse upwards may be minute wave v in its entirety. That would see minute wave v surprisingly short.
When minute wave v may be complete, then this main wave count expects the next movement down to begin minor wave 4 to subdivide as a five wave structure on the hourly chart, as a movement at minor degree should.
ALTERNATE HOURLY WAVE COUNT
Click chart to enlarge.
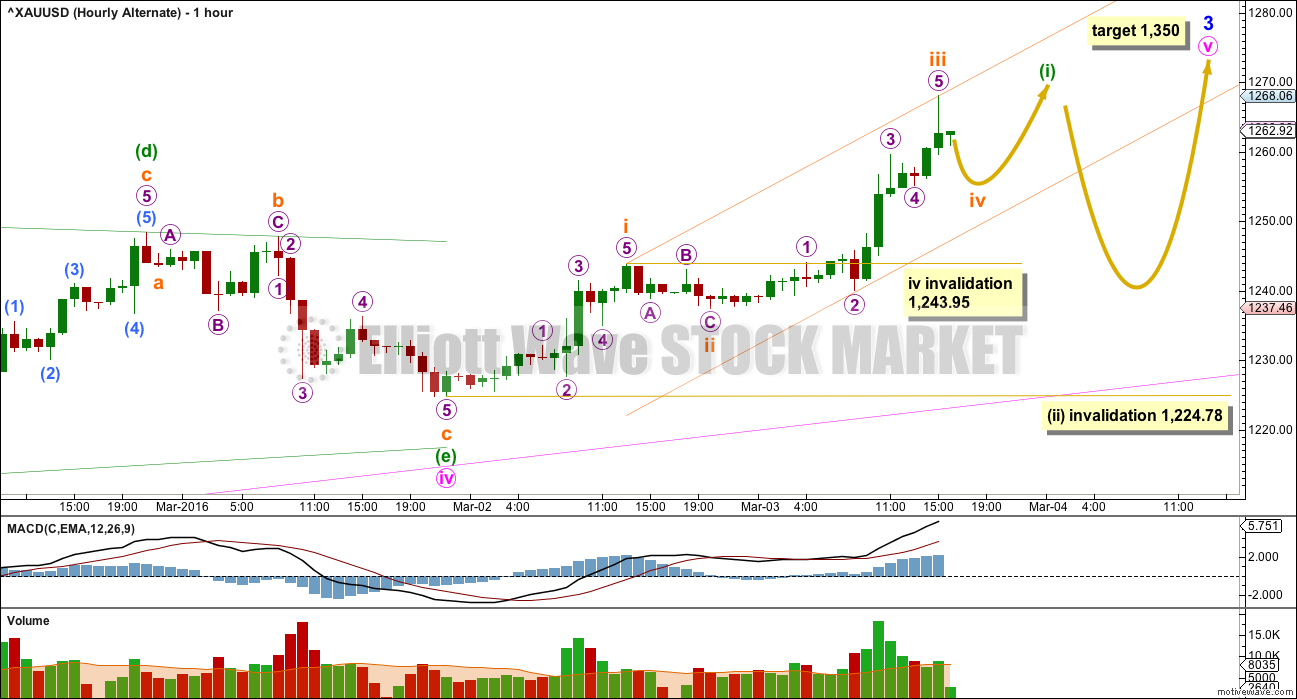
By simply moving the degree of labelling within minute wave v all down one degree, this five wave impulse up may be only a first wave impulse within a longer extended fifth wave for minute wave v.
In the short term, the structure is the same and a target about 1,280 for subminuette wave v to end minuette wave (i) would be reasonable.
Thereafter, the structure and depth of downwards movement will determine if minute wave v is over as a surprisingly short fifth wave, or if it is going to continue as a longer extension.
When minuette wave (i) is a complete impulse, then the next wave down for this alternate wave count would be expected to subdivide as a three wave structure. Minuette wave (ii) may not move beyond the start of minuette wave (i) below 1,224.78. If price remains above 1,224.78 and downwards movement subdivides as a three and not a five, then this alternate would be correct. Minute wave v would be extending.
At 1,350 minute wave v would reach 0.618 the length of minute wave iii.
TECHNICAL ANALYSIS
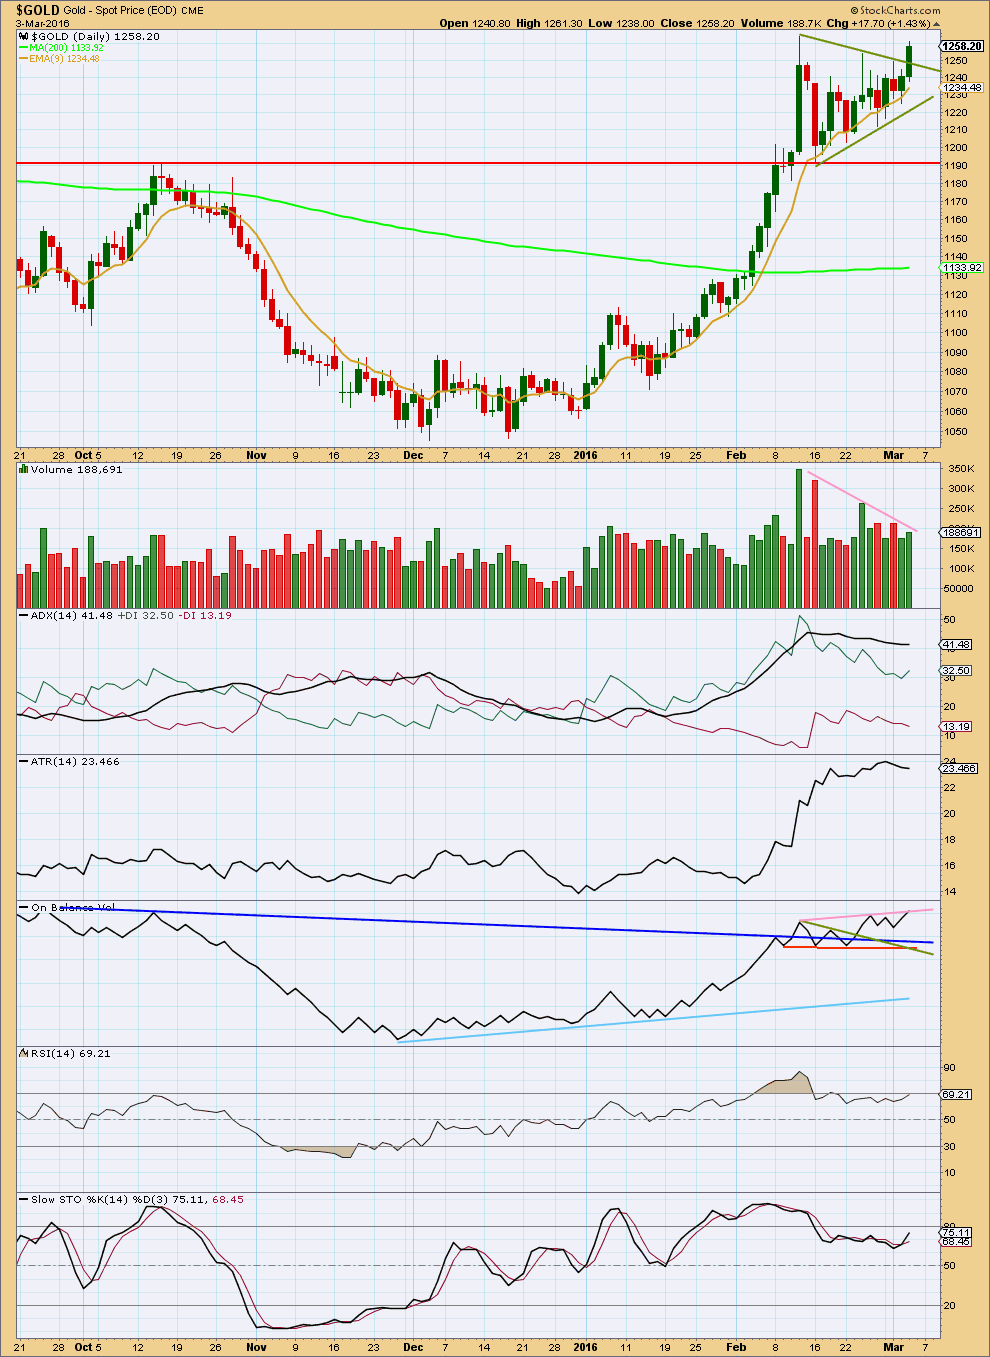
Click chart to enlarge. Chart courtesy of StockCharts.com.
Price has broken above the upper triangle trend line, but volume shows only a slight increase. One more upwards day with stronger volume would be required for confirmation of this classic technical analysis breakout. Until that happens, the breakout may be false.
Overall, volume is still declining as price moved sideways.
ADX is still flat today indicating the market is still consolidating. It is a lagging indicator based on a 14 day average. ATR is today declining, so it agrees.
On Balance Volume has come up to touch its short pink trend line. A break above that line would be a fairly bullish indicator. That may precede a breakout of price in the same direction.
Stochastics is not overbought, so there is still room for price to rise. RSI is not overbought either.
This analysis is published @ 05:27 p.m. EST.
Thank You Lara. First double of 2016 🙂
You’re welcome 🙂
I am shorting. shorted at 1268.2 . I believe the SPX will continue on up to fill the gap at 2044 . Therefore gold will fall until then. IMHO
This is what i wrote couple hours ago…. Hmmm I was short abit today, recovered half the loss from early longs, let’s see if my target of 1257 actually holds, there was a spike into it and boost back up…. 🙂 I think now we go up, i am long with stop 1254 but we need brake red channel down for confirmation 1st …. unless this another w4
DORIAN-CATALIN
March 4, 2016 at 1:22 pm
Yes, well she sees the waves better then me, I am not very confident always in my eyes. 🙂 I do trade for a living however for past 5 years with success although had some very bad experiences at 1st. I also agree with you, I think we get a extension of wave 3 just wait abit, I wanted go short in fact then I changed my mind, I am waiting to see now what goes 1st: 1272(red chanel breaks-false breakout i expect) or 1263 we go more down abit to end C of 2 perhaps towards 1255-1257 and if that holds, then thats it we go up again? :)…… Also note that hourly Macd, Rsi and STS all display some negative divergencies….
Downwards movement is finding support at the lilac line on the daily chart. While that line holds it offers a nice entry point; price should bounce up from there. If the line is breached then something else is happening (a second wave correction for hourly alt? or the start of minor wave 4 for hourly?) so stops just below the line offer a low risk set up
This comment assumes that any correction will be shallow. This would fit the alternate better, the idea that minute v will extend, that price will keep on going up from here.
Hi Lara, what about this count? I just cannot see a 5 wave advance but a 3wave for what you have 5 of m3…. Are there 5 waves and I just dont see them lol? And is it really possible that such and expanded flat takes place with braking the channel support lines? Never seen anything like that for a wave 4 of such amplitude…. Thank you! 🙂
You can see them in my chart I posted.
I don’t know what M3 is?
I cannot make sense of your wave count. It does not have some labels; at the end of the waves you have only the highest degree, not the lower degrees showing how they’re nested. That really helps for clarity.
shall I assume that m3 means minor 3?
Yes ofc my yellow m3 means your minor blue 3. Sorry for the confusion. Could not fit more into chart as it was a zoom on thw 5min.
You can also check my charts i posted earlier today, they are zoomed more to get the whole picture. I was considering the end of minor 3 at 1274 and the rest is a ongoing correction running flat if it already ended today at 1256 or an expanded flat if it breaks lower monday. This correction i think which started at 1274 is part of an extending 2 down of minor 3 or the start of minor 4 down…. 1256 was an intersection cross of the green up and red down channels. Price took a spike right into it and completely rejected it up afterwards. I kbow coz i was trading it and closed shorts in 1257 and imediatly got a veery small long to hold on weekend. I find that cross very interesting… And therefore my theory of this ABC 🙂
Good morning 🙂 Will put a quick chart up here before I scroll lower and answer questions.
I can now see a complete five up. What looked like a complete three last night for subminuette iv was just wave A, it continued as an expanded flat. This gives perfect alternation with subminuette wave ii zigzag.
This is the alternate hourly. And I am thinking that I should have labelled them “1” and “2” rather than main and alternate. They have an even probability.
Hey guys…
I think this is a powerful extended 5th wave…
Im again going long…yes im over confident on this wave…i may be wrong but what i can see is the wave down at the time of NonFarm was minutte 2 correction…now this move may be that we are in the comletion of subminutte wave 2 of minutte wave 3…
Im going long…its risky but im confident…
Be cautious, I cannot see 5 waves up at what i marked a possible wave B up that took out the previous top marked minor 3 or 1 of 3. So I think the correction for 2 of 3 up is not over yet, no ideea where it can end but possible support are fibonacci areas or the green and red support channel down… inclining to think will be a running flat and not expanding… then we should start 3 of 3 only… if that is what it is hopefully, and not some weird twisted minor 4 down
For that clearance we have to wait for laras comment…super girl has all the answerss .. 🙂
Yes, well she sees the waves better then me, I am not very confident always in my eyes. 🙂 I do trade for a living however for past 5 years with success although had some very bad experiences at 1st. I also agree with you, I think we get a extension of wave 3 just wait abit, I wanted go short in fact then I changed my mind, I am waiting to see now what goes 1st: 1272(red chanel breaks-false breakout i expect) or 1263 we go more down abit to end C of 2 perhaps towards 1255-1257 and if that holds, then thats it we go up again? :)…… Also note that hourly Macd, Rsi and STS all display some negative divergencies….
Ok I think we are now either in C down of II for 3 up, or already in 1 of 3 up- although less likely coz B up has a abc 3 wave look…. Here is the chart…. another extension of minor 3 indeed 🙂 However, invalidation point is down at 1224-1225 so waiting is adviced now lol (not that I think it will get back there but you never know). Target can be around 1350 next week or so. Myself, I am waiting for a confirmation around 1285 now(1280-1284 can be false breakout and there’s a trend line uniting highs) or a continuation of this correction down and hopefully pick some longs on the way down. If we still in correction wave 2 then it’s a running flat or expanded…. I advice just light trading today, market is very tricky! There is 1 more option: we do a running or expanding flat ABC and if when that finishes, market does not make new highs, that could mark wave A of a continuing larger correction triangle again or whatever for minor wave 4 down of interm. 1 or A…. That would be something myself I would not like yet. In other words, market can go either up or down now 50-50:)))) So… awaiting Lara’s analysis ! 🙂
Something is not right…USD, Gold, market, oil all moving in the same direction over last week. Something has to give. Gdx and its underlying etfs are moving unnaturally and have been at technical extremes for the longest period in its history! When the market crashes does gold and oil go with it? Miners have to correct soon and will probably follow the market. It’s a weird and dangerous time…be careful. Opinions?
New gold Bull markets don’t use the same overbought indicator strategy as bear market. New bull market can go much more overbought and longer.
Also Lara Thursday analysis said, “Stochastics is not overbought, so there is still room for price to rise. RSI is not overbought either.”
1280 is the target for both main and alternate hourly.
Now we just watch if gold drops from 1279.91 high at 9:56 am EST in a 5 wave it is the main hourly minor four and if in a 3 wave it is the alternate hourly minuette wave (ii) and only the alternate has the lower invalidation and it is 1224.78.
What Richard said, with 1 exception: the target for the alternate is 1350+! 🙂
Not talking about gold. Equities don’t act in these extremes for this long!
You were talking about gold and GDX and miners in your comment.
Richard, Gdx and miners are equities! Please reread my statement on technical extremes. My point is were at a juncture for a correction and something has to give. These correlations will not hold.
People have been saying for a few weeks that gold and the miners were overbought and needed a correction. We have had some minor corrections. But many investors are still not believing gold and the miners could not go up anymore and they did go up anyways. If gold goes up miners go up. Miners are linked to gold so they don’t collapse down if gold keeps going up. Generally Gold is the King and it rules and miners follow.
What technicals specifically Joseph?
AFAIK in a bull market they can be extreme for reasonable periods of time. Even RSI.
However, if there are several of different varieties all extremely extreme… then this may portend a trend change. It still won’t tell us exactly when the change will come though
I’d be looking for divergence with price and any indicator or oscillator to indicate an end to this movement.
Miners have been at technical extremes because gold just finished a 4 1/2 year bear and only been in a new gold bull only since mid January. Now gold has a drop. Lets see if it drops in a 3 or 5 wave. Let price tell us how much and if below 1,224.78 that will clarify if gold minor wave 3 ended at 1,280 or is going for a longer extension and may end at 1,350.
So do we have the alternate count confirmed or not?
“By simply moving the degree of labelling within minute wave v all down one degree, this five wave impulse up may be only a first wave impulse within a longer extended fifth wave for minute wave v.
In the short term, the structure is the same and a target about 1,280 for subminuette wave v to end minuette wave (i) would be reasonable.
Thereafter, the structure and depth of downwards movement will determine if minute wave v is over as a surprisingly short fifth wave, or if it is going to continue as a longer extension.
When minuette wave (i) is a complete impulse, then the next wave down for this alternate wave count would be expected to subdivide as a three wave structure. Minuette wave (ii) may not move beyond the start of minuette wave (i) below 1,224.78. If price remains above 1,224.78 and downwards movement subdivides as a three and not a five, then this alternate would be correct. Minute wave v would be extending.
At 1,350 minute wave v would reach 0.618 the length of minute wave iii.”
No. Both wave counts now see a five up complete.
Which means both wave counts now expect a correction down.
The main expects the correction is the start of minor 4. A movement at minor degree should begin with a clear five on the hourly chart.
The alternate expects the correction is minuette (ii). Which should be a three on the hourly chart.
The confirmation / invalidation point is 1,224.78. A new low below that point now tells us the correction is going to be deeper and longer lasting.
But if we just see a little three down on the hourly chart and price remains above 1,224.78 then it’s a smaller second wave correction, and the fifth wave of minute v is extending.
Does that all make sense?
Confirmed…. Minor 3 or I of minor 3 ended today at 1274.47…. Now a 5-3-5 correction hopefully for II down…
How do u confirm??? Pls provide reasoning.
Lara:” Minuette wave (iv) may not move into minuette wave (i) price territory below 1,243.95.”
Means if it does than min iv is over.
Price needs to move down below 1243.95.
Minuete wave 4 was over this morning and 5 too aparently, as the spike down broke thru supoort and also the higher lows of waves . If u draw a parralel line from wave 1 to 3 up and draw a parralel line to the lows , that was breached completely , now price is in a wave B or 2 up… I am voting its a B and then C down and hoping for minor 3 to extend in fact, but no clue invalidation would be now 1224… Also 61,8% of the whole move is right at the base of the triangle at about 1244. I would bet it will hold but bets are not adviced here lol… We shall see… I lost money abit today after winning yesterday, was expecting an extension of minuete 5…. Btw A down is a clear 12345….
Seems B up or 2 up is retracing nicely or maybe already II of minor 3 done? That would be insane tho, hard market today to trade… too volatile with this job data, stops must be wide…. 🙁 I might be wrong and somehow we still in 1st phase of this leg , I just dont see how, since the trend line been breach, anyone has other thoughts?
AND that is not a 2 lol, we are now either in an expanded correction with B up and C following down abit, or that spike down was it for wave 2 of minor 3 and we are going up in an extension of minor 3! Thats only way can be seen now… 🙂
Actually I am not sure where wave 4 ended, opinions pls?
maybe wave 4 ended at 1250,50……I think this because the uppward movement from 1255,67 to 1274,64 seems in 3 waves and it can be a B wave within wave 4 and the downward movement from the topto 1250,50 can be a C wave within wave 4…
maybe…..maybe……please wait Lara opinion…..
now…. this upward movement with the new max ..over 1274… maybe is wave (v) within minute V…near the Lara target at 1280….
Hoping Lara shows up tooo…. 🙂 But what you are saying is not valid, a wave 4 of such amplitude is possible but improbable:))) I am trading for 5 years, never seen anything like that. So I think we got ourselves an extension of minor 3 , but we could be starting a wave C down also for an expanded flat! Waiting on Lara to confirm my calls though… no ideea 🙂
Ok… Lara, do you think we are in 2 of 3 of 5 and its extending or did we had a truncation and minor 3 ended at 1273.85 ?….. damnit I am still long, stop at 1258,5…. This decline is not a wave 4 for sure, can only be a 2… or start of impulsive down 🙁 – not sure
or the NFP figures were leaked early. And this could be what you’re seeing, and maybe the trend will get back on track. Hopefully!
I think my chart above will answer this question
At what point we must close our position…when is the time to say minor 3 is over..
Lara: “When minute wave v may be complete (that means minor wave 3 complete ???), then this main wave count expects the next movement down to begin minor wave 4 to subdivide as a five wave structure on the hourly chart, as a movement at minor degree should.”
What is the target and duration for corrective wave minor 4?
It’s most likely to end within the price territory of the fourth wave of one lesser degree.
And so that is minute wave iv triangle which has its territory from 1,261.94 to 1,190.9.
The 0.236 Fibonacci ratio sits nicely in that range at 1,208, so that would be a reasonable expectation.
Minor 2 lasted 9 daily candlesticks. It was a zigzag. They tend to be quick structures.
So minor 4 may last a bit longer than minute iv (14 daily candlesticks). It may be a flat, combination or triangle most likely.
Can count 3 waves and 4th in process in an hourly chart…does this means we are in the last stage of this minor 3 up..??
Dreamer
What is the target for int wave 2??
I will ride this int 1 as far as i can.
I can’t calculate a target for intermediate (1) to end until I know where minor 5 within it begins.
I’ll be looking left, at past support / resistance for some clues though.
Lara..
Is minutte 4 is undergoing its C wave..??..
If that is correct than minutte 4 should end about 1251.. A=C..
Can you put light on it..??
I would think that is may actually be over. But that is based upon the assumption that the downwards movement from todays high looks like a three wave structure.
And my last assumption based on what the structure looked like expected that the structure I have now labelled minuette wave (e) was a five. Turns out it must have been a three.
Another Bear Becomes Bull, CIBC Sees Potential For Gold To Hit $1,400
By Kitco News – Thursday March 03, 2016 15:03
http://www.kitco.com/news/2016-03-03/Another-Bear-Becomes-Bull-CIBC-Sees-Potential-For-Gold-To-Hit-1-400.html
Gold prices are at their highest in more than a year with key technicals in play
Mar 3, 2016 3:19 p.m. ET
“However, unless gold breaks and trades over $1,276, I am advising clients to be cautious going long in gold.”
Gold’s ‘golden cross’ the first in over 1 1/2 years, is not a golden ticket for bulls
http://www.marketwatch.com/story/gold-ticks-higher-shows-early-strength-in-march-2016-03-03
Update on NUGT vs JNUG. Back in February, I noted that NUGT was outperforming JNUG and that I suspected JNUG would “catchup”. That’s what happened. JNUG is now up 272% from the bottom and is outperforming NUGT. It will be a great opportunity to buy one of these when gold has completed Intermediate wave 2 down for the Intermediate wave 3 ride up.
Dreamer, great charts. I’m looking forward to NUGT at the bottom of intermediate wave (2) and intermediate wave (3) up even higher that where ever intermediate wave (1) ends. Amazing opportunity. I’ll be dreaming of it.