
Sideways movement was expected.
Price has moved sideways for an inside day.
Summary: A correction is still unfolding and should continue sideways. The correction may include a new high above 1,279.45. It is most likely a fourth wave at minor degree and may end in a further seven or twelve days.
New updates to this analysis are in bold.
Last published weekly chart is here.
MAIN ELLIOTT WAVE COUNT
Click chart to enlarge.
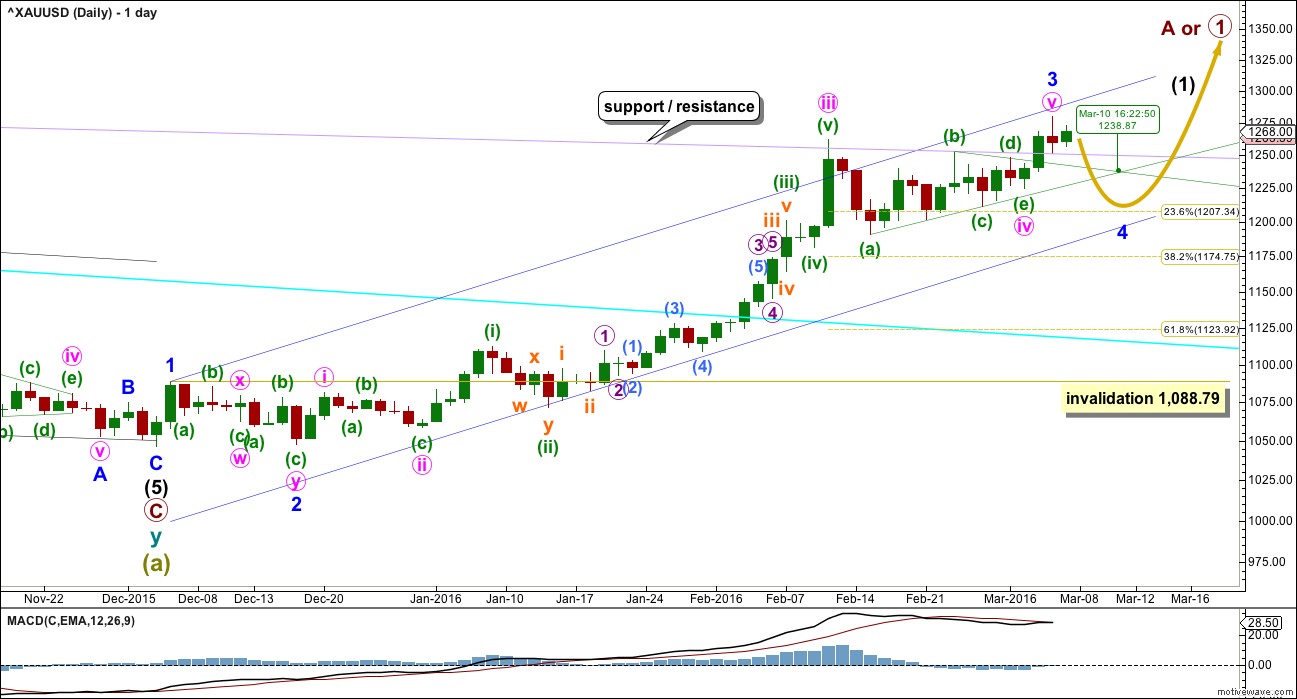
Gold has very likely changed from bear to bull.
So far, within the first five up, the middle of the third wave is now most likely complete. The strongest move may still be ahead. Gold typically exhibits swift strong fifth waves to end its third wave impulses. Look out for surprises to the upside for minute wave v and minor wave 5.
Friday’s upwards movement may have completed minor wave 3.
Ratios within minor wave 3 are: there is no Fibonacci ratio between minute waves iii and i, and minute wave v is just 0.07 short of 1.618 the length of minute wave i.
Minor wave 2 was a very deep 0.97 double zigzag lasting nine days (one more than a Fibonacci eight). Given the guideline of alternation, minor wave 4 may be expected to be a longer lasting sideways structure such as a flat, combination or triangle. It may last a Fibonacci thirteen days most likely. If it is a triangle, it may take longer, perhaps a Fibonacci twenty one days.
Minor wave 4 may end within the price territory of one lesser degree. Minute wave iv has its range from 1,261.94 to 1,190.9. The most likely target for minor wave 4 would be the 0.236 Fibonacci ratio at 1,207 as it lies within this range.
The triangle trend lines now cross over on 10th March. A trend change may be seen on this date. It does not have to be the end of minor wave 4. It may only be the end of minute wave a or b within it.
So far price is finding strong support at the lilac trend line. This may continue to provide support. If that is the case, then this correction may be very shallow.
Click chart to enlarge.
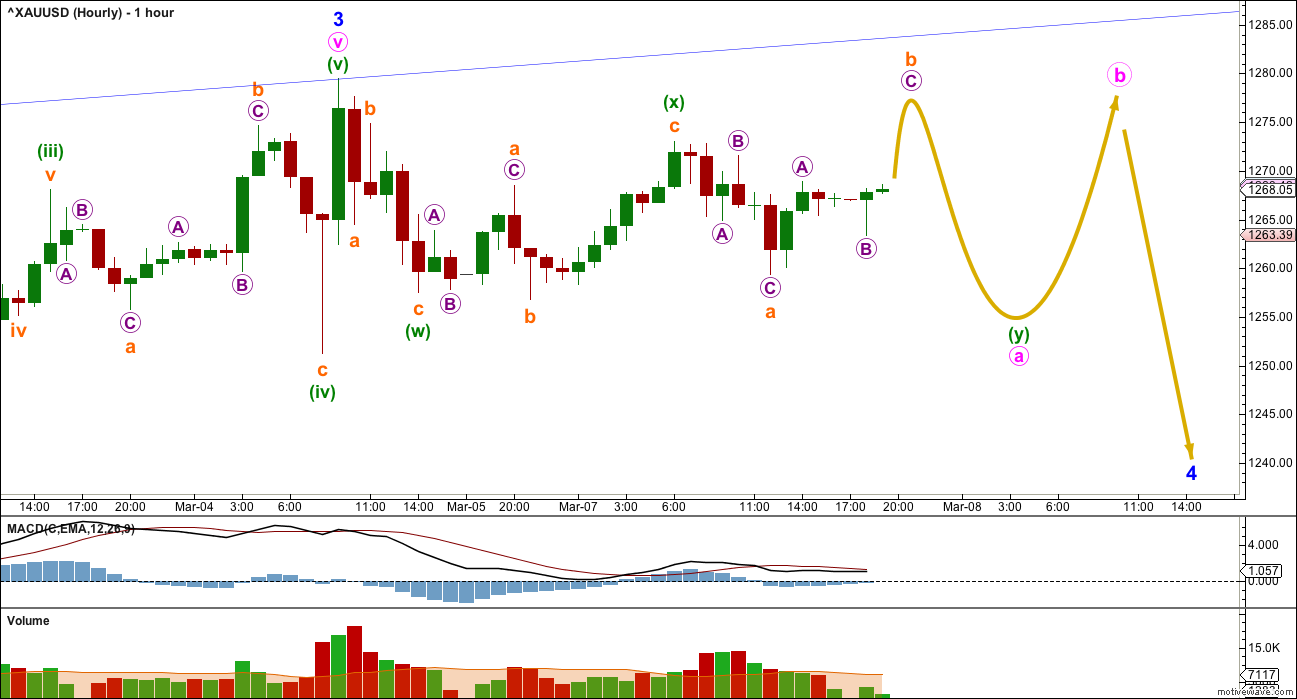
Minor wave 4 was expected to begin with a five down at the hourly chart level, but that has not happened. Only a three down can be seen so far. Price is moving sideways in an ever decreasing range so far.
There are several structural possibilities for minor wave 4. It may be a flat, combination or triangle most likely to exhibit alternation with the double zigzag of minor wave 2. The labelling will change as this correction unfolds and as the structure becomes clearer. It is still impossible at this early stage to tell which of 20 possible structures is unfolding.
The labelling for this correction works in the same way for the main and alternate wave counts at the hourly chart level. These are just two possibilities which can be seen at this stage.
The correction may be unfolding as a flat or triangle, and for both of these structures wave A should be a three. Minute wave a may be an incomplete double combination which is classified as a three.
Within the combination, the first structure of minuette wave (w) is a zigzag. The double is joined by a three in the opposite direction, an expanded flat labelled minuette wave (x). The second structure of minuette wave y may be a flat or triangle. If it is a flat correction, then within it subminuette wave b must retrace a minimum 90% of subminuette wave a at 1,271.68. A triangle has no minimum requirement for subminuette wave b.
Combinations may include new price extremes beyond their starts. A new high above 1,279.45 would most likely be part of this correction and not the resumption of the upwards trend at this stage.
The structure of the correction cannot yet be seen as complete.
ALTERNATE ELLIOTT WAVE COUNT
Click chart to enlarge.
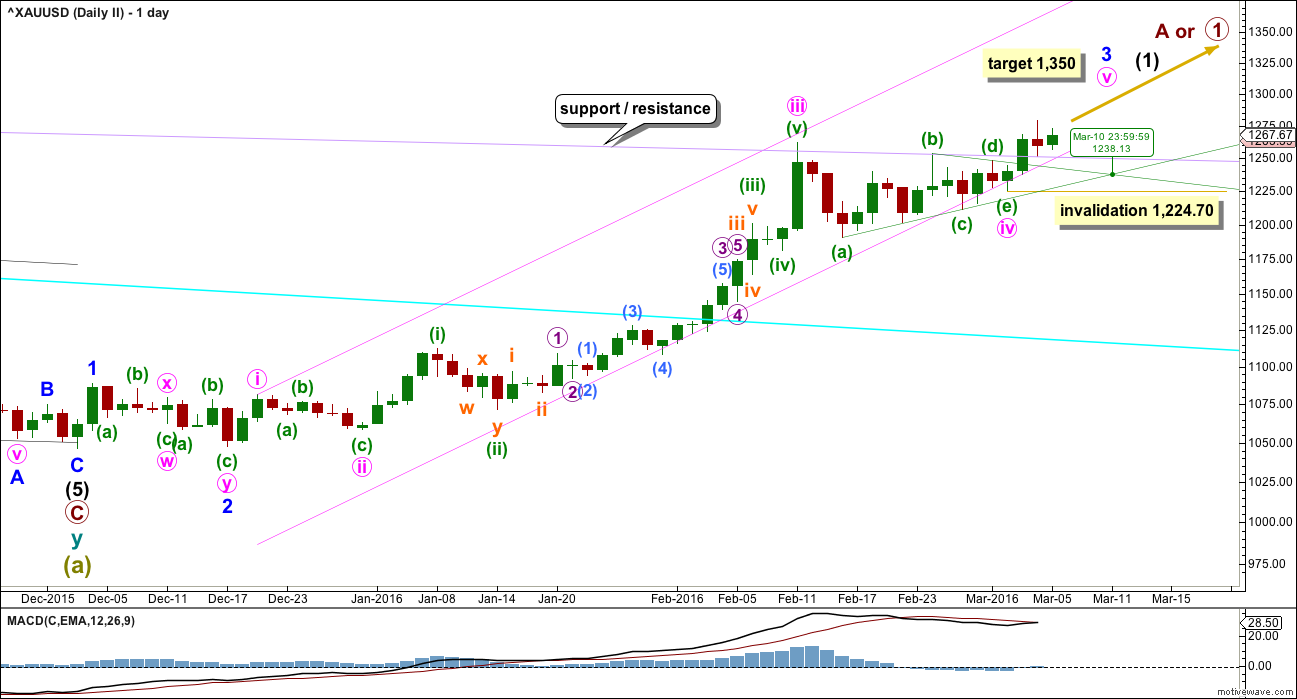
This alternate wave count has a low probability. It is published to consider all possibilities.
By simply moving the degree of labelling within minute wave v down one degree, the upwards movement that ended on Friday may be only the first wave within minute wave v.
Minute wave v may be extending.
At 1,350 minute wave v would reach 0.618 the length of minute wave iii.
Downwards movement for Friday found support at the lilac trend line.
Minor wave 3 may end on 9th March, if it ends when the triangle trend lines cross over.
Click chart to enlarge.
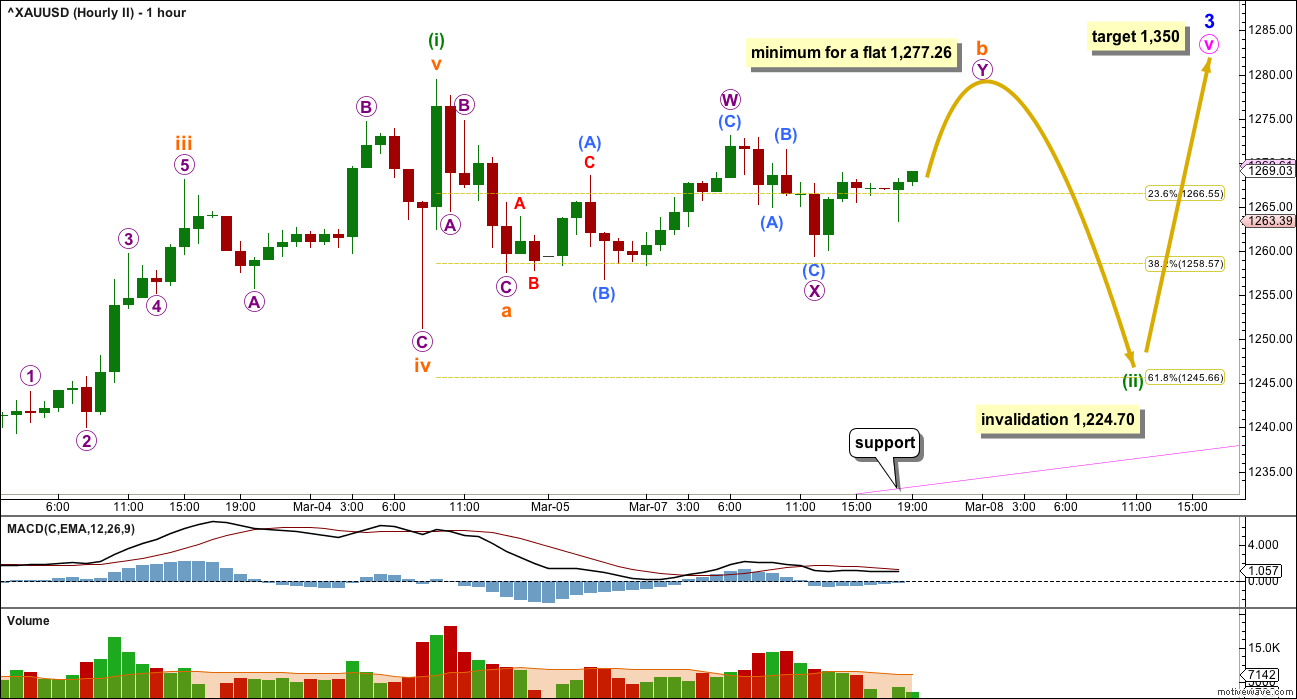
A flat correction may be unfolding sideways. This idea works in the same way for both this alternate and the main hourly wave counts. For the main hourly wave count, the flat correction would be only minute wave a within a larger more time consuming structure for minor wave 4.
If a flat correction is unfolding, then subminuette wave a is a complete zigzag. Subminuette wave b may be an incomplete double combination which must retrace a minimum 90% of subminuette wave a at 1,277.26. Subminuette wave b may make a new price extreme beyond the start of subminuette wave a at 1,279.45 as in an expanded flat. A new high does not mean the correction is over. At this stage, the correction cannot be seen as complete and upwards movement is subdividing as threes and not fives.
When subminuette wave b may be complete, then the type of flat may be known and a target may be calculated for subminuette wave c. That cannot be done yet.
The most likely point for minuette wave (ii) to end remains the 0.618 Fibonacci ratio at 1,245.66.
Minuette wave (ii) may not move beyond the start of minuette wave (i) below 1,224.70.
TECHNICAL ANALYSIS
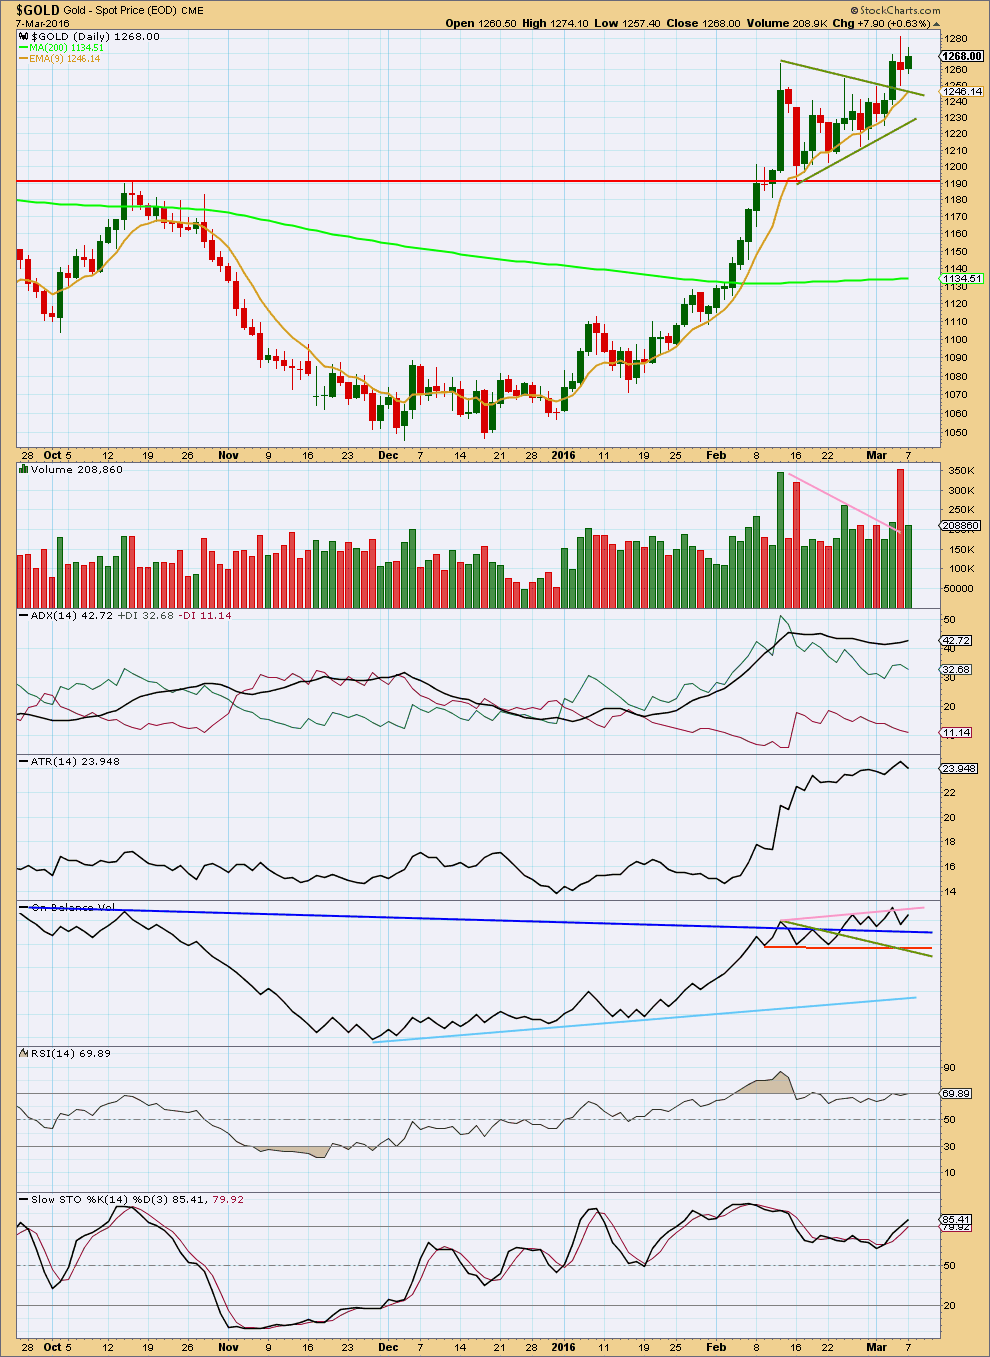
Click chart to enlarge. Chart courtesy of StockCharts.com.
Two things on this chart strongly indicate upwards movement is over for now for Gold: the volume spike for Friday and strong divergence between price and RSI.
Gold often ends its fifth waves on a sharp movement with a volume spike. Friday’s volume spike looks typical. That volume is for a downwards day which further reinforces the idea that more downwards movement is now ahead for Gold. The fall in price was supported by volume on Friday.
Monday’s candlestick has a small real body which is green, indicating the bulls were in charge overall for the session. The upper and lower wicks are about even and volume is light. This is not convincing upwards movement and looks typically corrective.
ADX and ATR finally caught up as they now indicate there is an upwards trend. Both these indicators are lagging as they are based on 14 day averages.
RSI shows strong divergence with price: as price made new highs to the high on 4th March, RSI failed to make corresponding new highs. A failure swing by RSI is strong indication of a trend change here.
Stochastic also shows divergence with price. Downwards movement should now be expected to continue until Stochastics reaches oversold and price finds support at the same time. The first horizontal line of support is about 1,190.
I will use the trend lines on On Balance Volume to assist in finding the end of downwards movement. When the Elliott wave structure on the hourly chart may be considered complete, if OBV finds support at the same time, this may be the end of downwards movement.
Price should find support about 1,190, if it gets down that low.
This analysis is published @ 08:25 p.m. EST.
GDX/GDXJ/HUI/XAU all have bearish engulfing reversal candle. May be March correction just arriving???? SM market has also turn down in sympathy.
The annual PDAC pump is wearing off, now for the annual dumping that follows. Happens every year! John Kaiser said it would not happen last year but it happened anyway last March. People I know sold most of their possitions like 98% early in anticipation of this post PDAC dump to pick up cheap stuff…. but who knows … might be different this year and gold might go ballistic again tommorow…. still holding my small super microcap (under 15 million market cap) in case that happens… some (Gary) actually bought an initial position in GDX today, waiting for further pull-back to add more
I’m inclined to think this year will be different because there are so many good and solid fundamentals like gold outperforming S&P (ie. big players with real big money are interested again) unlike all the other ill-fated bounces in the past 4 years. There was no fundamental behind those bounces, this time we do. That said COT is really scaring me big time.
I’ll be buying some GDX before the close today as minute wave a may end today then gold may move up in minute wave b for 3 days. I’ll sell GDX higher up in that.
So far price has found support at the lilac trend line (if you’re not sure how to exactly draw it check the weekly chart, linked to in the start of the analysis every day)
Lets watch that line closely. If it offers support then this fourth wave may be very shallow indeed.
With today printing a red candlestick, if that is how it ends, then the alternate is further reduced in probability. A low degree second wave should be over more quickly than this.
Upwards movement was high enough to fit the requirements for a B wave of a flat correction. It met the minimum 90% of the prior three down, the A wave of a possible flat.
This correction is still unfolding as one of multiple structural possibilities. It could be a flat, combination or another triangle.
As this unfolds the structure as it is labelled will change. It is still impossible to tell with certainty exactly the pathway price will take to finish the correction. Which is why trading corrections is only ever advisable for the most experienced and nimble of traders. For the rest of us it is time to step back and prepare for the next entry opportunity.
The correction is incomplete.
A new low at least slightly below 1,259.38 short term is likely if this five down is a C wave of a flat; that would move C slightly below A and avoid a rare running flat.
If this is a C wave of a larger flat then a slight new low below 1,257.53 would be expected for C to avoid a truncation.
Conclusion: short term price should move lower. I see it in a small fifth wave.
Lara is the main count still expecting a b wave higher up that now before finishing minor 4? I’m looking to buy GDX and sell it higher up than here before then.
Yes.
If this is minor wave 4 then this current chop is just minute wave a, close to completion now.
When minute a is complete then minute b should move upwards and it may make a new high. It should last about three days maybe longer.
Minor 4 is unlikely be be over so quickly in just three or four days, when minute wave iv one degree lower lasted 14 days.
Triangles are more time consuming though, so minor 4 may not be longer than 14 days, but it should be at least 8 days IMO to have the right look. And probably close to 14.
I believe gold will drop more by the close.
I’m looking to buy some GDX even lower today as Lara’s charts show gold moving up again before dropping lower. Also surprises are to the upside. i would sell it at the next high.
Ok… it seems to me this wave 5 of C is behaving bit weird, might have just truncated at 1260… not sure 🙂
Perhaps we will get a full 5 wave down by the close?
However, I’m not looking for the low point today for this correction minor wave 4 as a further 7 to 12 days to do that.
However the LOW probability alternate may make it’s low today before heading for 1350. But wouldn’t expect it.
I would like to buy GDX even lower by the close hopefully.
I’m not sure but I think analysis has a higher up b wave before the minor 4 bottom. But that may not be to scale time wise?
You’re spot on Richard.
Spot on as not to scale up wave which may be just indicating minor 5 or spot on we get a higher wave before minor 4 ends?
Spot on as expect more downwards movement today and spot on as that won’t be the end of the correction.
Also spot on as a B wave will then take price higher
If Trump wins big tonight, all bets are off. Tough to hold when all the smart people I trust say sell.
Trump factor with gold?
Ok, I live in Romania… Can you pls explain what are the impacts on US indexes and also gold if Trump wins? Or what if looses? I have no ideea, sorry! 🙂
It is just one night so no difference. If he wins Repulican nonimation then maybe an effect if wins president then bigger effect.
Presidential election win would be more towards the end of the year.
So today Trump has no effect on gold until many months from now.
We were expecting a pull back on Monday but Trump won 2 big states on Sat so gold went up anyway. People with money to buy gold are doing so for fear that anti current social economic Trump will be president. He’s winning with much fanfare currently. Tonight is another big night. Remember that lost of faith in government is a big if not the most important positive fundamental for gold. That said it’s still early but I’ll tune into CNN tonight for the results. If Trump wins big again and gold goes ballistic again tomorrow it would be very interesting IMHO.
Trump effect on gold I would strongly suggest is not happening at all and any effect on gold is likely Elliott Wave effect or several other factors that effect gold like wars and central banks negative interest rates or what the US Fed said or what is happening at China multi country conference.
US campaign Trump is in will go on quite awhile just to pick the one final Republican candidate to run for president. Trumps day to day events is trivia to world gold price. Although there may be many rushing to buy gold or rushing to sell gold the day after a Trump event where he win one state or several states. However there are 50 US states. People may get excited liking or hating Trump but USA has over 300 million people and most are not focused on gold. I’d rather focus on the EW effect on Gold.
I’m eyeing that big gap at HUI 135. Rule of thumb is “gap will be filled”. Hoping for that big pull back which is healthy and load up on GDX and my fav micro for 1000% gain. My fear right now is gold pops up too high too soon again and momentum ADX gets out off hand setting the stage for a very nasty correction. Watching ADX.
Gold is a global market. I wouldn’t expect a Trump win in (not sure what you call it) a primary? Part of deciding which candidate the Republicans will put forward…
Not sure that it is a big enough event to have a big impact on this global market.
Plenty of people outside the USA have only the vaguest idea of what’s happening over there.
Reading waves is not so easy..wheather they are in 3 or 5…till now its not easy for me to identify…very complex…still too long learning is needed for me… 🙂
Even after doing this for eight years I have found that sometimes a wave just is not clear.
Zigzags and impulses can look the same.
It is the most frustrating aspect of Elliott wave, and what makes it so darn hard.
…. will expect 1260-59 to hold should a break below 1262 occur, failing which will likely open up downside 1252-51; lets see….
Hello. I would say in this C support is 1256-1257 then 1250 and finally 1243-1245 . Let’s see from where it will be a reaction spike up, that’s what I expect. So far I see we are already in wave 5 down or in 5 of 3 only of C ! So be ready to buy soon in my opinion 🙂
Main – So far price is finding strong support at the lilac trend line (about 1255) . This may continue to provide support. If that is the case, then this correction may be very shallow.
Alternate – The most likely point for minuette wave (ii) to end remains the 0.618 Fibonacci ratio at 1,245.66.
Gold made a high of 1277.3..
What does this mean .?
Fits with both counts. We will likely move lower for the rest of the day carving out a 5 wave structure (c wave) following Lara’s game plan. Then Lara will update us.
Yes indeed. Now look for entry at 1245.