
Last week both Elliott wave counts expected at least a little downwards movement. This is what happened.
Summary: A little upwards movement should unfold short term. A new high above 16.132 would invalidate the main wave count and confirm the alternate. If that happens, the target is at 17.019. A new low below 14.970 would invalidate the alternate wave count and confirm the main wave count. If that happens, then the target is at 14.514 for a second wave correction to end.
New updates to this analysis are in bold.
WEEKLY WAVE COUNT
Click chart to enlarge.
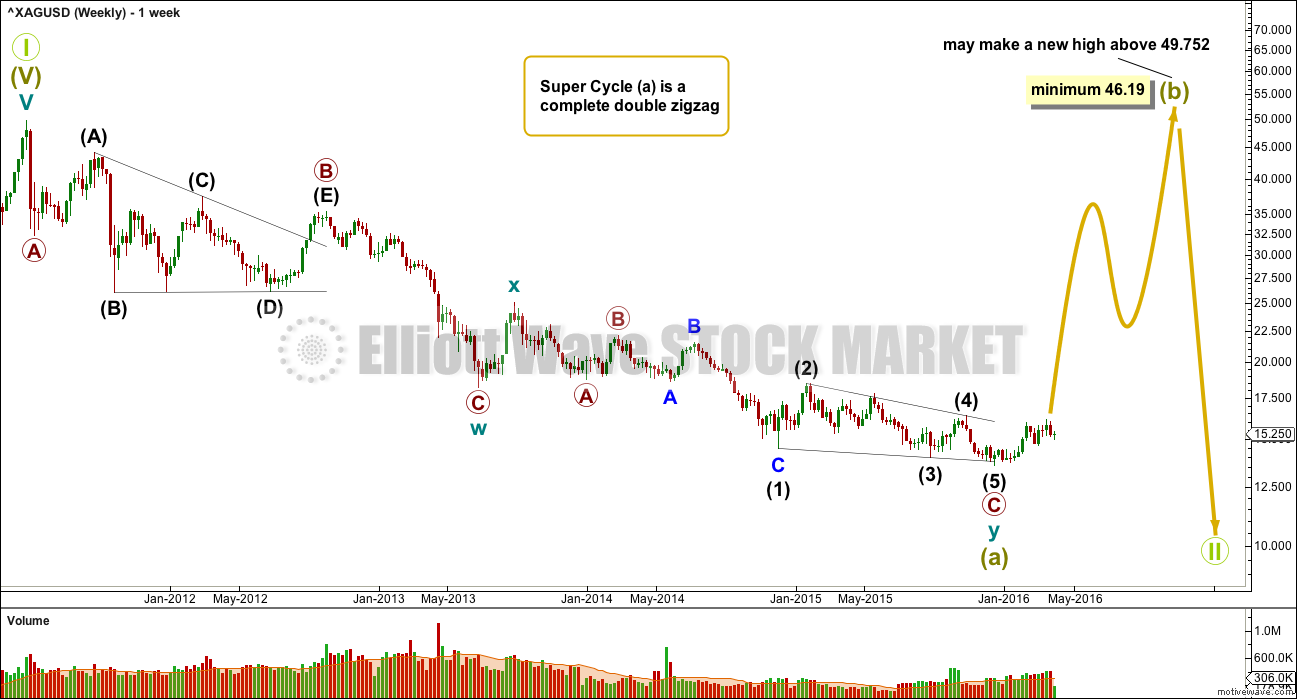
If super cycle wave (a) is a double zigzag, then within the second zigzag of the double labelled cycle wave y the structure may be complete.
Primary wave C is an ending contracting diagonal within the zigzag of cycle wave y. All subwaves subdivide as zigzags. The third wave is shorter than the first, the fifth wave is shorter than the third, and the fourth wave is shorter than the second. The trend lines converge.
There is a small overshoot of the (1)-(3) trend line at the end. This indicates the contracting diagonal structure is very likely to be complete.
If this wave count is correct, then super cycle wave (a) has subdivided as a three wave structure. That indicates Grand Super Cycle wave II may be a flat correction.
If this correction at Grand Super Cycle is a second wave (as opposed to a fourth wave), then a triangle may be eliminated.
A combination may also be eliminated because the first wave is a multiple. Combinations may only consist of a maximum of three corrective structures, so within each of W, Y and Z they may only subdivide into simple A-B-C structures (or A-B-C-D-E in the case of triangles). To label multiples within multiples increases the maximum beyond three, violating the rule.
Super Cycle wave (b) must retrace a minimum 90% of super cycle wave (a) at 46.19. Super cycle wave (b) may make a new price extreme beyond that seen for super cycle wave (a) above 49.752 as in an expanded flat.
Super cycle wave (b) may be any one of 23 possible corrective structures. It is impossible to predict at this early stage which one it will be, only to say it is unlikely to be a rare structure such as a running flat, expanding triangle or triple combination. That still leaves multiple structural possibilities. The most likely structure which would be able to meet the minimum price requirement at 23.945 is a zigzag.
The first movement up for a wave of this large degree must subdivide as a clear five at the daily chart level, and probably at the weekly chart level also.
DAILY WAVE COUNT
Click chart to enlarge.
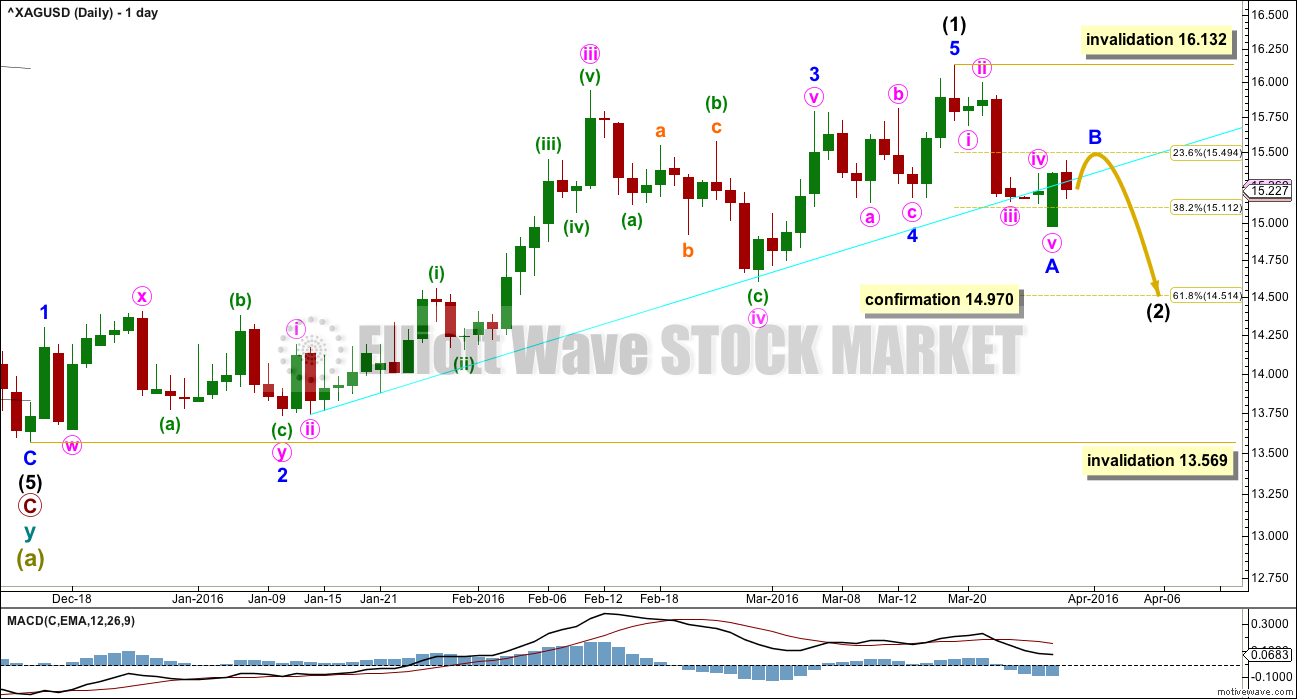
Minute wave v to end minor wave 3 is slightly truncated by 0.154 within intermediate wave (1). Although this reduces the probability of this wave count, Silver does seem to exhibit truncations more readily than Gold; I will let the wave count for Gold lead Silver. Gold expects that intermediate wave (2) has most likely arrived.
Intermediate wave (1) lasted 66 days (not a Fibonacci number). Intermediate wave (2) would likely last longer; second wave corrections are often more time consuming than the first waves they correct.
So far downwards movement within intermediate wave (2) for minor wave A looks like a five wave impulse. This indicates intermediate wave (2) may be unfolding as a simple zigzag. Within a zigzag, minor wave B may not move beyond the start of minor wave A above 16.132.
Intermediate wave (2) may not be seen as complete at the low labelled minor wave A because a correction may not subdivide as a five.
Intermediate wave (2) may not move beyond the end of intermediate wave (1) below 13.569.
ALTERNATE DAILY WAVE COUNT
Click chart to enlarge.
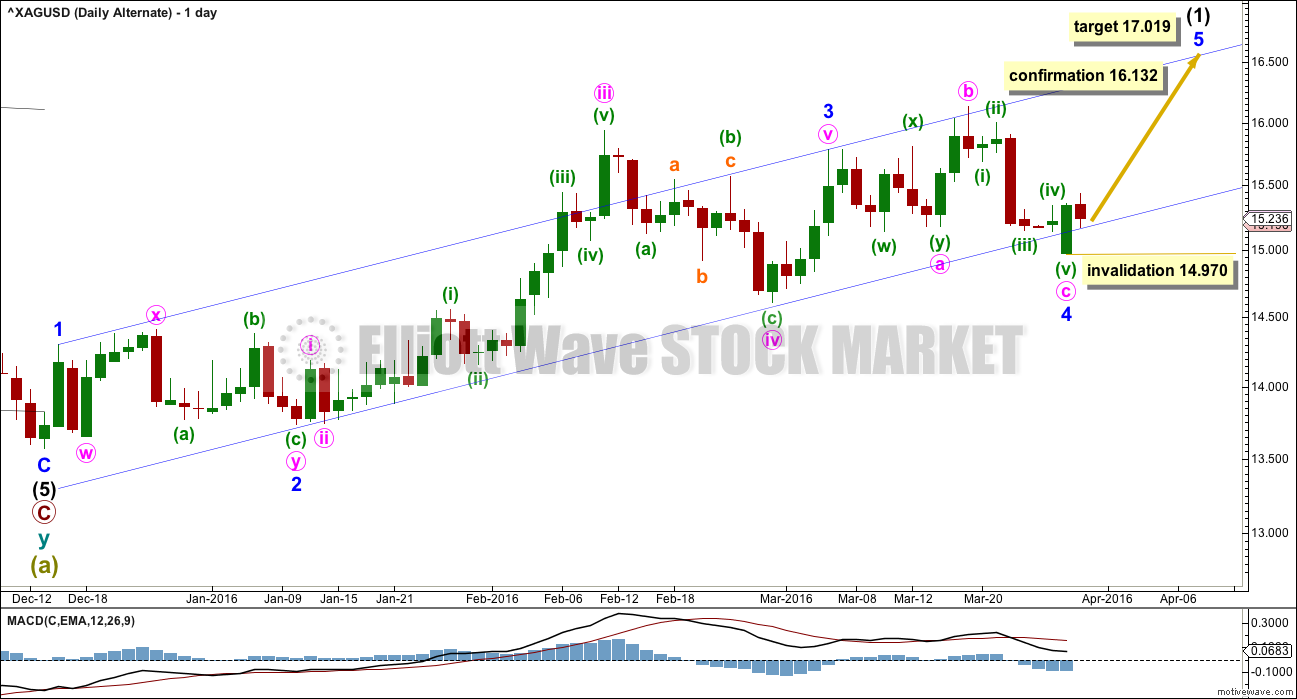
This wave count fits with the alternate for Gold.
Minor wave 2 was a combination. To exhibit some alternation minor wave 4 may be a more shallow expanded flat.
If minor wave 5 were to be only equal in length with minor wave 1, it would be truncated. It may reach equality in length with minor wave 3 at 17.019. If this target is wrong, it may be too high.
No second wave correction may move beyond the start of its first wave below 14.970 within minor wave 5.
Minor wave 4 may not move into minor wave 1 price territory below 14.300.
TECHNICAL ANALYSIS
DAILY CHART
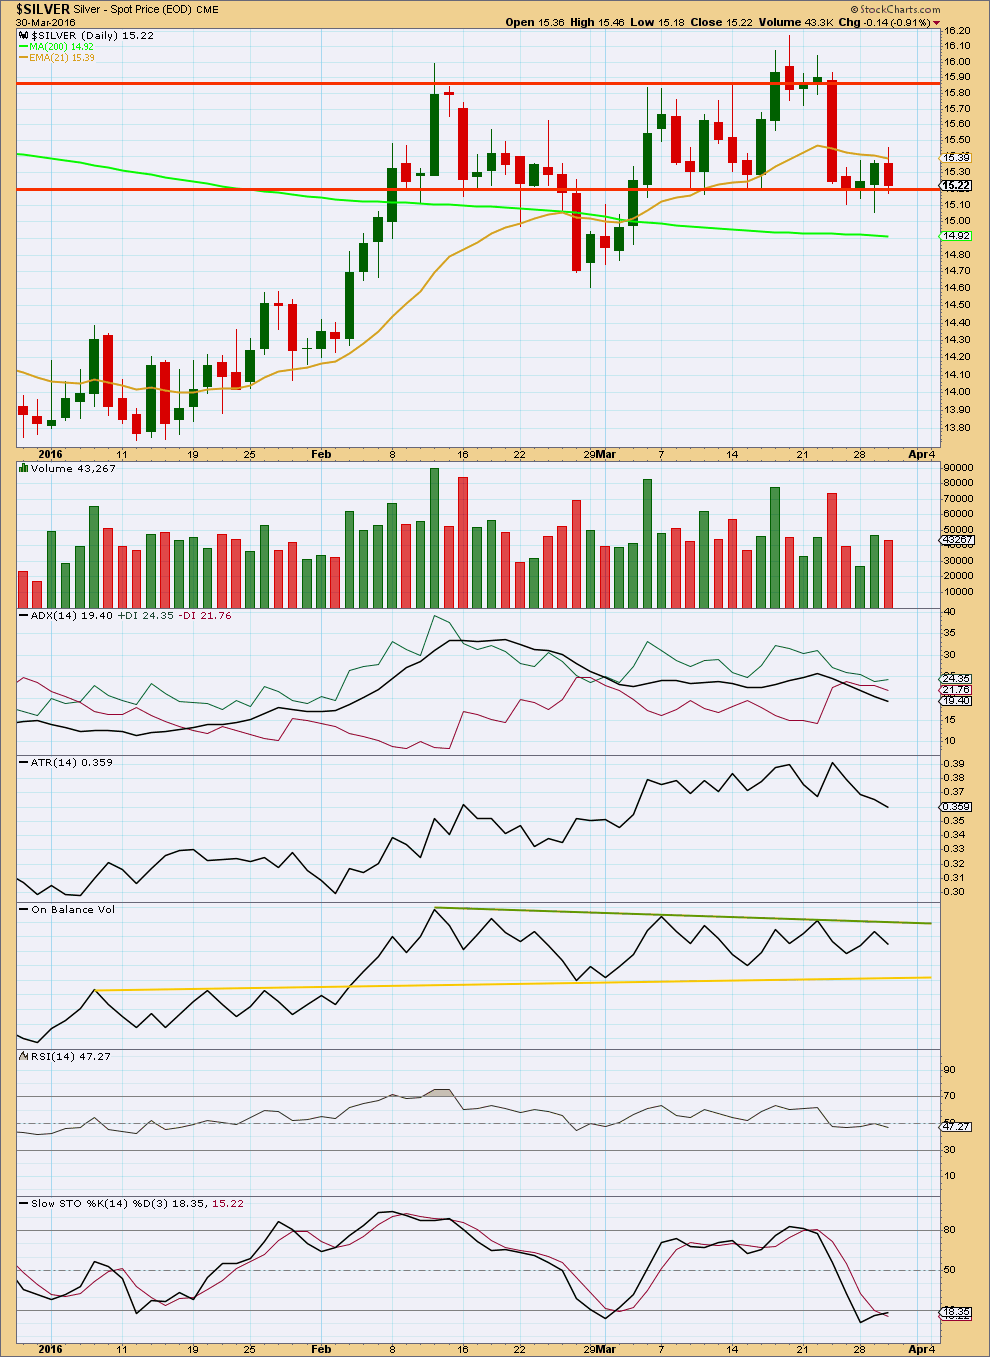
Click chart to enlarge. Chart courtesy of StockCharts.com.
Price is still within the horizontal red trend lines delineating an area of consolidation. During this consolidation which began on 7th March it is an upwards day which has strongest volume. This suggests an upwards breakout is more likely than downwards. However, this does not work very often for Silver. It is more reliable for Gold.
ADX is declining indicating the market is not trending. ATR agrees as it too is declining.
On Balance Volume is bound within two trend lines. A break above the green line would be bullish. A break below the yellow line would be bearish.
RSI is neutral. There is room for price to rise or fall.
Stochastics is returning from oversold. An upwards swing from price should be expected about here as fairly likely.
This analysis is published @ 12:38 a.m. EST on 31st March, 2016.