
A new high above 1,243.19 invalidated the main hourly Elliott wave count and confirmed the alternate.
At that stage, the target was at 1,256. So far price has reached up to 1,259.
Summary: The main wave count must see downwards movement about here, and it is supported by lighter volume for today’s upwards movement. A new low below 1,236.56 would confirm the main wave count and the target would be 1,131. If price continues higher for another day, the alternate would increase in probability.
New updates to this analysis are in bold.
Last published weekly chart is here.
MAIN DAILY ELLIOTT WAVE COUNT
Click chart to enlarge.
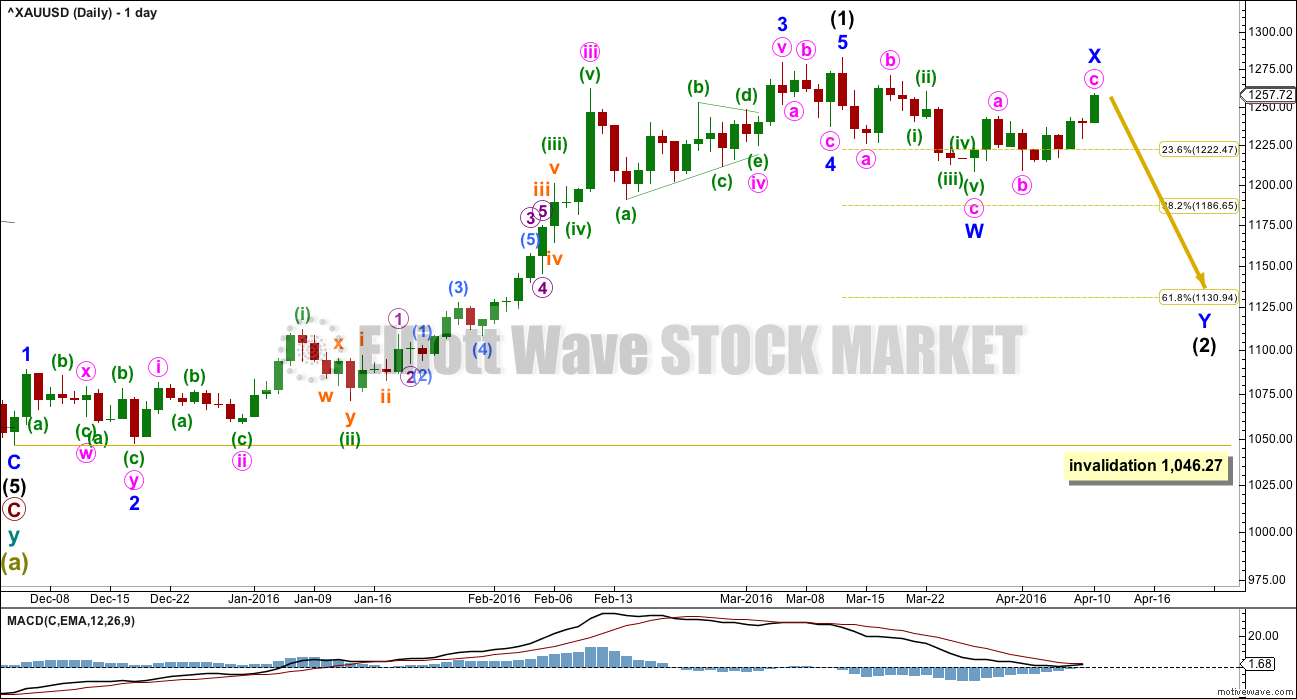
Intermediate wave (1) is a complete impulse. Intermediate wave (2) has begun and is most likely incomplete.
The first movement down within intermediate wave (2) fits as a zigzag. So far movement to follow it is sideways.
At this stage, it looks like intermediate wave (2) may be unfolding as a double zigzag. Minor wave X may be a zigzag within the double.
Within double zigzags, the second zigzag exists to deepen the correction when the first zigzag does not move price deep enough. Here, minor wave W ends just below the 0.236 Fibonacci ratio fitting the description of “not deep enough” for a second wave correction. The second zigzag in the double should be expected to deepen the correction; minor wave Y may end about the 0.618 Fibonacci ratio at 1,131.
To achieve the purpose for the second zigzag to deepen the correction the X waves of double zigzags are normally shallow.
The dark blue channel is a best fit. If price returns to within the channel, then it should again show where upwards corrections find resistance.
It is possible that minor wave X may continue higher and be deeper. There is no upper invalidation point for minor wave X; X waves may make new price extremes beyond the start of the first structure in the double. If minor wave X continues higher, then intermediate wave (2) would more likely be a combination than a double zigzag. They are very different structures.
While double zigzags should have a slope against the prior trend, combinations should not. They are sideways structures. To achieve this the second structure in the double normally ends close to the same level as the first structure. In this instance, that would see intermediate wave (2) a very shallow correction failing to reach the 0.382 Fibonacci ratio. This is possible, but it has a low probability. This is the risk to the wave count today.
Intermediate wave (2) may not move beyond the start of intermediate wave (1) below 1,046.27.
MAIN HOURLY ELLIOTT WAVE COUNT
Click chart to enlarge.
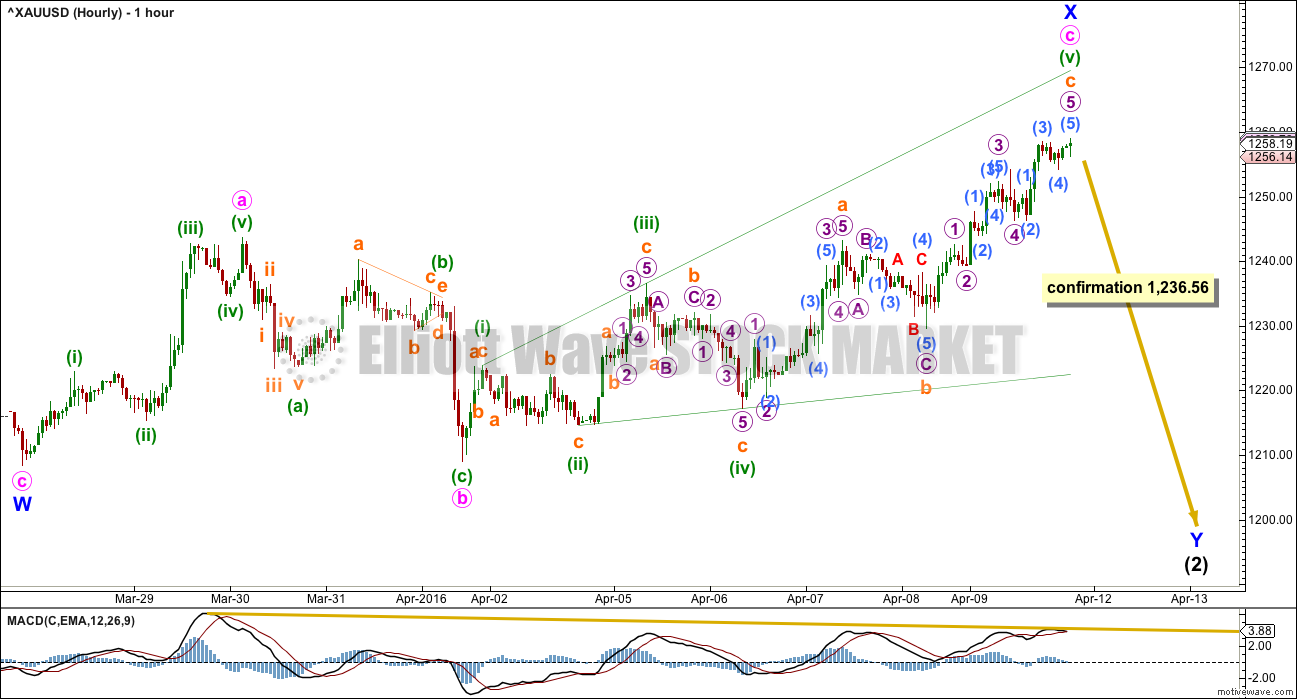
Both hourly charts will show price movement from the low of 1,208.33 on 27th March. For this main wave count, that low was the end of a zigzag for minor wave W.
Minor wave X may now be a complete zigzag. Within the zigzag, minute wave c has no Fibonacci ratio to minute wave a.
Minute wave c may now be a complete ending expanding diagonal. If price continues higher, then minute wave c may complete as an impulse. Unfortunately, there is no invalidation point which differentiates this main wave count from the alternate to the upside. Volume and momentum should guide us to which one is correct.
For this main wave count, minute wave c shows weaker momentum than minute wave a; this is acceptable. The divergence with price and MACD indicates this upwards movement may be weakening.
Minor wave Y would most likely end about 1,131 where intermediate wave (2) would correct to the 0.618 Fibonacci ratio of intermediate wave (1).
ALTERNATE DAILY ELLIOTT WAVE COUNT
Click chart to enlarge.
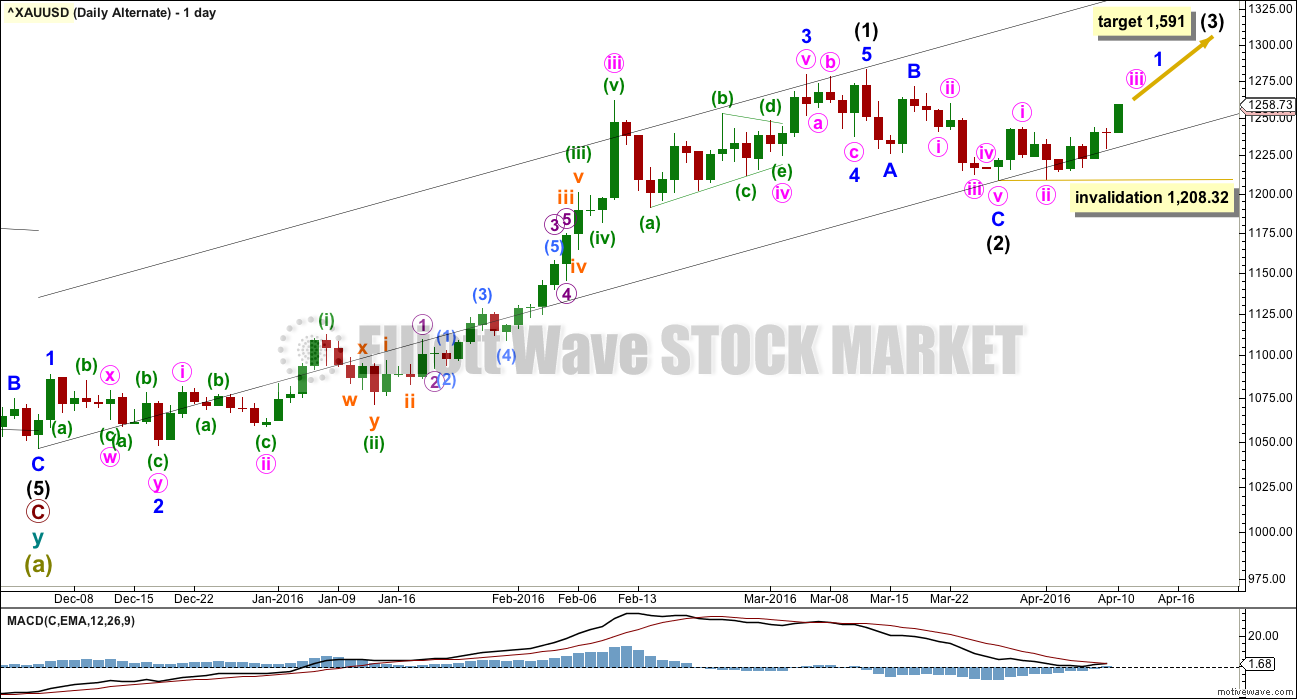
It is technically possible but highly unlikely that intermediate wave (2) is over. This wave count requires confirmation with a five up on the hourly chart for confidence. A new high is not confirmation of this wave count.
If intermediate wave (2) is over, then it is a very brief and shallow 0.31 zigzag lasting only eleven days (intermediate wave (1) lasted 69 days). The probability of this is very low.
At 1,591 intermediate wave (3) would reach 1.618 the length of intermediate wave (1).
Within intermediate wave (3), minor wave 2 may not move below the start of minor wave 1 at 1,208.32.
ALTERNATE HOURLY ELLIOTT WAVE COUNT
Click chart to enlarge.
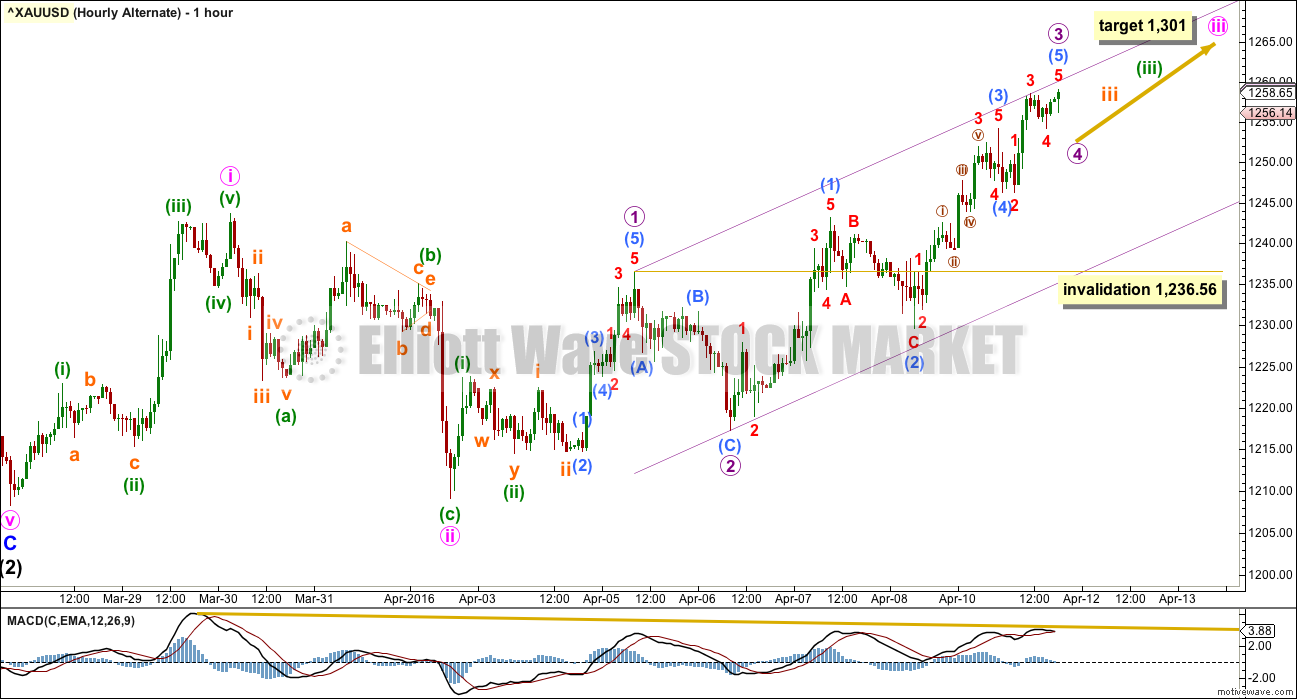
The subdivisions of minute waves i and ii are the same as the main hourly wave count: 5-3.
This alternate wave count would now see a series of four overlapping first and second waves, now being resolved by the ends of the third waves and following fourth wave corrections.
Micro wave 3 may have just ended. It has no Fibonacci ratio to micro wave 1. Micro wave 4 may not move into micro wave 1 price territory below 1,236.56.
Micro wave 3 shows only a very slight increase in momentum beyond that seen for micro wave 1. So far minute wave iii may have passed its middle yet it has not shown an increase in momentum beyond that seen for minute wave i.
This wave count requires a strong increase in upwards momentum to have the right look. Often fifth waves to end Gold’s third wave impulses are swift and strong. If upwards movement continues and momentum increases, this wave count would increase in probability.
At 1,301 minute wave iii would reach 2.618 the length of minute wave i.
TECHNICAL ANALYSIS
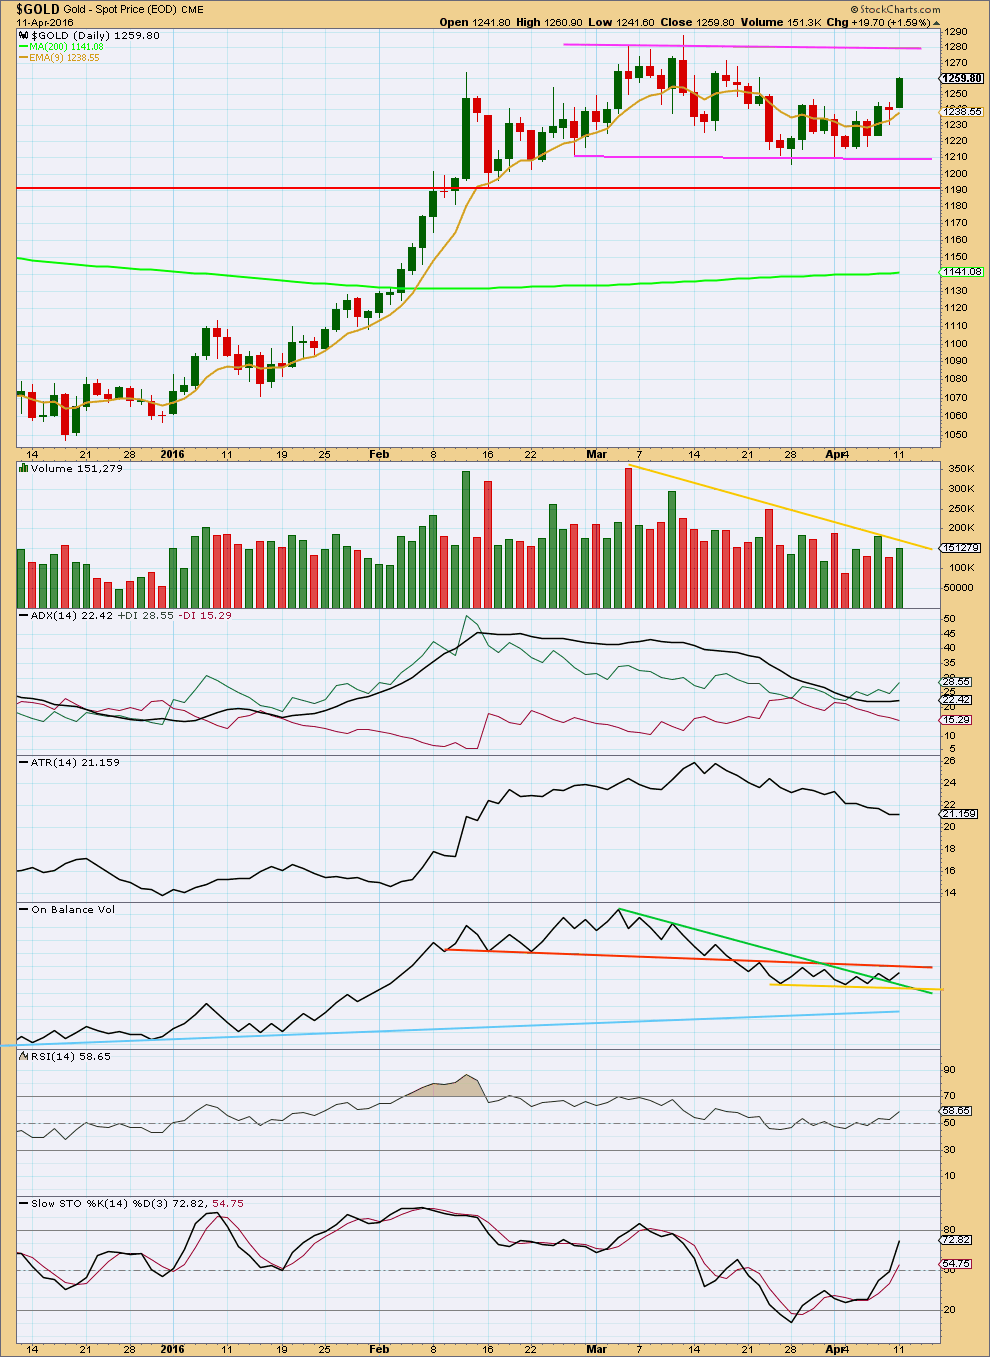
Click chart to enlarge. Chart courtesy of StockCharts.com.
Upwards movement for Monday’s session is not supported by volume. If the alternate Elliott wave count is correct, then Gold should be within a third wave up that should show stronger momentum and stronger volume. That has not happened. Only a strong upwards day with stronger momentum and stronger volume would see the alternate wave count increase in probability over the main wave count. While that has not happened, the main wave count will remain more likely.
The bottom line is Gold has not yet broken out of a consolidation; price is still range bound.
Gold remains range bound between 1,280 and 1,210. During this sideways movement, it is a downwards day which has strongest volume indicating a downwards breakout as most likely.
Volume continues to decline as price moves sideways. This is typical of a consolidation. Gold needs to break above 1,280 on a day with obviously higher volume for the alternate wave count to be favoured. That would constitute a classic breakout, so at that stage the main wave count would be discarded. The main wave count will be preferred while price remains within the range and volume continues to decline.
ADX is today flat; the market is not yet trending. ATR agrees; it is declining.
On Balance Volume today has broken above the green trend line, a weak bullish signal. OBV must break above the orange line, which has strong technical significance, for OBV to be giving a clear bullish signal. The lower green line is removed and replaced today by the yellow line which is showing where OBV is currently finding support. A break below the yellow line would be a weak bearish signal (weak, but stronger than the bullish signal from the green line because the yellow line is horizontal). A break below the blue line would be a strong bearish signal.
RSI is not yet overbought. There is room for price to rise.
Stochastics is not yet overbought. A range bound approach to this market would be expecting the upwards swing to continue a little further until Stochastics is overbought and price finds resistance.
Only the most experienced of traders should be trading a range bound market. The risk of losses on a traders account is amplified in a range bound market. If you choose to trade this, it is essential you use good risk management techniques. The rest of us should wait until the breakout direction is clear and then join the trend.
This analysis is published @ 07:55 p.m. EST.
Point to consider….
– Gdx volume can be deceiving , on Monday April 11th Gdx stretched out 6% higher on “high?” volume; 125,000k shares – hefty indeed.
But on closer inspection Gdx totalled about 71,000k of those shares at 3:59pm and heaved out the remaining 54,000k shares in the last minute of play or almost 45% of the day’s volume were packed into one solitary minute.
So what happened in that last minute? Well, price “Dropped” from 22.77 to 22.72.
This is a common occurrence. Traders dump significant amounts of shares in the last minute and conceal-it into what otherwise looks like a massive bullish volume bar. (Which is why Daily on balance volume should be taken with a critical approach.)
Gdx looks like it has technically topped or very close, … Of course, fundamentals can skew expectations.
Gold has been bullish in a 1 hour price channel since April 6th if anyone is considering DUST
http://www.pmbull.com/gold-price/
Lara here’s chart on $HUI that just broke out this week, 2 months after GLD and SLV.
http://rambus1.com/wp-content/uploads/2016/04/HUI-WEEKLY-555.png
This next chart is a weekly combo chart which has the HUI on top, gld in the middle and slv on the bottom. We’ve been following this chart for a very long time which shows the massive 3 1/2 year consolidation patterns that each one has formed. Both GLD and SLV broke above their top rails several months ago already while the HUI is just now breaking out above its massive seven point bullish downtrend channel. It’s charts like this one that helps us confirm the bull market is still alive and well. If we see the price action become very weak and start trading below the top rails of their respective 3 1/2 year trading ranges then we’ll know there is trouble but as long as the price action keeps confirming the bull market it is what it is.
The full article link is with Dreamer’s comment below. Dreamer April 12, 2016 at 3:31 am
Thanks Richard, I’ve been following these too. What’s also interesting is the SLV/GLD ratio, which is just now showing significant signs of life. Could be an early sign that inflation may be starting to pick up finally. When gold moves up, the gold/silver ratio increases. Its at an historically low level at the moment of nearly 80:1, and should work toward something closer to 16:1.
Well, I think I will go with you Lara at this point. Strong seasonal pull( down), plus probable completion of Head and shoulders, plus strength in stock market puts my money on the short side overnight. Thanks However mental stop at 1265 or so will be kept in mind.
Remember Lara’s words a few days ago : “The market is awaiting some news …”to fullfill what Elliott Wave analysis tells us. I admire her steadfastness.
By the way it’s more dangerous than an head and shoulders . If you look carefully you can see a “spiderweb”,typical dangerous pattern at a top.March 15 I see a head of a “spider” with left and right symmetrical paws.
I have learnt that the goldprice often surprises doing the unexpected.
Look also what EUR/$ does. Goldprice matches mostly the EUR. Maybe some “news”will push the Dollar up. Yesterday we had a secret meeting of the FED…
So,my “Fingerspitzengefuehl”tells me to go with you and Lara’s main count.
Perhaps a 38,2% retracement looks better for Intermediate 2.
Good luck!
SECRET FED MEETING Monday April 11th.
1 Month for news from it.
I read the article about it and the news on that won’t be released until after the nextregular FED FOMC meeting.
So the news from the secret Fed meeting will be at least 1 month from now.
GDXJ does well when silver goes up as it has silver miners in it that last time I checked but that was quite awhile ago.
I did post a link earlier at 2:29 pm. that discussed Silver ratio.
Silver may outperform gold but if everything is just right so be careful.
I did post a link yesterday from Avi Gilburt with his Silver EW chart and some forecast comments.
DUST is dangerous now, unwanted.
I just checked some long time frames for gold, GDX and NUGT and all look bullish.
DAILY time frame is very strong, it just fired BUY today 1st day since March 11th for gold and GDX and NUGT yesterday and today.
Is it possible this bull rally is so strong that it forced intermediate wave (2) to be shorter than expected.
Just like many of the corrections on the way up were shorter than expected.
Also central banks are more and more going negative interest rates and the April 6th FED FOMC minutes delayed interest rates and the US dollar crashed to 14 month low and the markets are spooking investors into gold and miners and they took up even stronger since April 6th.
A slight new high and a small range day is not providing us with clarity.
As unpopular as this might be I still have to judge the main count as more likely than the alternate.
Intermediate wave (2) lasting just 11 days and correcting to just below the 0.236 Fibonacci ratio simply has to have a lower probability than a more normal second wave correction.
The main count expecting intermediate (2) is a very common double zigzag or flat is more likely still.
Today I will take some time to look at the structure of minute wave c within minor X. It now looks like it may be an impulse, not an ending expanding diagonal. I need to see how that fits, and if it means the structure needs to move higher before it is done.
And this is the problem with corrections folks and why I warned at the beginning that with multiple structural options the wave count would change as the correction unfolds.
I am not able to see the future and tell which of 17 possible structures a second wave may be. Flexibility as it unfolds is essential
Thanks Lara for your tremendous efforts.
Thank you Lara. As always, I appreciate your careful attention to detail and openness to consider all reasonable possibilities.
There can be long stretches, even sometimes including tradable price moves, where the current wave structure is unclear. I’m learning to accept that as a necessary element of EV analysis and trading.
Lara, we subscribe here because we trust your judgment. We just also want to contribute additional data that could be helpful.
You’re welcome everybody.
I’m thankful for the sharing of knowledge and experience here. It helps me consider other pieces of information to include in my overall judgement.
So yeah, you are most certainly contributing additional data.
My only thing is I want to be right about the market. To do that I have to consider all possibilities and not get stuck in any one mindset. Flexibility and learning from mistakes. I think we’re doing that pretty well together here.
With the many decades (probably over 300 years) of experience combined within this membership we should have an edge for sure.
Quo Vadis ?
Surging mining stocks point to big move ahead in gold and silver
Money Metals Exchange | about 2 hours ago
http://www.mining.com/web/surging-mining-stocks-point-to-big-move-ahead-in-gold-and-silver/
The HUI gold stocks index surged 6.2% on Monday to close at a 14-month high and today brings even more gains.
What will cause the spread between gold and silver to narrow? Most likely a big move upward in silver prices. The silver market opened this morning just above $16.00/oz, surpassing its high mark for the year. After being compressed for many months within a trading range, the silver market now sits like a coiled spring on the verge of breaking out.
Why This Veteran Trader Is Eying $1,280 Gold – Apr 12, 2016
http://www.kitco.com/news/video/show/Kitco-News/1236/2016-04-12/Why-This-Veteran-Trader-Is-Eying-$1280-Gold
Lara..
Silver made new high…is it possible that silver is completing its minor 5 of int 1 here…
Gold bottomed first…so gold will peak first…so this might be last leg of minor 5…than silver will join the corrective trend with gold…
since last few trading sessions silver is outperforming..this MIGHT BE A REASON FOR GOLD TO WAIT FOR C WAVE..??..as its not showing a sign of powerful breakout upwards..
Yes, that is definitely a possibility for Silver.
It hasn’t ended the upwards move to a new high on a volume spike though, I’d expect to see a volume spike there. Maybe it has a bit further up to go?
Any wave counts?
Was the low since the open today of 1251.29 at 10:10 am the bottom of micro 4 of the hourly alternate count?
Or was the high today of 1262.76 at 4:45 am the top of minor X of the main hourly count?
i really hope not
Wondering the same
Lara, silver had a big day yesterday and invalidated the daily count. Do you think Intermediate 2 in silver is over or is it just turning into a flat and will go down again to finish Intermediate 2? Gold is already up to 1263 as I write this. Just trying to determine if we are going to blast higher or if both Gold and Silver turn back down to complete the Intermediate 2 targets.
Hope recent new high in silver is expanded flat B wave to correspond with a expanded flat in GDX. Need to turn down now or we are in for another bullish run.
Exactly.
The downwards movement for Silver to the last low subdivides as a three. Which is either minor wave A of a flat, or intermediate (2) in its entirety.
All of Gold, Silver and GDX have essentially the same main and alternate counts for the daily chart.
The main count has to be expecting that the second wave correction is not over so that it ends deeper and longer lasting as second wave corrections normally do and so the wave counts for all on the daily chart have the more typical look.
All three markets have an alternate which must be judged to have a lower probability; the intermediate wave (2) was brief and shallow.
$HUI post by Rambus. Looks to me like a pullback to about 160 support would make sense before it moves higher.
http://rambus1.com/2016/04/11/hui-update-264/
Happy trading
http://m.investing.com/analysis/the-true-meaning-of-gold%E2%80%99s-cot-data-200124728
No matter if his theory differs from us but if also we agree with him at point gold is having short term high on cards
Interesting read. Thanks,
Lara, regarding the comments on the previous thread on the gold equities leading gold. Don’t read too much into it.
In my experience it’s a 1-3 day lead max. The recent action could still be completely in accord with your main bearish count.
A typical example of when the lead might be useful is as follows: If gold drops strongly, say $30, and the gold shares are flat to slightly down, this would indicate the share investors don’t believe gold’s down move is sustainable. In Elliott terms, we might be experiencing a C wave down to finish a move. The behaviour of the gold shares tells us it is a C wave and not a wave 3 of a bigger move.
This can be useful, but it’s also important to bear in mind that on a few occasions the shares look to the metal for a lead.
Thank you Johno.
It’s a piece of information I’ll take into account, but not weight too heavily.
I keep coming back to the problem with the correction if it is over as per the alternate daily chart. It is just too brief and too shallow for the first second wave correction within a new trend. They are almost always deep and should be better in proportion to the movement they correct.
Not just from an Elliott wave perspective, but the general look and behaviour of markets.