
A small range day to a slight new high does not clarify which Elliott wave count is correct.
The main Elliott wave count still has a higher probability.
Summary: A new low below 1,243.69 would provide some confidence in the main wave count and reduce the probability of the alternate. Unfortunately, there is no upper confirmation / invalidation point. Use the channel on the hourly chart in the first instance; a break below it would see the probability of the alternate decrease and would indicate a trend change to the downside. The target for this correction to end is still 1,131.
New updates to this analysis are in bold.
Last published weekly chart is here.
MAIN DAILY ELLIOTT WAVE COUNT
Click chart to enlarge.
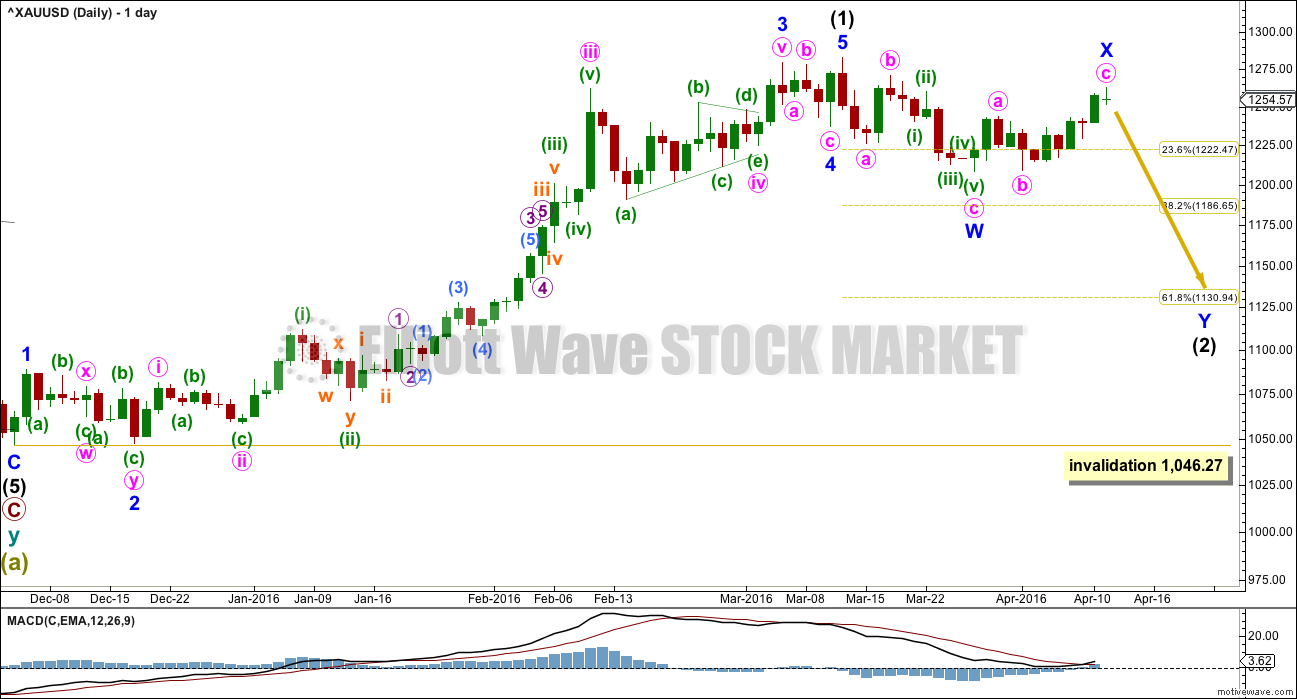
Intermediate wave (1) is a complete impulse. Intermediate wave (2) has begun and is most likely incomplete.
The first movement down within intermediate wave (2) fits as a zigzag.
At this stage, it looks like intermediate wave (2) may be unfolding as a double zigzag. Minor wave X may be a zigzag within the double.
Within double zigzags, the second zigzag exists to deepen the correction when the first zigzag does not move price deep enough. Here, minor wave W ends just below the 0.236 Fibonacci ratio fitting the description of “not deep enough” for a second wave correction. The second zigzag in the double should be expected to deepen the correction; minor wave Y may end about the 0.618 Fibonacci ratio at 1,131.
To achieve the purpose for the second zigzag to deepen the correction the X waves of double zigzags are normally shallow.
Intermediate wave (2) may be a flat correction, if upwards movement continues to 1,275.24. At that stage, upwards movement would be 0.9 of the prior zigzag down, so the structure may be relabelled minor waves A-B with C down to unfold. Within flat corrections, the B wave is most common from 1 to 1.38 times the length of the A wave, so this gives a normal range for minor wave B of 1,282.68 to 1,311.
A new high does not invalidate this main wave count. The most common type of flat is an expanded flat which would require wave B to be 1.05 of wave A or longer. The price point for this would be at 1,286.40.
There is no rule stating a limit for a B wave within a flat nor an X wave within a combination. There is an Elliott wave convention that states when the possible B wave is twice the length of the A wave the probability of a flat unfolding is so low it should be discarded. That price point is at 1,357.04.
This is the risk to the wave count today.
Intermediate wave (2) may not move beyond the start of intermediate wave (1) below 1,046.27.
MAIN HOURLY ELLIOTT WAVE COUNT
Click chart to enlarge.
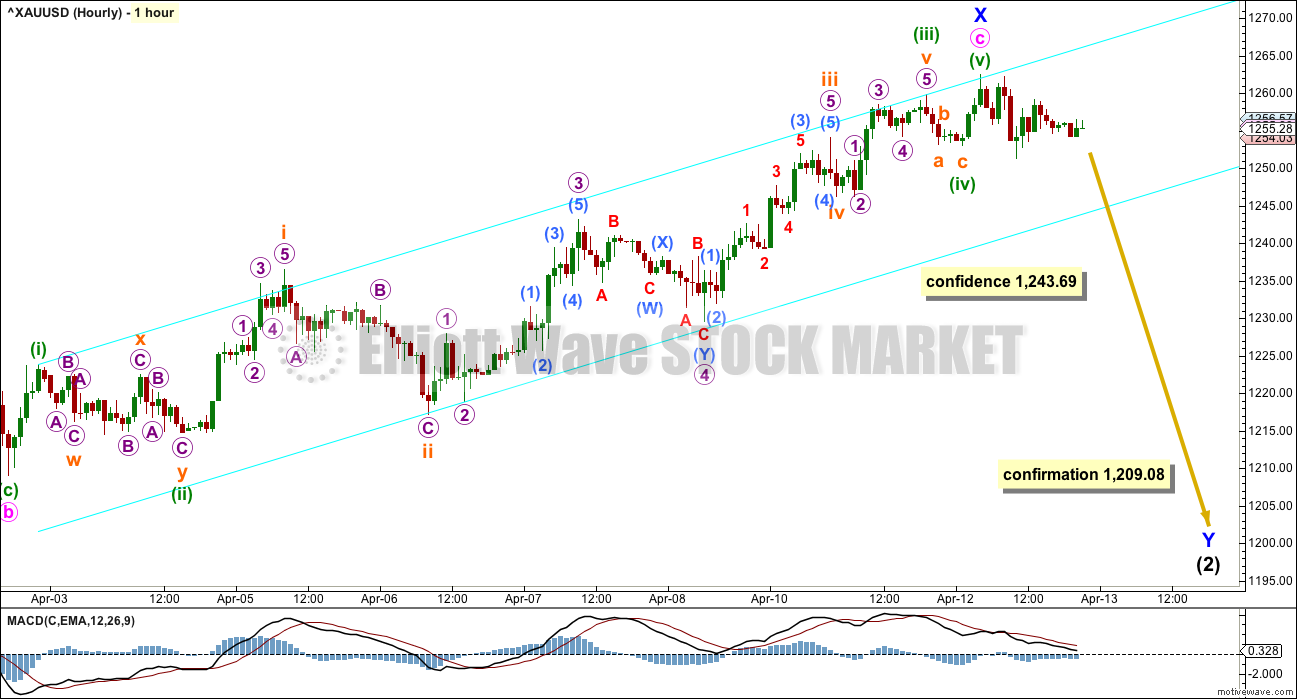
Both hourly charts will look only at upwards movement from the low labelled minute wave b at 1,209.08 on 1st April. Movement prior to that is seen subdividing in the same way for both wave counts: the upwards wave of minute a is seen as a five and the downwards movement of minute wave b is seen as a three. A zigzag subdivides 5-3-5, so the subdivisions are the same as waves 1-2-3 of an impulse.
The upwards wave from the end of minute wave b may be a complete impulse as labelled here, or the final fifth wave up may still be yet to unfold as per labelling on the alternate hourly chart. Both ways to label this impulse work in the same way for both wave counts.
If upwards movement is over here, then minor wave X is less than 0.9 the length of minor wave A, so intermediate wave (2) may be a double zigzag and may not be a flat correction. Minor wave Y may end about the 0.618 Fibonacci ratio at 1,131.
If upwards movement continues and reaches 1,275.24, then the correction would be relabelled minor waves A-B-C and intermediate wave (2) may be a flat correction. At that stage, the probability of a new high would be reasonable. The most common type of flat is an expanded flat where minor wave B would reach 1,286.40 or above. Expanded flats are very common structures.
The earliest indication that this upwards wave may be over would be a clear breach of the best fit cyan trend channel on this hourly chart. Thereafter, if price makes a new low below 1,243.69 some confidence may be had in this wave count. Final confirmation would come with a new low below 1,209.08.
ALTERNATE DAILY ELLIOTT WAVE COUNT
Click chart to enlarge.
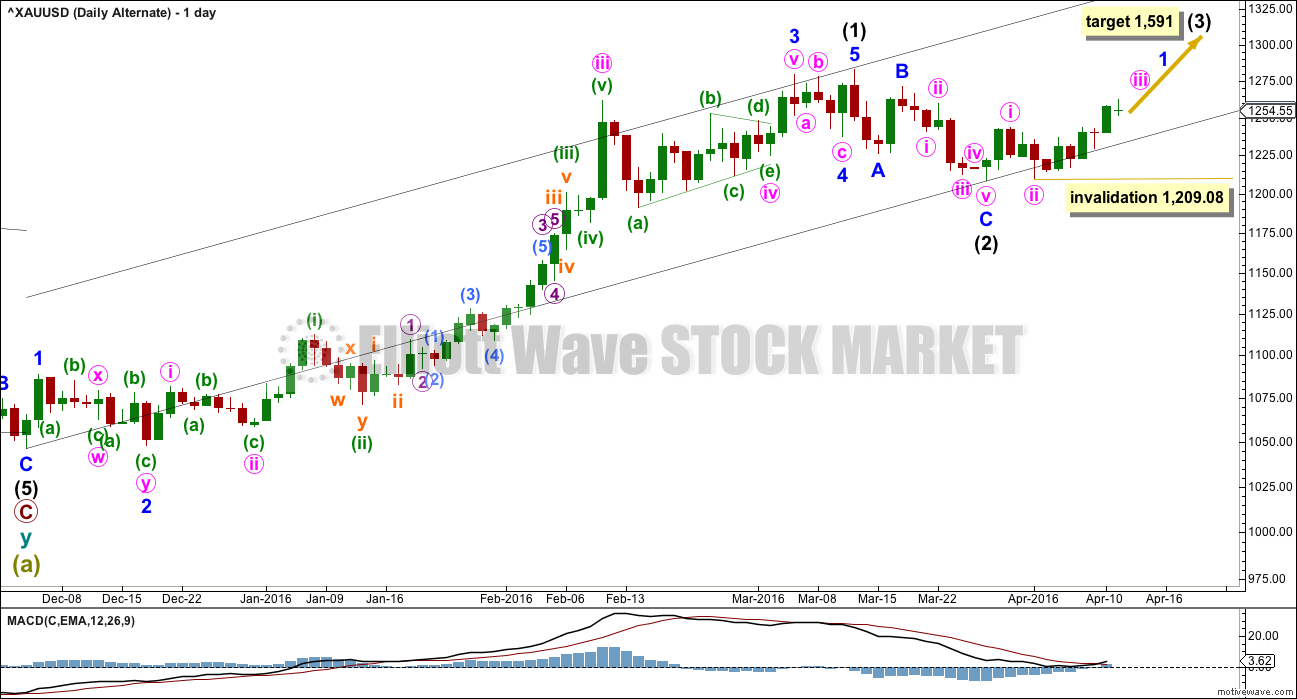
It is technically possible but highly unlikely that intermediate wave (2) is over. This wave count requires confirmation with a five up on the hourly chart for confidence. A new high is not confirmation of this wave count.
If intermediate wave (2) is over, then it is a very brief and shallow 0.31 zigzag lasting only eleven days (intermediate wave (1) lasted 69 days). The probability of this is very low.
At 1,591 intermediate wave (3) would reach 1.618 the length of intermediate wave (1).
Within minute wave iii, no second wave correction may move below the start of its first wave at 1,209.08.
ALTERNATE HOURLY ELLIOTT WAVE COUNT
Click chart to enlarge.
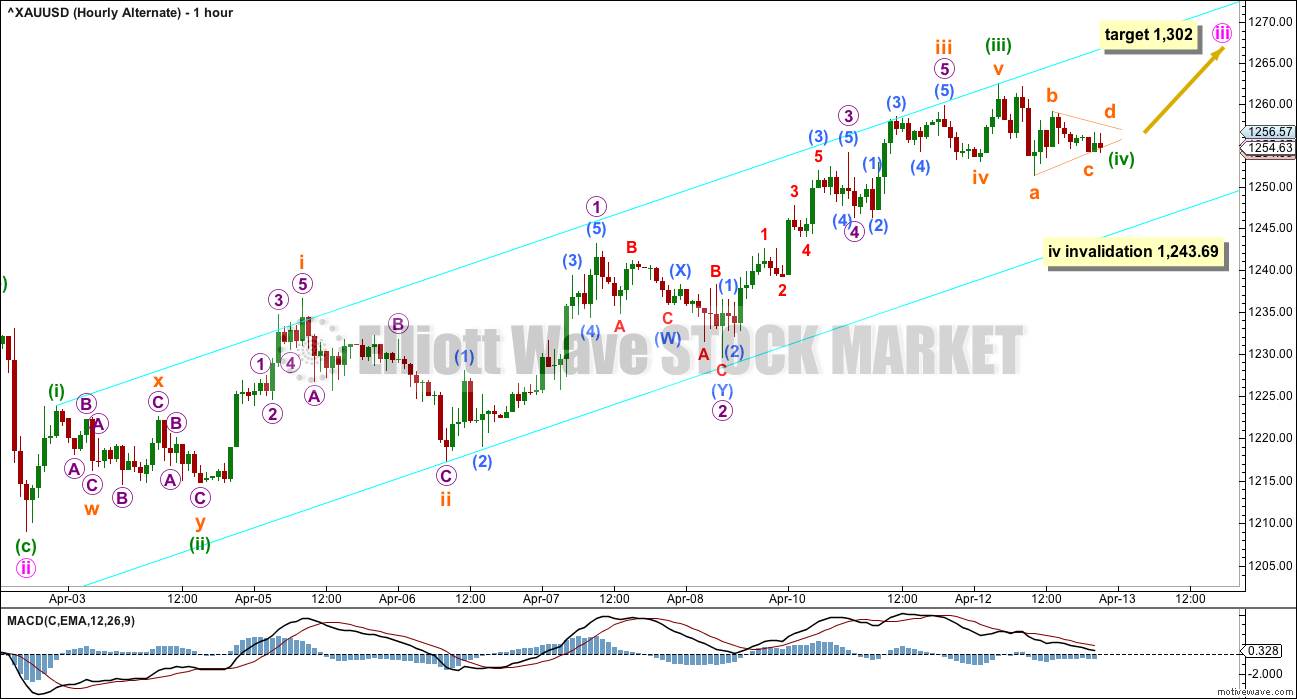
The subdivisions of minute waves i and ii are the same as the main hourly wave count: 5-3.
The two hourly charts published today see this upwards impulse in two different ways. Both ways to label this impulse work in the same way for both wave counts. It may be over as per labelling for the main hourly wave count, or it may need a final fifth wave as per this labelling.
At the time of publication, it looks like a small triangle may be unfolding which may be a fourth wave. This would expect an upwards breakout from the triangle.
At 1,302 minute wave iii would reach 2.618 the length of minute wave i.
When minute wave iii is complete, then the following correction for minute wave iv may not move into minute wave i price territory below 1,243.69.
So far minute wave iii has not shown an increase in momentum beyond that seen for minute wave i. MACD does not support this wave count at this stage.
Gold’s fifth waves out of its fourth wave triangles are often surprisingly short and brief. The target for this wave count may be too optimistic.
Price should remain contained within the best fit channel while minute wave iii is still underway. A breach of the lower edge of the channel would be an early indication that the upwards wave, no matter what it is labelled, is complete and the next wave down has begun.
TECHNICAL ANALYSIS
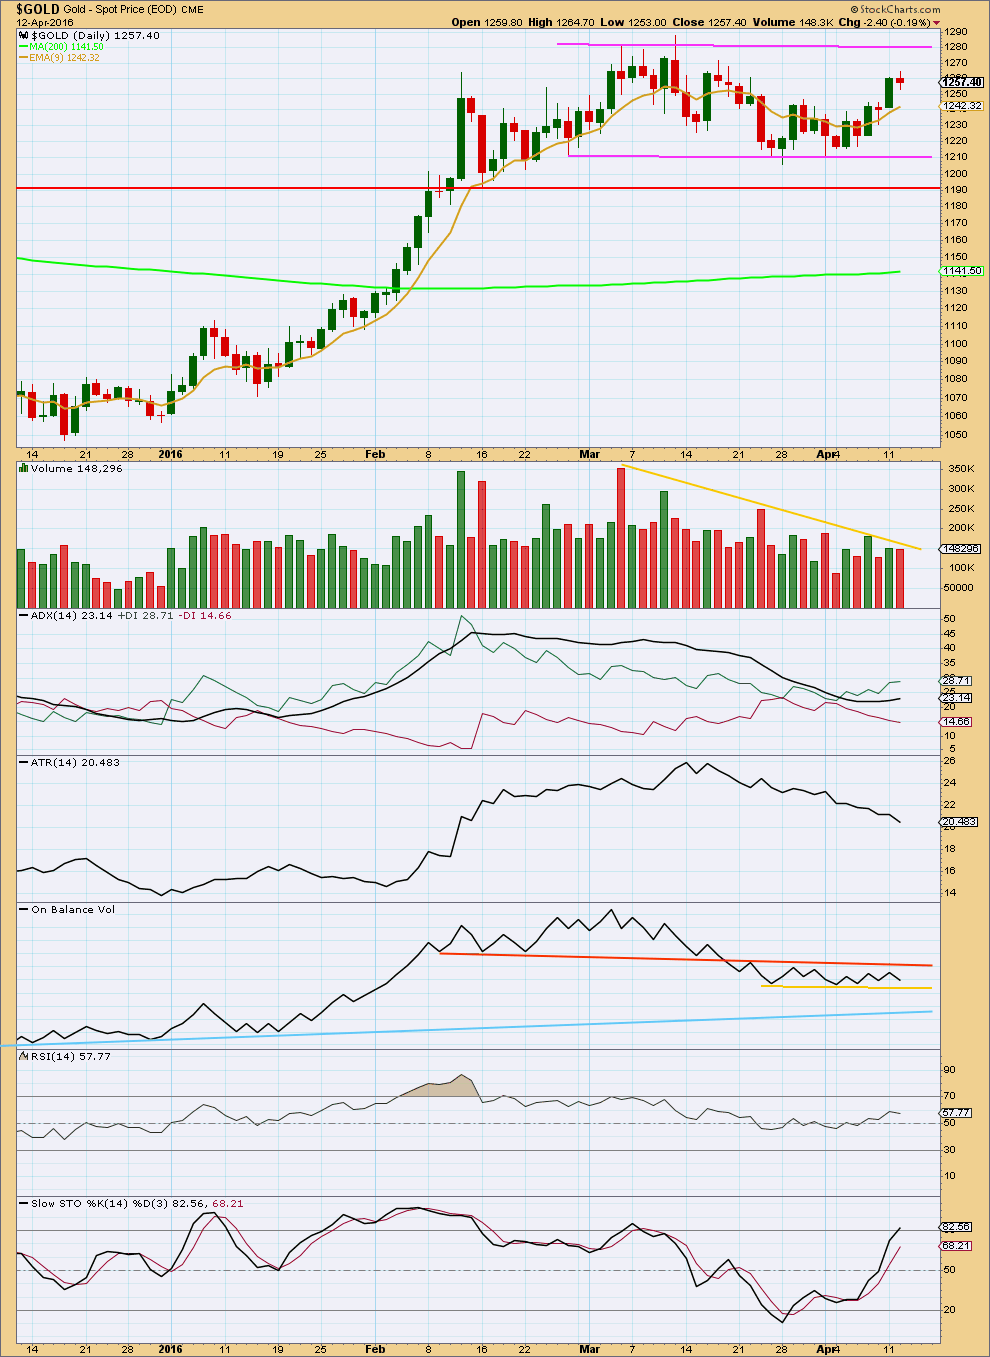
Click chart to enlarge. Chart courtesy of StockCharts.com.
The big questions today: is the current upwards swing a B wave or X wave (they’re essentially the same)? Or the start of a big third wave? Can classic technical analysis shed light on this question?
Volume is declining as price moves higher. Momentum is also declining. These two indicators strongly suggest that for Gold this upwards swing is part of a consolidation, and so more likely to be a B or X wave than the start of a big third wave up.
The only thing that would switch that view to bullish would be a classic upwards breakout. If a strong upwards day closes reasonably above the upper line of resistance about 1,280 on a day with clearly higher volume, then the alternate Elliott wave count would be preferred.
Price is still range bound, moving sideways on declining volume. A range bound approach to this market would expect some more upwards movement to continue from here and to only end when price finds resistance and Stochastics is overbought at the same time. Stochastics is beginning to move into overbought territory, but price has not yet reached resistance. Price would be expected to get closer to 1,280 before the upwards swing should be considered over.
Only the most experienced of traders should be trading a range bound market. If you choose to try and trade this market, then it is essential you use good risk management techniques to protect your account. The risk of losses during a range bound market is greater than during a trending market; price does not move in a straight line from support to resistance and back, and overshoots of support and resistance can occur before price turns for the next swing.
Most of us should step aside, exercise patience, and wait for the next trend to be clear and then join it.
ADX is increasing indicating the market may be trending upwards. But with price still below resistance this indicator comes with a caution; there has not been a breakout yet.
ATR disagrees with ADX, which is another reason to treat this possible upwards trend with caution. Declining ATR indicates consolidation and not trending.
On Balance Volume may lead the way. A break above the orange trend line would be a reasonably strong bullish signal. A break below the yellow trend line would be a bearish signal; reasonable, but weaker than the orange line. A break below the blue line would be a very strong bearish signal.
RSI is neutral. There is plenty of room for price to rise or fall.
This analysis is published @ 10:16 p.m. EST.
Not good to learn about the website attack. Have no kind words for hackers and hope this unique website stays safe. Undoubtedly very nice work (analysis) by Lara staying on track in trying to nail this!… Expecting short term decline from current levels for a break below 1239 before an upside move. Eagerly await Lara’s fresh analysis. Good luck all, its been a pretty bumpby ride so far.
So here’s the message I tried to post before the market closed and couldn’t:
I can see an almost complete five down. I’ll be expecting more downwards movement before any significant retracement. I can’t say how high the retracement will go until the downwards movement is finished.
Today I have more confidence in the main wee count with a new low below 1,243.69.
Confirmation will come with a new low below 1,209.08.
Congratulations on staying on track with this 2nd wave. Appears price has proved you right and I admire your patience. 🙂
Thanks, but not so fast. We don’t have final confirmation yet.
The alternate lives on…
🙁
So sorry everybody, we had an attack on our website today and as part of the response to contain it our web hosting service turned off posting for comments. Including me.
Comments are back on. Lets see if the attack stops…
Lara, unfortunate about the attack. Best wishes for everything to be ok for you.
It is great that your website is accessible again.
I was wondering why I got this message when I tried to access your website.
“You don’t have permission to access /wp-login.php on this server.”
I tried to post a comment and I received a “you don’t have permission to access” message.
And I was logged in as admin. So yeah, something was definitely wrong there.
We have a really awesome web hosting service. They looked after it so well.
Dollar about to score largest daily gain on euro in nearly two months
Apr 13, 2016 9:55 a.m. ET
http://www.marketwatch.com/story/dollar-pushes-higher-along-with-global-stocks-oil-prices-2016-04-13
The US Dollar had a significant impact on gold pricing last night and this morning. Is there a wave count available for the US Dollar. Naturally, should it climb from it’s lows, gold will fall further. Thanks! – Steve K.
http://www.zerohedge.com/news/2016-04-13/according-beige-book-fed-should-be-hiking-rates-now
Maybe this was the “news” Lara and EW-analysis was waiting for?
A rate hike means Dollarstrenght.
The goldmarket fears a ratehike possibly already at the end of this month April.
Personally,I do not believe it.
Untill then Wave Y of Intermediate 2 can develop as Lara sees it.
Any wave count?
Any idea how high back up gold may retrace from overnight drop from yesterday high?
Possible .618 retrace target for gold to move up from yesterday high 1262.76 at 4 am to today low 1239.82 at 6 am is $1,254 just my guess only.
Any comments?
So far I can see 1-2-3-4 down unfolding, with 5 now moving lower.
When 5 is complete then we can figure out a possible retracement target. Can’t do that yet, we don’t know where it ends. I don’t think it’s done.
Lara you gave excellent guidelines for confirming a trend change, two happened, breaching the hourly channel and gold moving below 1,243.69.
Also your retrace target in tonight’s analysis would be great then I’d have a target to buy DUST at. Sort of like a throw back target.
Thursday may be a safer day for me to buy DUST if gold moves back up.
I did make some profit on a trade in NUGT today, but it was tricky.
I thought about buying DUST but missed buying near it’s low.
This looks like it could have an impact on the price of gold. Thoughts?
Lots of chatter that China, on April 19th, will start setting the price of Gold in Yuan out of the Shanghai Physical Only Exchange.
https://goldtadise.com/?p=366774#comments
Gold providing first confidence in the main daily and hourly wave counts.
Dreamer, investing.com use the charting platform of http://www.tradingview.com (nice and free, basic version).
Both gold and US oil are expected to be in int wave (2). AND both have major trend change at the same time.
Lara Wrote this yesterday in Oil report comment section:”In a new trend the first big second wave correction is very commonly deep and in better proportion than that”.
It applies to gold here as well.
I agree that when a major trend happens after a long period of bear trend there will be a deep correction.
Not like 2009 V shape recovery.
Lara, I’ve copied over my comment from the Apr 6th Silver page:
Lara, the daily chart has been invalidated. (XAGUSD @ 16.05 at this writing) Does this mean that “that intermediate wave (2) is over at the low labelled minute wave i”? (and we are now starting intermed. 3) Or is there further structure possible for intermediate 2 on this metal?
Your help much appreciated.
Lara posted this yesterday in the gold comments. It should answer your question.
Lara April 12, 2016 at 3:47 pm
Exactly.
The downwards movement for Silver to the last low subdivides as a three. Which is either minor wave A of a flat, or intermediate (2) in its entirety.
All of Gold, Silver and GDX have essentially the same main and alternate counts for the daily chart.
The main count has to be expecting that the second wave correction is not over so that it ends deeper and longer lasting as second wave corrections normally do and so the wave counts for all on the daily chart have the more typical look.
All three markets have an alternate which must be judged to have a lower probability; the intermediate wave (2) was brief and shallow.
Dreamer, thanks. I had missed her comment on yesterday’s page. Now that Silver daily is invalidated there’s no active chart, but I understand the concept of intermediate (2) going lower. Perhaps morphing like gold into a shallow 2nd wave combination. We’ll see.
Hi Lara,
do you mean invalidation point is at Micro wave iv at 1243, not minute wave iv?
April 11th analysis mentioned micro wave iv invalidation for hourly alternate.
April 12th analysis has minute wave iv invalidation at 1243.69.
“At 1,302 minute wave iii would reach 2.618 the length of minute wave i.
When minute wave iii is complete, then the following correction for minute wave iv may not move into minute wave i price territory below 1,243.69.”
Thank you lara for your best work..
I know you have heavy burden of our expectations..that may sometimes give you sense of over responsibility specially in these tough times…
I want to say thanks to you for creating this platform of EW teachings…and thank you for all the profits i have made from your analysis…God bless you by more n more of knowledge…
Takecare