
A new low below 1,243.69 has provided some confidence in the main Elliott wave count.
The alternate Elliott wave count remains valid.
Summary: A new low below 1,209.08 would confirm the main wave count and invalidate the alternate. Unfortunately, there is no upper confirmation / invalidation point. The target for this correction to end is still 1,131, which may be reached in about two weeks. The market is still range bound and the main wave count may still change in terms of short term expectations; there are still at least three structural options open for intermediate wave (2).
New updates to this analysis are in bold.
Last published weekly chart is here.
MAIN DAILY ELLIOTT WAVE COUNT
Click chart to enlarge.
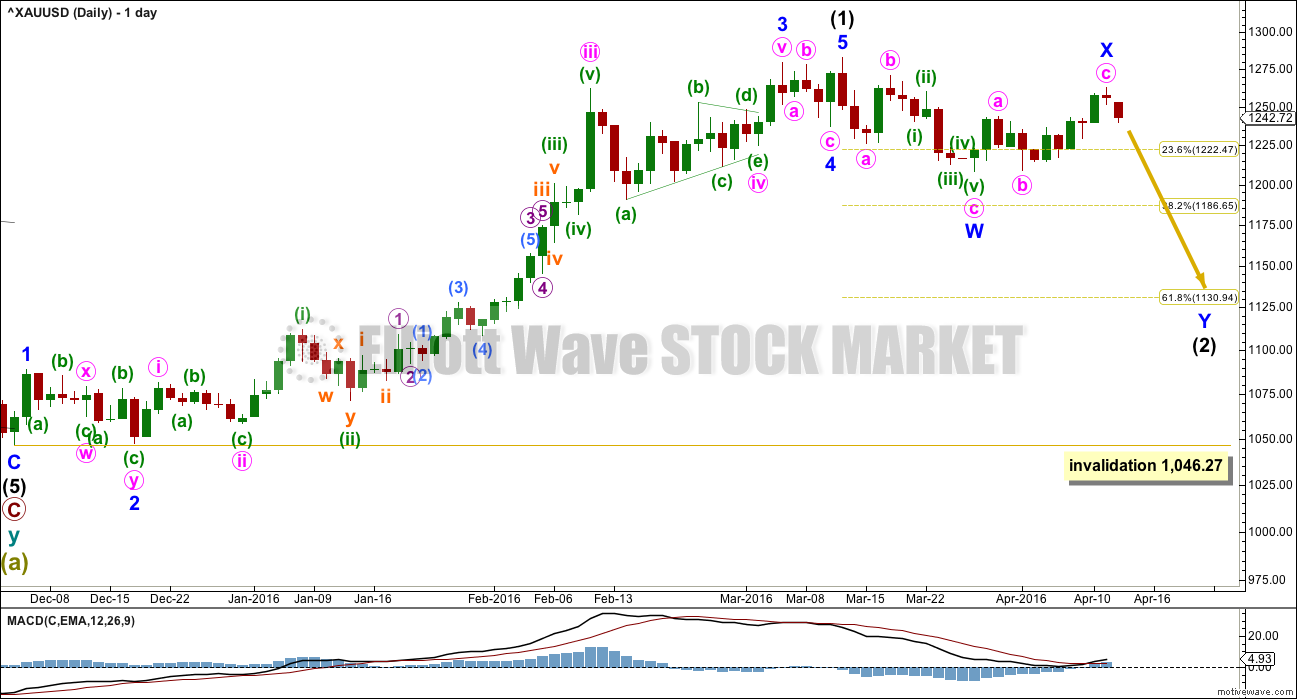
Intermediate wave (1) is a complete impulse. Intermediate wave (2) has begun and is most likely incomplete.
The first movement down within intermediate wave (2) fits as a zigzag.
At this stage, it looks like intermediate wave (2) may be unfolding as a double zigzag. Minor wave X may be a zigzag within the double.
Within double zigzags, the second zigzag exists to deepen the correction when the first zigzag does not move price deep enough. Here, minor wave W ends just below the 0.236 Fibonacci ratio fitting the description of “not deep enough” for a second wave correction. The second zigzag in the double should be expected to deepen the correction; minor wave Y may end about the 0.618 Fibonacci ratio at 1,131.
To achieve the purpose for the second zigzag to deepen the correction the X waves of double zigzags are normally shallow.
Intermediate wave (2) may be still be a flat correction, if upwards movement continues to 1,275.24. At that stage, upwards movement would be 0.9 of the prior zigzag down, so the structure may be relabelled minor waves A-B with C down to unfold. Within flat corrections, the B wave is most commonly from 1 to 1.38 times the length of the A wave, so this gives a normal range for minor wave B of 1,282.68 to 1,311. There is a risk that upwards movement is not over while price remains above 1,209.08.
A new high does not invalidate this main wave count. The most common type of flat is an expanded flat which would require wave B to be 1.05 of wave A or longer. The price point for this would be at 1,286.40.
There is no rule stating a limit for a B wave within a flat nor an X wave within a combination. There is an Elliott wave convention that states when the possible B wave is twice the length of the A wave the probability of a flat unfolding is so low it should be discarded. That price point is at 1,357.04.
This is the risk to the wave count today.
Intermediate wave (2) may not move beyond the start of intermediate wave (1) below 1,046.27.
MAIN HOURLY ELLIOTT WAVE COUNT
Click chart to enlarge.
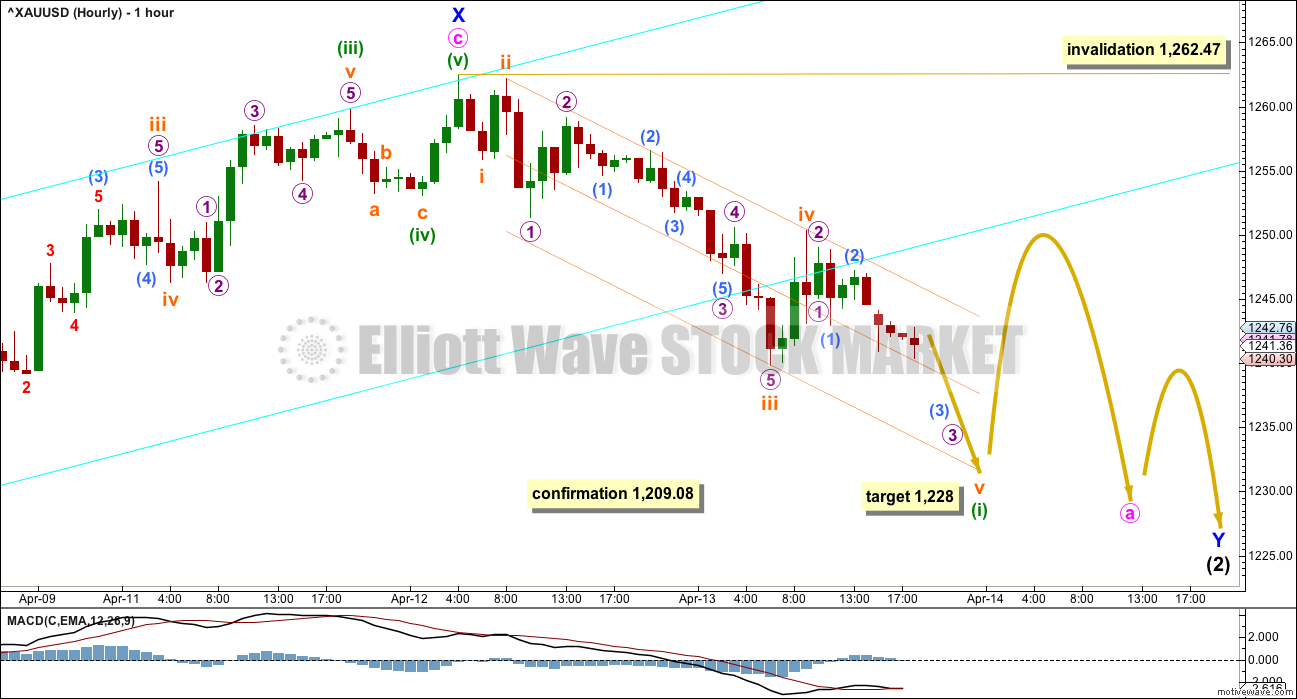
Both hourly charts will look at upwards movement from the last high. Movement prior to that is seen subdividing in the same way for both wave counts.
The breach of the best fit cyan channel indicates that the last wave up labelled minute wave c is a complete structure, which looks like and subdivides as a five. For this wave count, the last wave up is seen as wave c of a zigzag for minor wave X.
If upwards movement is over here, then minor wave X is less than 0.9 the length of minor wave W, so intermediate wave (2) may be a double zigzag and may not be a flat correction. Minor wave Y may end about the 0.618 Fibonacci ratio at 1,131.
If upwards movement continues and reaches 1,275.24, then the correction would be relabelled minor waves A-B-C and intermediate wave (2) may be a flat correction. At that stage, the probability of a new high would be reasonable. The most common type of flat is an expanded flat where minor wave B would reach 1,286.40 or above. Expanded flats are very common structures. It remains possible that upwards movement could yet continue while price remains above 1,209.08; the wave count is not yet confirmed. It looks unlikely that upwards movement will continue today, but that does not mean it cannot.
Minor wave Y is most likely to subdivide as a zigzag, so that intermediate wave (2) is a double zigzag which would allow it to reach down to the 0.618 Fibonacci ratio, a common point for second wave corrections particularly the fist big second wave of a new trend.
Minor wave Y may also be a flat or triangle, if intermediate wave (2) is unfolding as a combination. This has a fairly low probability although it is possible. If this turns out to be the case, what it means is the labelling will change at the hourly chart level and the target at 1,131 would be too low. Combinations are sideways movements. To achieve this the second structure in the double ends close to the same level as the first, so minor wave Y would end only about 1,208.32.
So far it looks like an impulse downwards is unfolding. There is no Fibonacci ratio between subminuette waves i and iii. This makes it more likely that subminuette wave v will exhibit a Fibonacci ratio to either of i or iii. Because subminuette wave v has begun with some overlapping it looks like it may be extending. At 1,228 subminuette wave v would reach equality in length with subminuette wave i.
Draw a channel about the new downwards movement using Elliott’s second technique: draw the first trend line from the ends of the second and fourth waves, then place a parallel copy on the end of the third wave. Add a midline to show where price is currently finding support. Expect the fifth wave to end about the lower edge of the channel. When the channel is breached by subsequent upwards movement, it would be indicating that minuette wave (i) is over and minuette wave (ii) has arrived.
When minuette wave (i) is a complete impulse, then draw a Fibonacci retracement along the length of minuette wave (i). Use the 0.382 and 0.618 Fibonacci levels as targets, slightly favouring the 0.618 Fibonacci ratio.
Minuette wave (ii) may not move beyond the start of minuette wave (i) above 1,262.47.
ALTERNATE DAILY ELLIOTT WAVE COUNT
Click chart to enlarge.
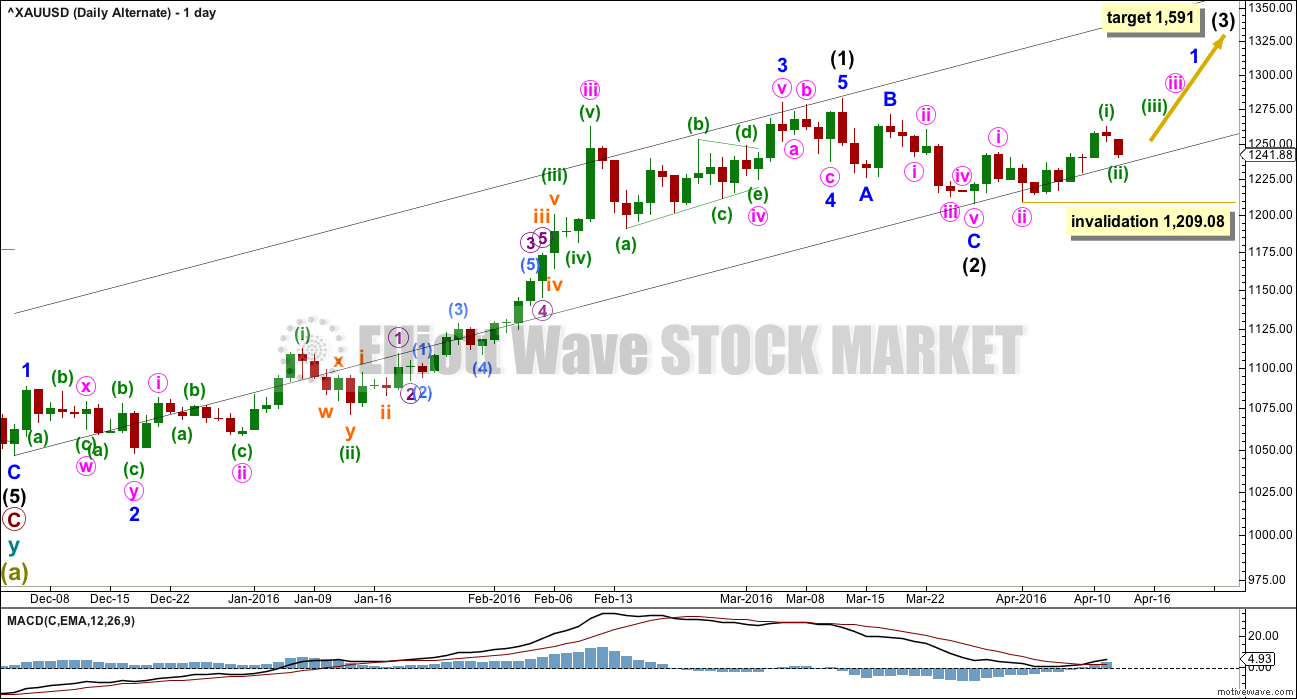
It is technically possible but highly unlikely that intermediate wave (2) is over. This wave count requires confirmation with a five up on the hourly chart for confidence. A new high is not confirmation of this wave count.
If intermediate wave (2) is over, then it is a very brief and shallow 0.31 zigzag lasting only eleven days (intermediate wave (1) lasted 69 days). The probability of this is very low.
At 1,591 intermediate wave (3) would reach 1.618 the length of intermediate wave (1).
Minuette wave (ii) may not move beyond the start of minuette wave (i) at 1,209.08.
ALTERNATE HOURLY ELLIOTT WAVE COUNT
Click chart to enlarge.
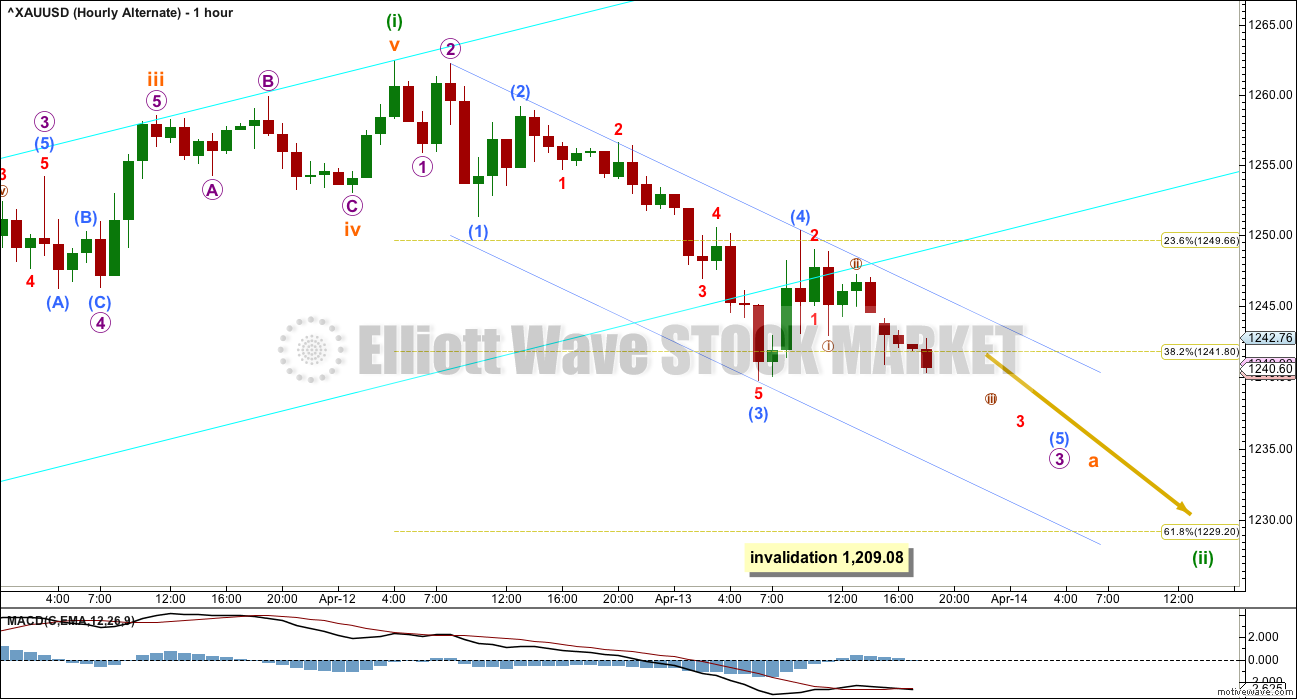
The upwards wave labelled minuette wave (i) is now seen in the same way as per the main wave count; here, a completed impulse for a first wave.
The degree of labelling within minute wave iii is moved down one degree today. Downwards movement may not be minute wave iv because it is back in minute wave i price territory. This means minute wave iii cannot be over for this wave count, so only the first wave within it may be over.
Minuette wave (ii) is most likely to be a zigzag and most likely to end about the 0.618 Fibonacci ratio of minuette wave (i) at 1,229. So far the structure is incomplete.
Minuette wave (ii) may not move beyond the start of minuette wave (i) below 1,209.08.
When minuette wave (ii) is a complete zigzag, then a third wave within a third wave upwards would be expected for this wave count. At that stage, this wave count would require strong upwards movement to show a clear increase in momentum. If this alternate wave count is correct, we should know within about three trading days.
TECHNICAL ANALYSIS
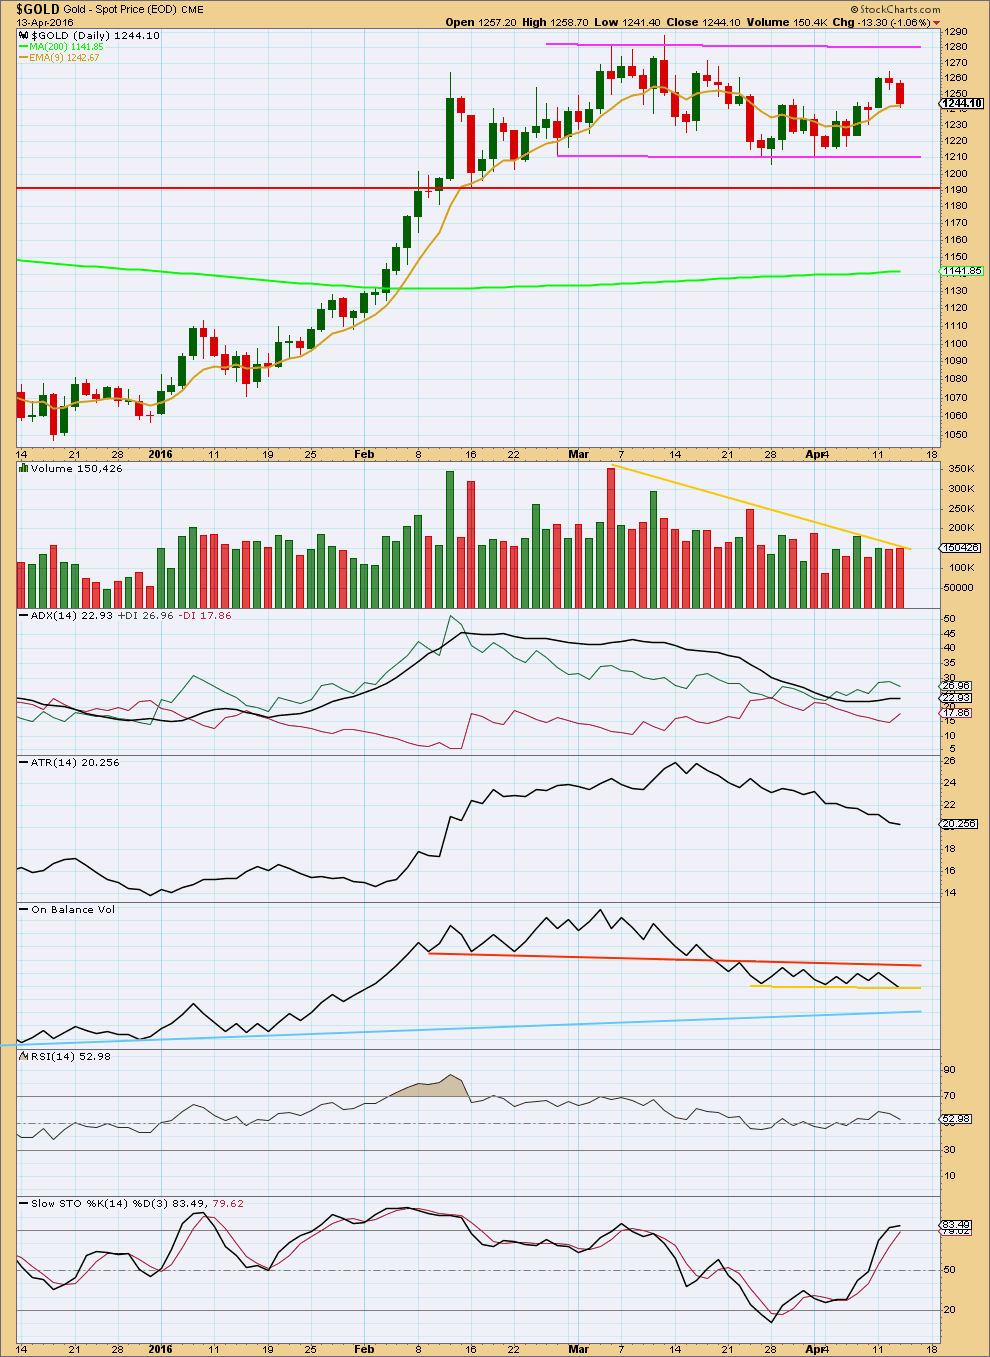
Click chart to enlarge. Chart courtesy of StockCharts.com.
A downwards day with a slight increase in volume offers some support for the lower movement from price. Volume is still light; as price moves overall sideways within a range, volume continues to decline overall. This is typical of a consolidation.
It is still a downwards day which has strongest volume during this consolidation. This indicates a downwards breakout is more likely than upwards.
A range bound approach to this market would expect price to swing from support to resistance and back again, assisted by Stochastics to indicate where each swing may end. At this stage, price has not quite reached resistance and Stochastics has not quite reached overbought. A little more upwards movement would be expected to continue until they do.
There is a great risk to trying to trade a range bound / consolidating market. Price does not move in a straight line from support to resistance and back again, and it may overshoot support or resistance before turning. Trading a range bound market should be done only by the most experienced traders. The rest of us should exercise patience, stand back, and wait for a breakout and the next trend to emerge before we join it.
ADX has been declining and now is flat, indicating no clear trend is in place. ATR agrees as it too is declining. It looks clear today; the market is not trending.
On Balance Volume may indicate the breakout direction for price. If OBV breaks below the lower yellow line, it would be a reasonable bearish indicator. A break below the light blue line would be a strong bearish indicator. A break above the orange line would be a strong bullish indicator. For the alternate wave count to be taken seriously, it needs some bullish indication from OBV.
This analysis is published @ 08:44 p.m. EST.
Lara
Is the 24 hours how long minuette wave (iv) will take or 24 hours from your chart time of 4 pm gold may have ended the top of minuette wave (iv)?
“Then minuette (iv) upwards should be a deep correction, but over within 24 hours so not too time consuming.”
Lara are we expecting a wave up here? I, am, and have covered my shorts of two days ago and am lightly long at the moment . Where do you put us in E.Wave land. Best Stephen C. New London Ct. (where Spring is finally breaking through , on my 31st birthday,after deducting 50 years.)
Wow happy bday. More power to ya!!
Thanks Babe.
Happy birthday Stephen!
I will be expecting minuette (iii) downwards to end first, and the fifth wave down within it could be quite strong.
Then minuette (iv) upwards should be a deep correction, but over within 24 hours so not too time consuming. At that stage the invalidation point will be moved down to 1,229.17.
Overall I’m expecting downwards movement with corrections up along the way to find resistance at the trend channel on the chart I posted below.
A chart is better isn’t it.
Possible targets for minuette (iii):
1,211 minuette (iii) = minuette (i)
or
1,190 minuette (iii) = 1.618 X minuette (i).
The first target in this instance looks more likely. But if price falls through it then the second target will be used.
Minuette (ii) is over. It was relatively shallow, correcting to just over the 0.382 Fibonacci ratio.
This downwards move is the start of minuette (iii).
Within minuette (iii) subminuette i is almost complete. Subminuette ii may offer another opportunity to join the trend. Use a trend line: from the high of minor X to the high of minuette (ii). This is the upper edge of a base channel about this downwards impulse. Each time price comes up to touch the upper edge it is likely to find strong resistance there and offer a good entry point.
If that channel is breached to the downside then the lower edge may provide resistance for a throwback. When the middle of the third wave arrives it should breach the lower edge of the channel.
But a warning: price is still within a consolidation. Only experienced traders should be trading a consolidation. The risk of loss to your account is greater than during a trending market. If you do choose to have a go then MANAGE RISK CAREFULLY do not invest any more than 2-3% of your equity on any one trade.
Because the upper edge of the base channel should provide resistance stops can be set just above it. But this involves the risk that price can overshoot the channel, close out your position for a loss, and then turn back down.
The EW invalidation point is a better place but means stops are further away. So reduce position size to manage risk. The EW invalidation point on the hourly chart can now be at the end of minuette (ii) at 1,243.90. Stops can be set just above this point.
This is assuming the wave count is right. Sometimes I’m wrong. Which is why you need to manage risk. Use stops and keep position size manageable.
We’re still within a correction. The structure is still open; this may be one of three structures downwards; a zigzag for minor Y, a flat for a double combination or a triangle for a double combination. The target at 1,131 may not be met.
3:44 pm gold this minute is making a new low for the day 1223.91
If we consider minutte 2 over…than its hard to see it in hourly chart..thers no proper 3 on hourly chart
From what I see, we are in Minute A down, starting from 1262.76. Minuette 1 = 1229.08, Minuette 2 = 1244.26. Currently dropping in Minuette 3. The good drop was subminuette 1 which could have ended at 1224.35 about 30 minutes ago. Got some respectable gains from DUST for this subwave. A retrace up to probably 1236 and we are good again, continuing on the way down.
Apologies, couldn’t post a chart as I explained in Oil. I don’t have any annotating software.
Alan, excellent count, thank you. Good to hear you already got DUST profits.
I’ll look to buy DUST back up in the 1236 area at the top of subminuette 2.
Thanks Richard. There could be a chance that the retrace can be shallower due to the strong downward pull of the third wave. I am watching 1228 thereabouts (0.236 Fib) followed by 1232 (0.382 Fib).
The drop after the retrace will be the third of a third.
Alan, I hope gold is back up Friday at the open to buy some DUST for the drop down.
I wonder if Lara bought any short for gold at the overnight throwback move up?
No 🙁 I was fast asleep
My time zone is not friendly for this market
Yep. Thats exactly how I see it too.
Gold retraced towards 1244 and now back down…so that retracement was wave 2 or wave 2 is still pending…??…lara said that a doji or a green candle is what will be shown on the daily chart…
I think strong wave 3 might made wave 2 shallow and small…
Any comments plss
Shahab
Please would you let us know when to back up the truck and load up with miners.
May be when gold is below $1200-1180????
I will wait till the daily TSI (25,13,7) crosses on nugt and will let you know.
Great.
Is the low of 1224.45 at 12:20 pm the bottom of minute a”?
How do we determine when it bottomed today so we can buy for the b wave up to sell there?
Or might it drop to the 1210 resistance area to end minute a?
Lara has SPX target at 2126 from several weeks ago.
If SPX closes above 2134 than a new super bull market begins where SPX may reach 2900.
miners will be on sale in a couple of weeks, need to sell the house, the kids, the wife, the dog and the minivan
:))
Buy a truck so you can load it up with discount miners.
In my local surf store which is close to the primary school, the kids hang out there after school. The owner is really chill and funny.
He has a sign in his store:
“Unaccompanied children will be sold as slaves”.
Always makes me laugh.
11:26am Dow industrials break out, S&P 500 rattles the cage on major resistance
http://www.marketwatch.com/story/dow-industrials-break-out-sp-500-rattles-the-cage-on-major-resistance-2016-04-14
Gold crashed right now down to 1225.68 at 11:45 am.
Does gold move up to 1240 area now then back down?
Is gold about to do another move up right now?
Any wave counts?
This morning low of 1229.43 at 11:01 am was that minute a”?
Does gold not make a new low here and go back up, or go lower a little first?
Last night low of 1229.08 at 9:32 pm was subminuette v.
Gold already went up last night to 1244.26 at 4:12 am.
Was that the completion of Lara’s targets for minuette (ii) of either 1242 or more likely 1250?
Lara, would really like your opinion about the affect, if any, this may have on the gold price. Thanks,
http://www.reuters.com/article/china-gold-fix-idUSL3N17G2W4
I expect it may introduce more volatility into Gold prices.
I expect that may be the case because the CCP pricing of assets, and unreliability of publicly published numbers (their growth rate for example is inflated) may introduce an element of uncertainty to Gold price.
If they float their currency and allow their citizens to actively trade in international markets… then I’d expect Gold prices to be very volatile. But I don’t think they’ll do that, they may prefer more control over their currency flows.
I don’t think it will necessarily push Gold up or down though.
Great. Thanks,
Lara is the dreadful, complicated ‘B’ wave over now?
Do you mean minor X?
Highly likely to be over.
It can’t be minor B because it is less than 0.9 of minor W.
Minuette (i) may now be complete. The structure looks complete on the five minute chart, and it has swift shallow fourth waves ending with a fifth wave spike to the low.
Now expecting a correction upwards for minuette (ii) to either the 0.382 Fibonacci ratio at 1,242 or more likely the 0.618 Fibonacci ratio at 1,250.
This may result in a daily green candlestick or doji.
I will be waiting until there is enough structure within minuette (ii) to draw a channel about it. Then I will wait for a channel breach. Then I will wait to enter short on a throwback.
Minuette (ii) target either $1,242 or more likely $1,250.
Lara, you are very helpful, thanks.
Thanks Lara, this is very helpful.
When gold was at $1,131 on February 3rd are on the way up DUST was at $11.
However the reverse sequence in gold may not give the reverse results in DUST.
Any idea what DUST might be when gold reached $1,131 again?
The best way to estimate a target for DUST is to calculate a target for GDX like you did below for gold.
Once you get the GDX target, calculate the % to get to that target. Let’s just say the GDX target calculates to a 20% retrace. Then multiply that 20% by 3 = 60%. So you could expect DUST to rise maybe 50+ % if GDX hits your retrace target.
The reason I say only 50+% is you need to allow for a little decay with the 3x leveraged etf’s like DUST. Hope this helps.
Lara, after intermediate wave (2) target $1,131 area, might the target for intermediate wave (3) be the same as for the daily alternate at $1,591?
“Daily Alternate – At 1,591 intermediate wave (3) would reach 1.618 the length of intermediate wave (1).”
Probably not.
I cannot hazard a guess for intermediate (3) until I know intermediate (2) has ended.
Thanks.
My calculation of the drop from the high of 1284.71 March 8th drop down to the bottom of intermediate wave (2) in about 2 weeks.
We will only know for sure when that happens perhaps in about 2 weeks.
The intermediate wave (1) went from the gold bottom low of 1,046.38 on December 3rd all the way up to the high of 1,284.71 on March 11th.
Fibonacci ratios retracements are often 61.8%.
Here’s my quick math on wave (1) down to bottom of wave (2).
1,284.71
– 1,046.38
= 238.33
x .618
= 147.29 length of wave (2)
1,284.71
– 147.29
= 1,137.42 my retracement target of a possible 61.8% drop.
Lara’s Elliott Wave analysis target for wave (2) is
Minor wave Y to the bottom of intermediate wave (2) may end about the 0.618 Fibonacci ratio at 1,131.
The target for this correction to end is still 1,131, which may be reached in about two weeks.
I get the same answer.
Figures from the COMEX data I’m using:
Intermediate (1) from 1,046.27 to 1,282.68 is 236.41 in length.
236.41 X 0.618 = 146.10
1282.68 – 146.10 = 1,136.58.
The problem is when the daily chart is on a semi log scale Motive Wave adjusts the Fibonacci ratios to semi log.
I don’t like it. I would prefer it to be arithmetic.
But daily charts shouldn’t be viewed on an arithmetic scale.
Because corrections very rarely end right on Fibonacci levels I’m not too concerned about it. But it is annoying.
Thanks a lot Lara.
Either $1,131 or 1,136.58 they are both in a beautiful area to load up on miners or 3X for the trip back up even higher.
Well it was a really nice pop in the miners, but they are now looking overbought. It was a nice run!