
The main Elliott wave count expected a small bounce to be followed by more downwards movement.
The bounce was longer lasting and a little deeper than expected. This changes the wave count short term but not mid term.
Summary: A new low below 1,209.08 would confirm the main wave count and invalidate the alternate. Unfortunately, there is no upper confirmation / invalidation point. The target for this correction to end is still 1,131, which may be reached in about two weeks. The market is still range bound and the main wave count may still change in terms of short term expectations; there are still at least three structural options open for intermediate wave (2). In the short term, a second wave correction may end about 1,239 or 1,248 on Monday. Thereafter, more downwards movement should continue.
New updates to this analysis are in bold.
Last published weekly chart is here.
MAIN DAILY ELLIOTT WAVE COUNT
Click chart to enlarge.
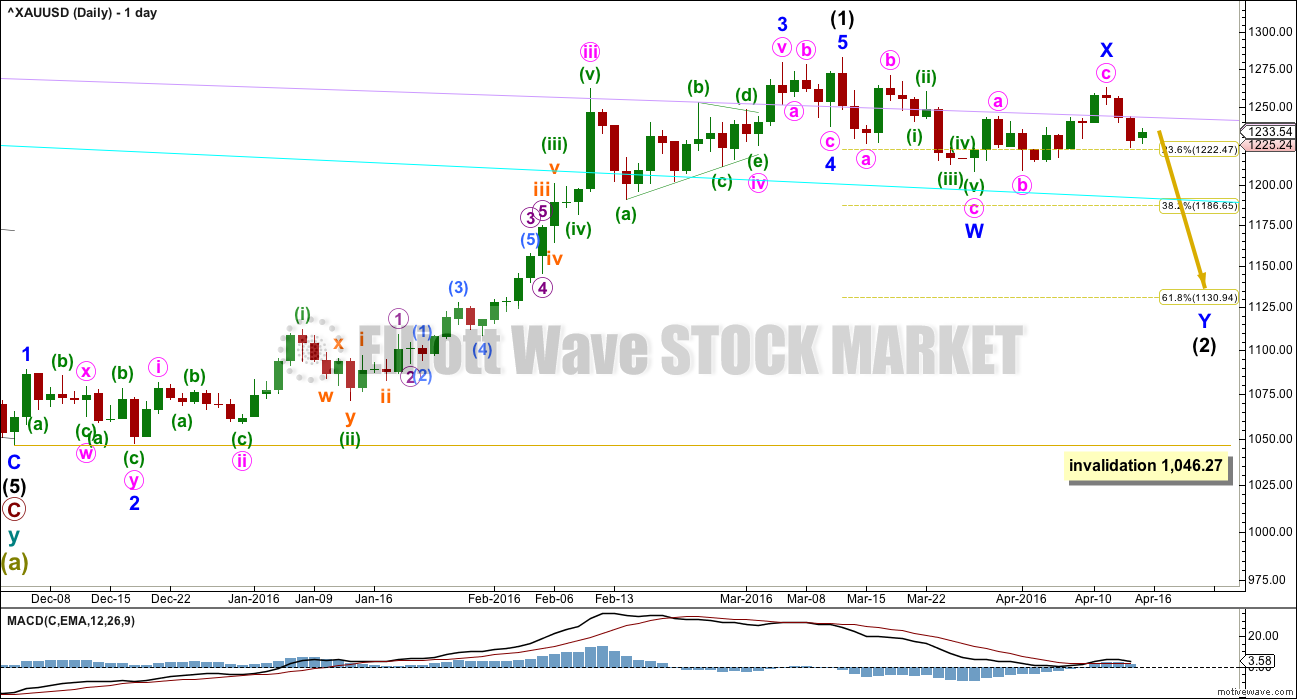
Intermediate wave (1) is a complete impulse. Intermediate wave (2) has begun and is most likely incomplete.
The first movement down within intermediate wave (2) fits as a zigzag.
At this stage, it looks like intermediate wave (2) may be unfolding as a double zigzag. Minor wave X may be a zigzag within the double.
Within double zigzags, the second zigzag exists to deepen the correction when the first zigzag does not move price deep enough. Here, minor wave W ends just below the 0.236 Fibonacci ratio fitting the description of “not deep enough” for a second wave correction. The second zigzag in the double should be expected to deepen the correction; minor wave Y may end about the 0.618 Fibonacci ratio at 1,131.
To achieve the purpose for the second zigzag to deepen the correction the X waves of double zigzags are normally shallow.
Intermediate wave (2) may be still be a flat correction although today this looks highly unlikely. If upwards movement continues to 1,275.24. At that stage, upwards movement would be 0.9 of the prior zigzag down, so the structure may be relabelled minor waves A-B with C down to unfold. Within flat corrections, the B wave is most commonly from 1 to 1.38 times the length of the A wave, so this gives a normal range for minor wave B of 1,282.68 to 1,311. There is a risk that upwards movement is not over while price remains above 1,209.08.
A new high does not invalidate this main wave count. The most common type of flat is an expanded flat which would require wave B to be 1.05 of wave A or longer. The price point for this would be at 1,286.40.
There is no rule stating a limit for a B wave within a flat nor an X wave within a combination. There is an Elliott wave convention that states when the possible B wave is twice the length of the A wave the probability of a flat unfolding is so low it should be discarded. That price point is at 1,357.04.
This is the risk to the wave count today.
Intermediate wave (2) may not move beyond the start of intermediate wave (1) below 1,046.27.
MAIN HOURLY ELLIOTT WAVE COUNT
Click chart to enlarge.
Both hourly charts will look at movement from the last high. Movement prior to that is seen subdividing in the same way for both wave counts.
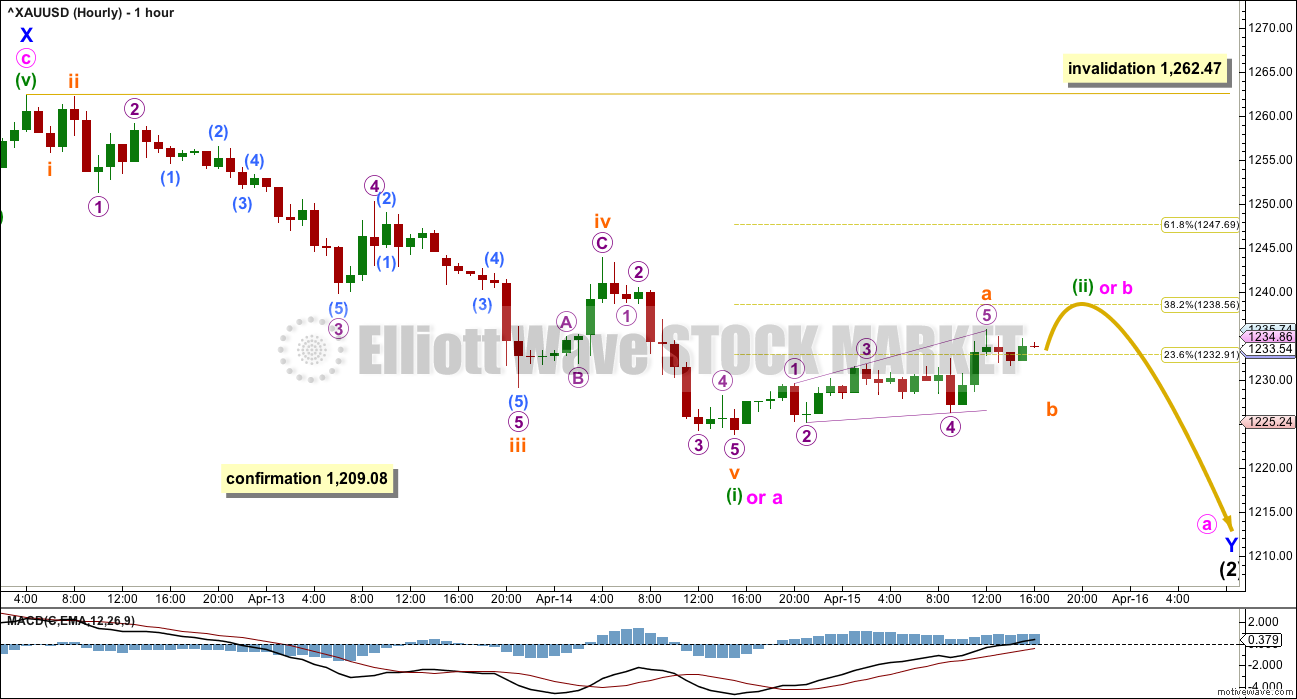
Intermediate wave (2) is incomplete and should still move lower. It may be either a double zigzag (more likely) or a double combination (less likely). This first hourly chart should be used until invalidated. This first hourly chart looks at intermediate wave (2) as a double zigzag.
A double zigzag should have a clear downwards slope and would most likely end about the 0.618 Fibonacci ratio at 1,131. Minor wave Y would be a zigzag which should subdivide 5-3-5.
Last analysis of downwards movement now looks wrong. Minuette wave (i) may have ended at the last low as an impulse. This may also be minute wave a.
Ratios within minuette wave (i) (or minute wave a) are: there is no Fibonacci ratio between subminuette waves i and iii, and subminuette wave v is just 0.29 short of 0.618 the length of subminuette wave iii.
Ratios within subminuette wave iii are: micro wave 3 is 1.80 longer than 1.618 the length of micro wave 1, and micro wave 5 is 1.8 longer than equality in length with micro wave 3.
For both ideas, because minuette wave (i) or minute wave a would most likely be a five wave structure, minuette wave (ii) or minute wave b may not move beyond the start of it above 1,262.47.
Minuette wave (ii) or minute wave b may end about either the 0.382 or 0.618 Fibonacci ratios of minuette wave (i) or minute wave a. This gives two targets of 1,239 or 1,248.
When the correction is done, then a channel may be drawn about it. When the channel about minuette wave (ii) or minute wave b is breached by downwards movement, that would be the earliest indication that the correction is over and the short term downwards trend should have resumed.
ALTERNATE HOURLY ELLIOTT WAVE COUNT
Click chart to enlarge.
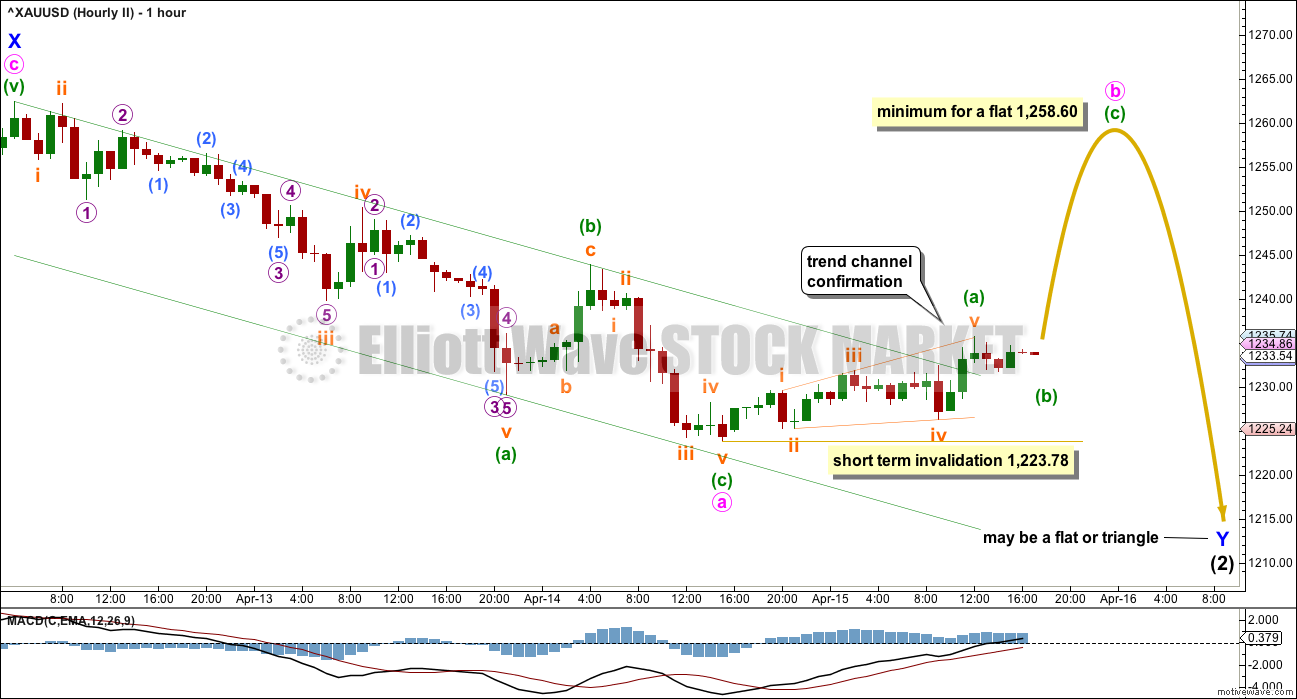
This alternate hourly wave count looks at a possible double combination for intermediate wave (2).
A double combination should have a sideways look, so the second structure in the double should end about the same level as the first. Minor wave W ended at 1,208.32. The second structure in a double combination would be either a flat or triangle for minor wave Y.
Because this would see intermediate wave (2) much more shallow than second wave corrections commonly are, particularly the first big second wave correction of a new trend, this possibility has a very low probability. But it is possible, so that is the risk to trying to trade this correction at this stage.
So far there is a 5-3-5 downwards complete. This downwards wave is now seen in two different ways for these two wave counts; it is impossible to tell with certainty which labelling is correct, so both must be considered.
Within this possible zigzag, minuette wave (c) is 0.46 short of 0.618 the length of minuette wave (a).
Ratios within minuette wave (a) are: there is no Fibonacci ratio between subminuette waves i and iii, and subminuette wave v is 1.22 short of equality in length with subminuette wave iii.
If minor wave Y is to be a flat or triangle, then minute wave a within it should be a three wave structure. It may now be a complete zigzag.
If minor wave Y is to be a flat correction, then minute wave b within it must make a minimum 0.9 retracement of minute wave a and so must reach to 1,258.60 or above. The normal range for a b wave within a flat is from 1 to 1.38 times the length of the a wave, which gives a normal range for minute wave b of 1,262.47 to 1,277.17. A new high would not invalidate this wave count.
If minor wave Y is to be a triangle, then there is no minimum requirement for minute wave b within it. Minute wave b must be a corrective structure, most likely a zigzag.
Minor wave Y would overall be a choppy overlapping sideways movement to last about two weeks, ending close to 1,208.32.
This alternate wave count today illustrates the risk in trying to trade during this consolidating market. Because there are multiple corrective structures (as compared with just two motive structures), the number of possibilities is too great for certainty during a correction.
ALTERNATE DAILY ELLIOTT WAVE COUNT
Click chart to enlarge.
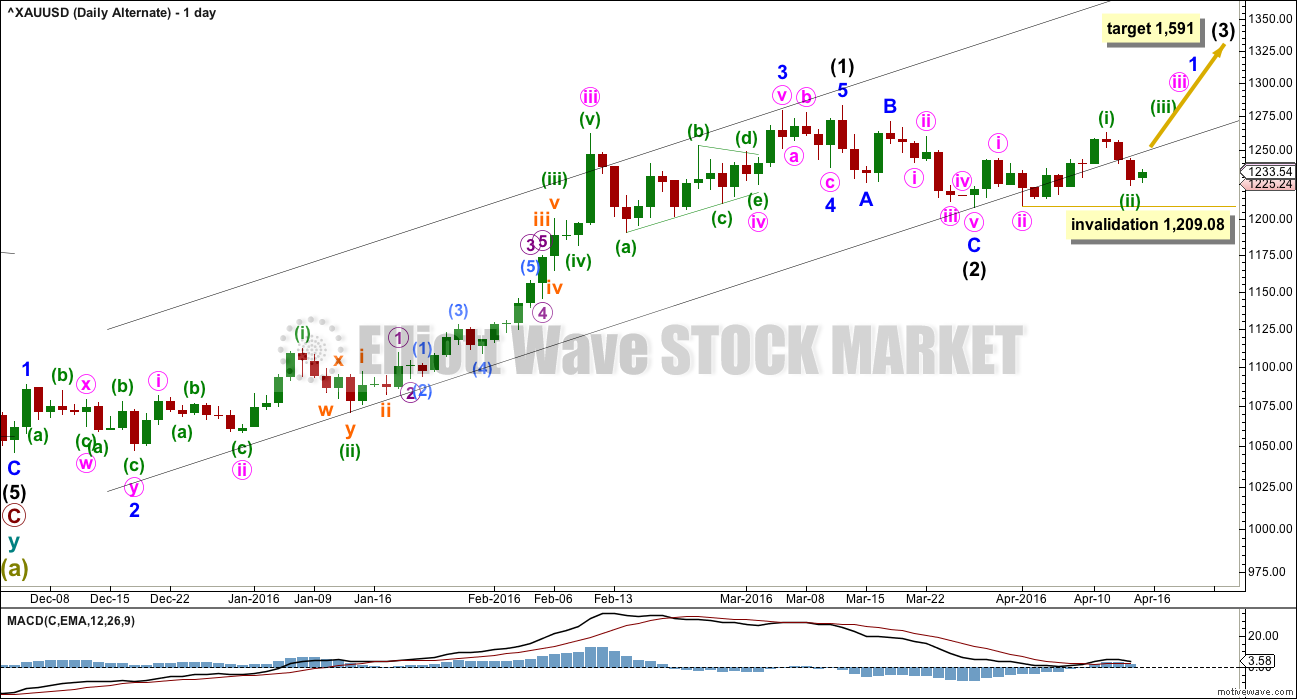
It is technically possible but highly unlikely that intermediate wave (2) is over. This wave count requires confirmation with a five up on the hourly chart for confidence. A new high is not confirmation of this wave count.
If intermediate wave (2) is over, then it is a very brief and shallow 0.31 zigzag lasting only eleven days (intermediate wave (1) lasted 69 days). The probability of this is very low.
At 1,591 intermediate wave (3) would reach 1.618 the length of intermediate wave (1).
Minuette wave (ii) may not move beyond the start of minuette wave (i) at 1,209.08.
The best fit black channel about this upwards movement contains all except the end of minute wave iii within intermediate wave (1). It is very common for the ends of third waves to overshoot channels as they are the strongest movement within a trend.
It is indicative that the lower edge of this channel is now being breached. If a big third wave up has begun, price should be finding support at the lower trend line. For this reason today with a full daily candlestick below the line I will no longer publish an hourly chart. That would give this alternate too much weight. There is not enough bullish indication at this stage to have confidence that a third wave up is underway.
TECHNICAL ANALYSIS
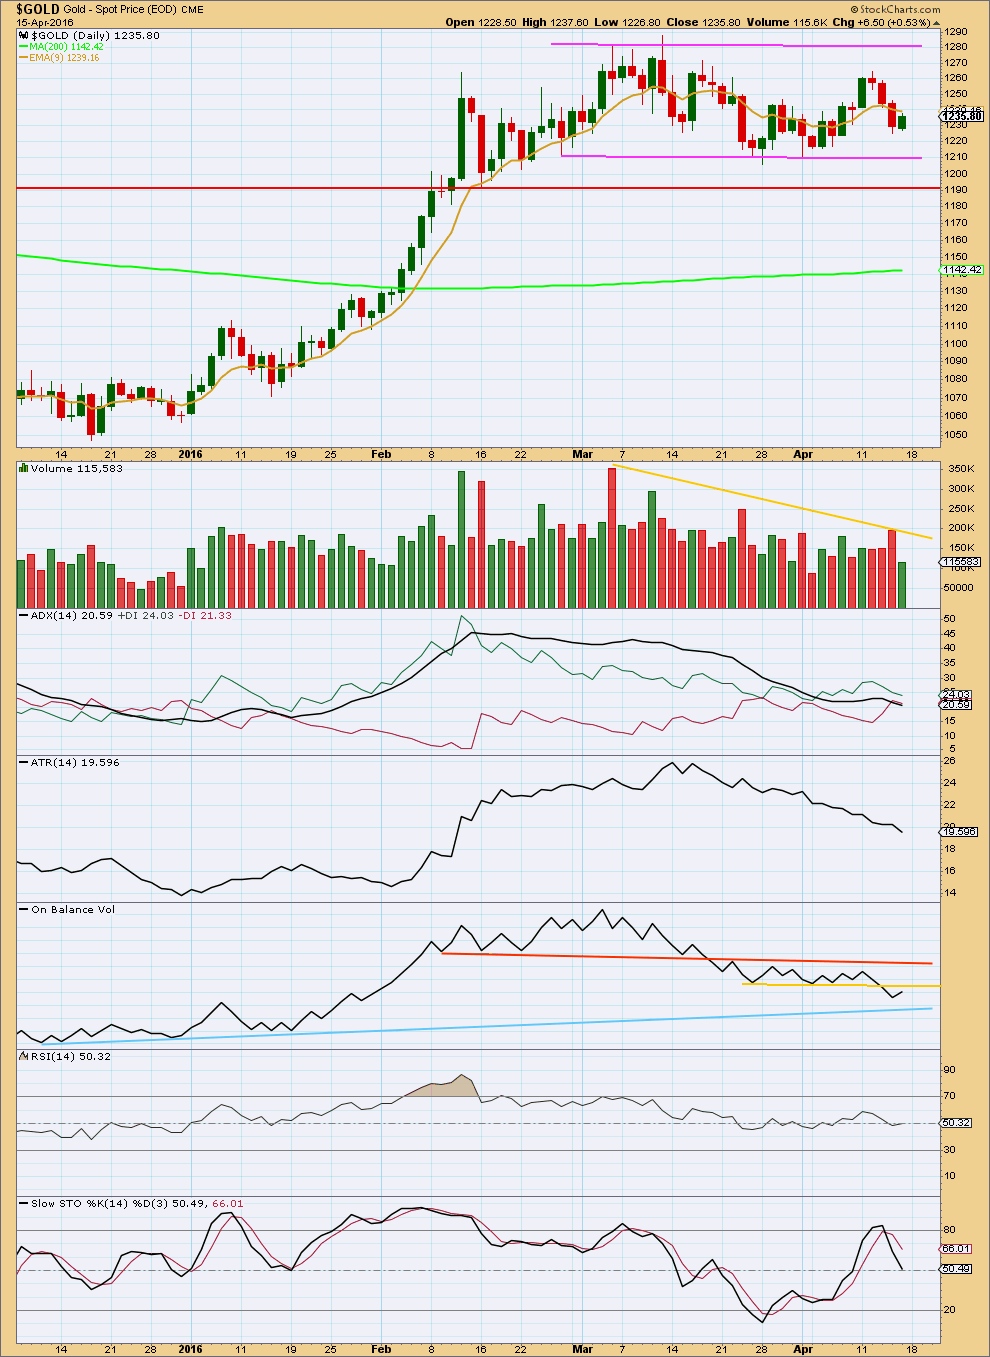
Click chart to enlarge. Chart courtesy of StockCharts.com.
A small inside day to complete a green candlestick comes on very light volume. There was no support for the rise in price from volume for Friday’s session. This supports the idea that short term this downwards swing within the consolidation is likely to continue.
Price is still range bound between resistance about 1,280 and support about 1,210. A breakout is required for confidence in the resumption of a trend. A breakout would be supported by a day with higher volume, but for a downwards breakout this is not necessary. The market can fall of its own weight.
ADX today is declining indicating the market is still consolidating. The +DX line is still above the -DX line, so this indicator is not yet indicating a trend change.
ATR is declining. It agrees with ADX; there is currently no trend.
On Balance Volume is my favourite early indicator. When used with trend lines it will often breakout and show the direction for price before price breaks out. OBV today is giving a reasonable bearish signal with a break below the yellow line. This signal is reasonable because the break is so strong and the line is horizontal. However, that line is short held and only tested twice. A stronger bearish signal from OBV would come with a break below the blue line.
OBV is turning upwards. It may find resistance at the yellow trend line. This would allow for a little more upwards movement from price for one more upwards day if that line holds.
RSI is neutral. There is room for price to rise or fall.
Stochastics touched overbought and is returning. A range bound trading approach may now expect a downwards swing about here; it looks like price was not able to quite reach resistance. Downwards movement may be expected to continue until price finds support and Stochastics is oversold.
Trading a range bound market is much more risky than trading a clearly trending market. If you are not a very experienced trader, then it is the trades you don’t take and the times of uncertainty in the market that you do not enter which will reduce risk and preserve your account. This membership has a wide range of market experience. If there is one lesson I could give, which would be the most valuable to new traders, it would be to manage risk.
This analysis is published @ 07:27 p.m. EST.
I expect it is fairly likely minuette (ii) or minute b is now over.
It subdivides as a zigzag. A small channel about it (orange) is breached to the downside.
Downwards movement should show some increase in momentum if this wave count is correct.
Price should be approaching a downwards breakout in the next couple of days.
Confirmation is still below 1,209.08. Target is still at 1,131 for intermediate (2) to end.
Lara is the target of $1,248 for Minuette wave (ii) or minute wave b still in play or was today’s high of 1241.73 at 9:20 am likely it and gold may head down?
I think that was it Richard.
Price Correction May Be Looming As Bullish Gold, Silver Bets Continue To Surge – Analysts
By Allen Sykora of Kitco News
Monday April 18, 2016 10:59
http://www.kitco.com/news/2016-04-18/Price-Correction-May-Be-Looming-As-Bullish-Gold-Silver-Bets-Continue-To-Surge-Analysts.html
Did subminuette c = a wave (ii) just end at 1241.73 at 9:20 am?
I’m moving subminuette a higher.
And subminuette b to the last small low.
There is no Fibonacci ratio between a and c.
Clive Maund is near term bearish
http://www.gold-eagle.com/article/gold-market-update-191
Good chart showing why a correction in miners is due. Chart by Misgavladach.
If subminuette b ended at 1231.8, subminuette c = a @ 1247.6. So it looks like that matches well with the main hourly count of 1248, then we turn down. We should know in a few hours.
And so should we be buying physical instead of paper??
Which way do YOU think gold will go starting Apr. 19th? Comments?
https://www.superstation95.com/index.php/world/1152
(Link posted on S&P500 ElliottWaveStockMarket subscription from doc4bax)
Armstrong’s view:
https://www.armstrongeconomics.com/markets-by-sector/precious-metals/gold/chinas-coming-gold-fix-april-19th-2016/
There’s a lot of speculation about this, but it seems that at least in the near term, there will be little affect on gold price.
Lara does the gold action at this point clarify if 1,239 or 1248 may be Monday’s top?
Gold just hit an over night high of $1,239.66 at Sunday 8:19 pm EST.
Lara, you mentioned 2 upper targets before dropping further.
“In the short term, a second wave correction may end about 1,239 or 1,248 on Monday. Thereafter, more downwards movement should continue.”
Lara..
Does this high of early asian trade can be consider as the end of wave 2
Apologies to members for the downtime on the websites today.
We are having some issues, but our fabulous hosting service is onto it. Everything should be back to normal tomorrow I hope!
On Feb 17, 2016 Ross Clark of Institutional Advisory Services wrote about gold’s historic trend changes. The report compares past mini bull trends from 1976 to the current one starting from Jan 2016.
Suggests that correction to 23.2% at $1200 should hold.
He analysed following periods:
1996-1999
1988-1993
1983-1985
1980-1983
1975-1976.
http://www.321gold.com/editorials/hoye/hoye022316.pdf
Current Gold’s Fib Fans chart is attached. Gold has not even gotten to 38.2% retracement compared to previous historic trends.
I looked at the .pdf you’ve linked to.
I’m not seeing why he’s made the prediction that $1,200 should hold. Maybe I’m missing something here?
Of the prior periods the only period more directly equivalent would be the sharp moment off the low of 252 in July 1999. That was a sharp first wave lasting three months, then followed by a very deep second wave which was a 98% correction of the first wave up.
It’s his second chart.
Even the retracement on the 1988 to 1993 chart was 81%.
I agree with your comment.
LOL!! This service charges $10000 /year to financial institutions for its service and retail $1600/year??????
Your EW analysis is the best I found.
Waiting for Alf Field to come out of hybernation and post his EW count (free personal ) on gold.
Now we know where all the gold is…
In its annual environmental report released this week, Apple said it recovered 2,204 pounds (more than a ton) of gold from recycled iPhones, iPads and Macs last year. That’s $40 million worth.
http://money.cnn.com/2016/04/15/technology/apple-gold-recycling/index.html?iid=hp-grid-dom
Interesting. Actually, @ 1238 oz, that’s 43.656M. 🙂
Thanks Dreamer for the golden apple post.