
Downwards movement was expected from the main Elliott wave count.
The main hourly count was invalidated above 1,241.55 and the alternate was confirmed. The alternate expected more upwards movement.
Summary: A new low below 1,223.77 would provide strong confirmation for the main wave count as both alternates would then be invalidated. A new high above 1,262.47 would confirm the alternate hourly wave count which expects more sideways movement before an upwards breakout. The alternate daily, which expects a big third wave up is just beginning, remains valid but still has a low probability. The bottom line: Gold is still range bound; there has still not been a breakout.
New updates to this analysis are in bold.
Last published weekly chart is here.
MAIN DAILY ELLIOTT WAVE COUNT
Click chart to enlarge.
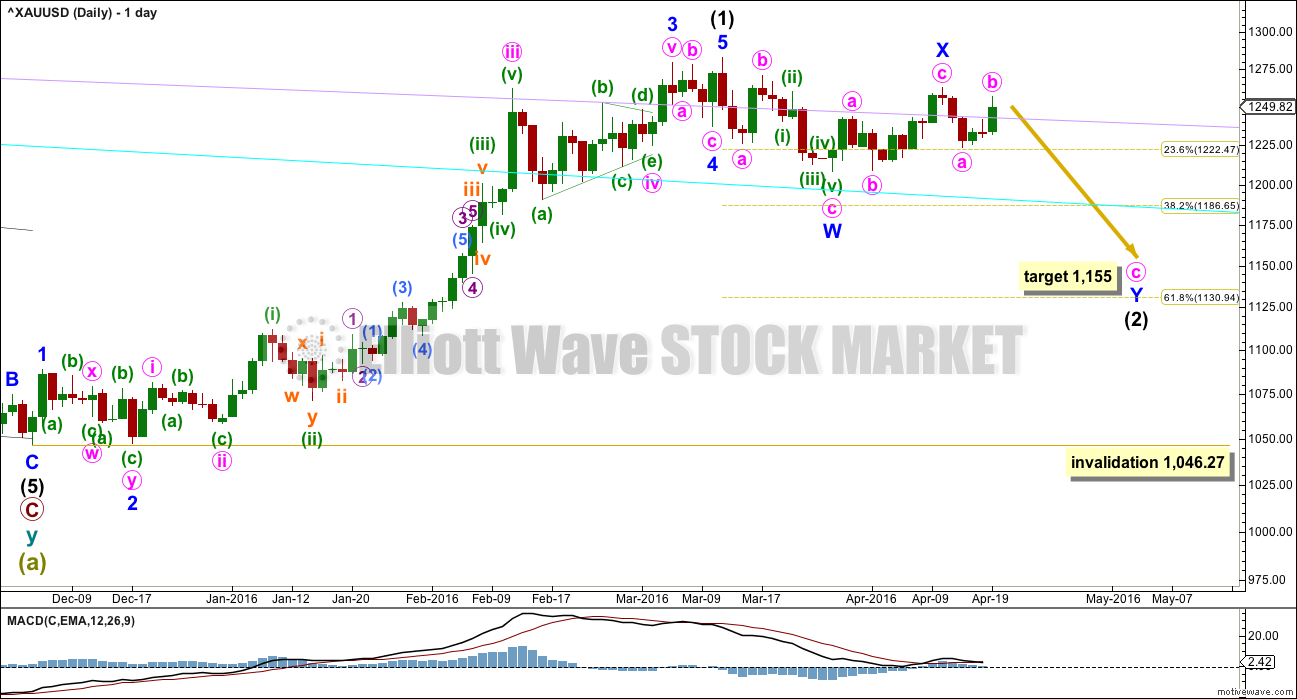
Intermediate wave (1) is a complete impulse. Intermediate wave (2) has begun and is most likely incomplete.
The first movement down within intermediate wave (2) fits as a zigzag.
At this stage, it looks like intermediate wave (2) may be unfolding as a double zigzag. Minor wave X may be a zigzag within the double.
Within double zigzags, the second zigzag exists to deepen the correction when the first zigzag does not move price deep enough. Here, minor wave W ends just below the 0.236 Fibonacci ratio fitting the description of “not deep enough” for a second wave correction. The second zigzag in the double should be expected to deepen the correction; minor wave Y may end about the 0.618 Fibonacci ratio at 1,131.
To achieve the purpose for the second zigzag to deepen the correction the X waves of double zigzags are normally shallow. Here, minor wave X is a 0.73 length of minor wave Y which is not shallow. For this reason, a combination is considered in the alternate hourly wave count. It is still more likely that intermediate wave (2) will be a double zigzag so that it is deeper.
Intermediate wave (2) may be still be a flat correction although today this looks extremely unlikely. If upwards movement continues to 1,275.24. At that stage, upwards movement would be 0.9 of the prior zigzag down, so the structure may be relabelled minor waves A-B with C down to unfold. Within flat corrections, the B wave is most commonly from 1 to 1.38 times the length of the A wave, so this gives a normal range for minor wave B of 1,282.68 to 1,311. There is a risk that upwards movement is not over while price remains above 1,223.77.
A new high does not invalidate this main wave count. The most common type of flat is an expanded flat which would require wave B to be 1.05 of wave A or longer. The price point for this would be at 1,286.40.
There is no rule stating a limit for a B wave within a flat nor an X wave within a combination. There is an Elliott wave convention that states when the possible B wave is twice the length of the A wave the probability of a flat unfolding is so low it should be discarded. That price point is at 1,357.04.
This is still the risk to the wave count today.
Intermediate wave (2) may not move beyond the start of intermediate wave (1) below 1,046.27.
The lilac and cyan trend lines are copied over from the weekly chart (both weekly and daily charts are on a semi log scale). Upwards movement has closed above the lilac line.
MAIN HOURLY ELLIOTT WAVE COUNT
Click chart to enlarge.
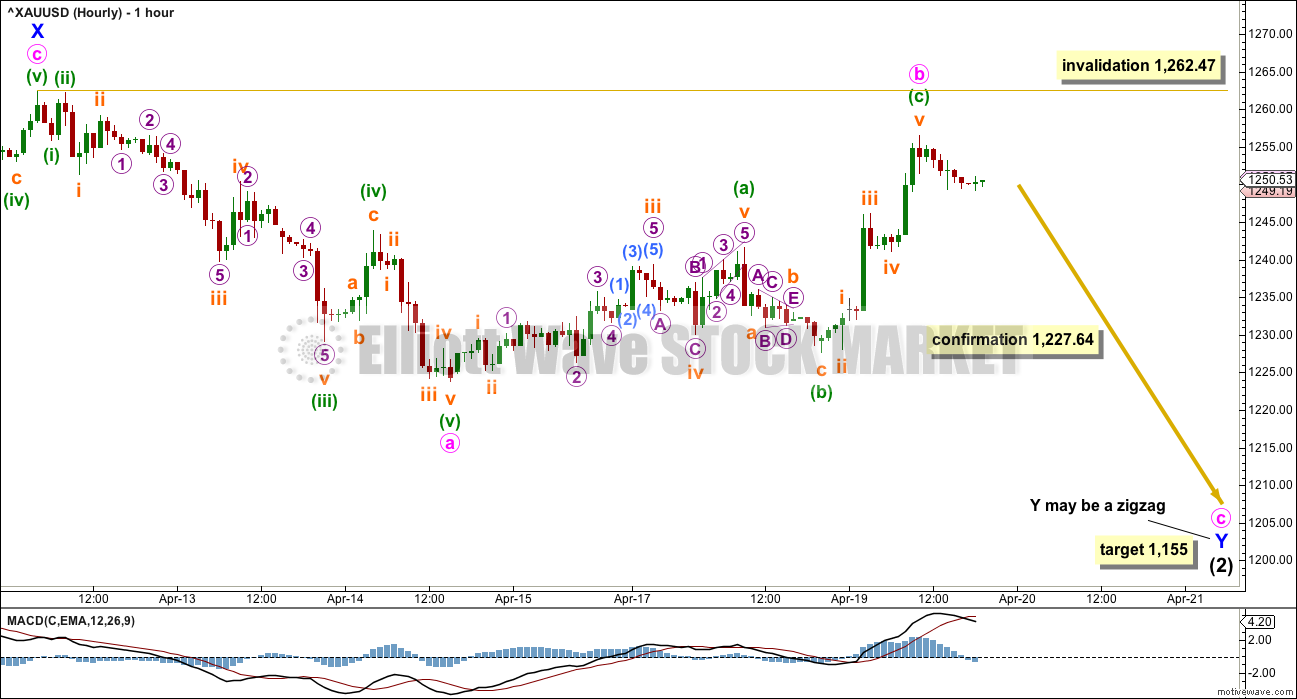
This first hourly chart looks at intermediate wave (2) still as a double zigzag. This structure would allow intermediate wave (2) to move substantially lower and be a more normal deeper second wave correction.
Within the second zigzag of minor wave Y, minute wave a is seen as a five wave structure. This downwards wave will subdivide as either a five wave impulse or a three wave zigzag (alternate hourly chart), so both options must be considered.
If minor wave Y is to be a zigzag, then within it minute wave a must be a five wave structure. Minute wave b must be a corrective structure and may not move beyond the start of minute wave at above 1,262.47.
At 1,155 minute wave c would reach 2.618 the length of minute wave a. If this target is wrong for this wave count, then it may not be low enough.
ALTERNATE HOURLY ELLIOTT WAVE COUNT
Click chart to enlarge.
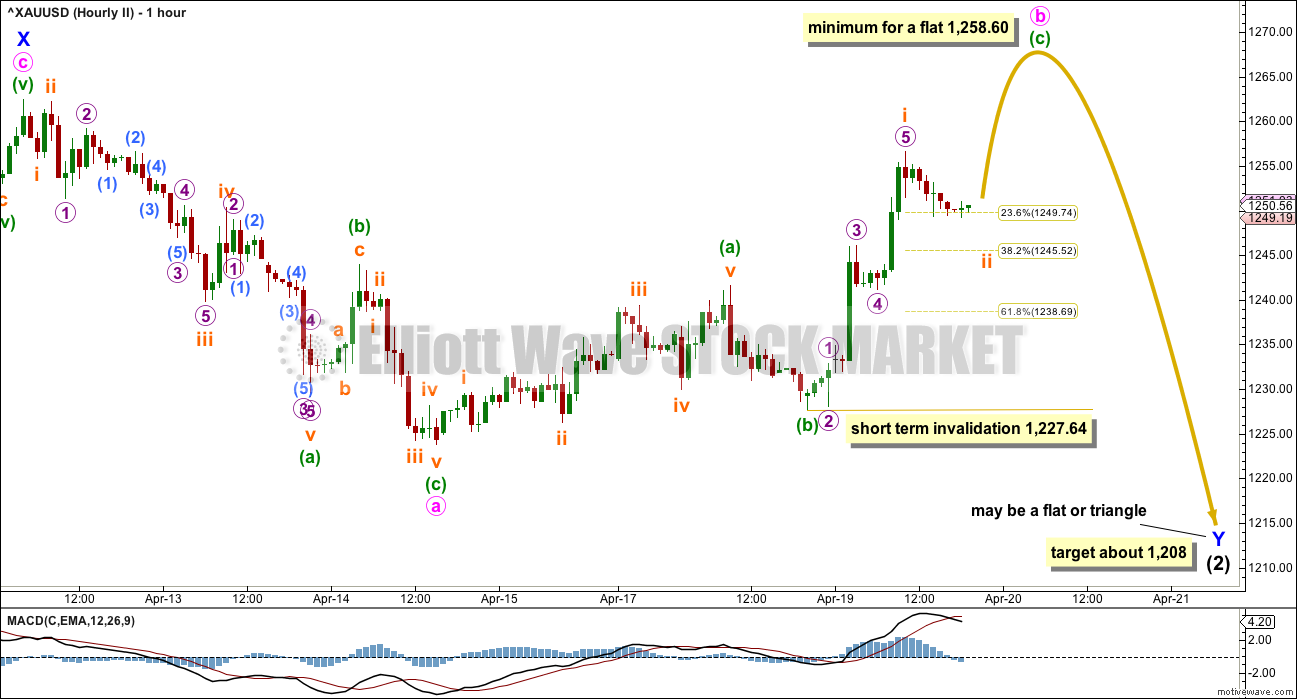
Intermediate wave (2) may be a double combination. The first structure in the double was a zigzag labelled minor wave W. The double is joined by a three in the opposite direction, a zigzag labelled minor wave X. The second structure in a combination may be either a flat correction or a triangle labelled minor wave Y.
Within both a flat or triangle, minute wave a must be a three wave structure. Minute wave a is seen here as a zigzag.
If minor wove Y is to be a flat correction, then within it minute wave b must correct a 0.9 length of minute wave a, so it must end at or above 1,258.60.
If minor wave Y is to be a flat correction, then the normal length for minute wave b within it would be 1 to 1.38 the length of minute wave a, between 1,262.47 and 1,277.17. There is no rule stating a maximum limit for a B wave within a flat, but there is a convention that states when the potential B wave is more than twice the length of the A wave the probability of a flat is so low it should be discarded. This price point would be at 1,301.16.
If minor wave Y is to be a triangle, there is no minimum (nor maximum) for minute wave b within it. The only requirement for minute wave b of a triangle is it must be a corrective structure.
The only reason why this alternate has a lower probability than the main wave count is it would see intermediate wave (2) at its end a very shallow correction, falling short of the 0.382 Fibonacci ratio of intermediate wave (1). This is possible but must be judged to have a lower probability than a deeper second wave for intermediate wave (2).
ALTERNATE DAILY ELLIOTT WAVE COUNT
Click chart to enlarge.
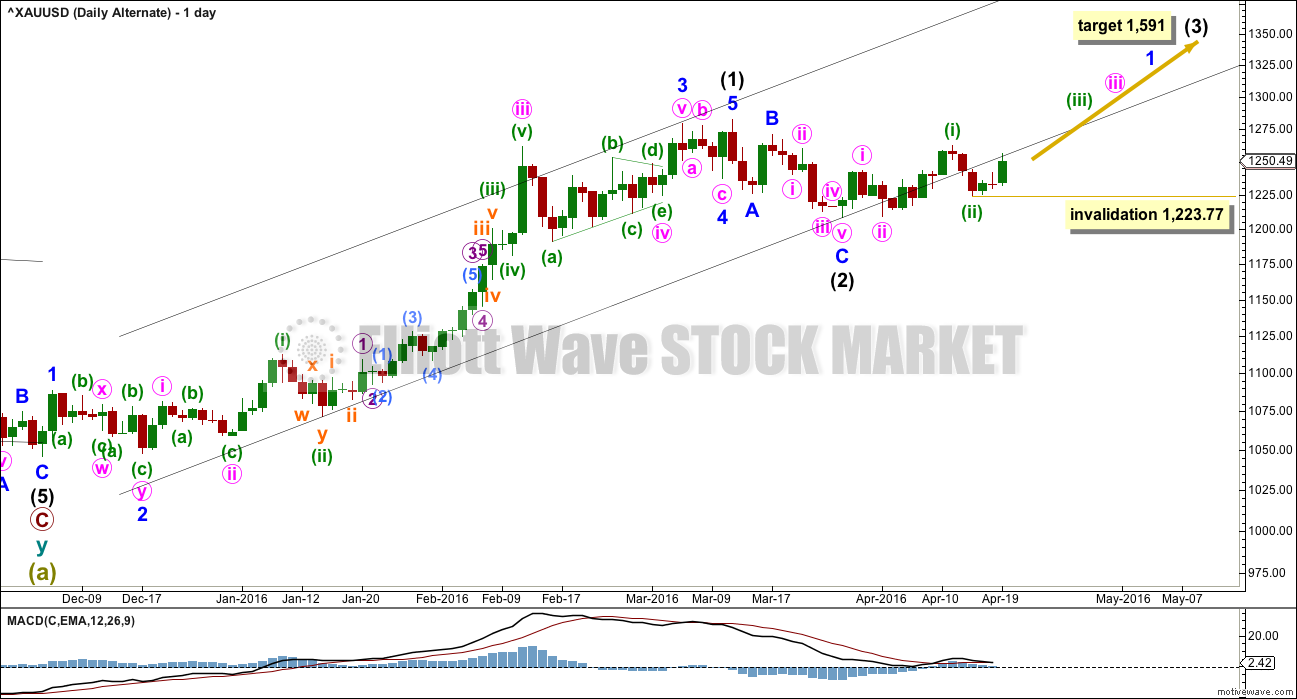
It is technically possible but highly unlikely that intermediate wave (2) is over. This wave count requires confirmation with a five up on the hourly chart for confidence. A new high is not confirmation of this wave count. If price exhibits a classic breakout, a strong upwards day closing comfortably above 1,282.68 on high volume, then this wave count would increase in probability and should be used.
If intermediate wave (2) is over, then it is a very brief and shallow 0.31 zigzag lasting only eleven days (intermediate wave (1) lasted 69 days). The probability of this is very low.
At 1,591 intermediate wave (3) would reach 1.618 the length of intermediate wave (1).
Minuette wave (ii) may not move beyond the start of minuette wave (i) at 1,209.08.
The best fit black channel about this upwards movement contains all except the end of minute wave iii within intermediate wave (1). It is very common for the ends of third waves to overshoot channels as they are the strongest movement within a trend.
It is indicative that the lower edge of this channel is now being breached. If a big third wave up has begun, price should be finding support at the lower trend line. For this reason with now two full daily candlesticks below the line the probability of this alternate wave count at this stage is reduced.
TECHNICAL ANALYSIS
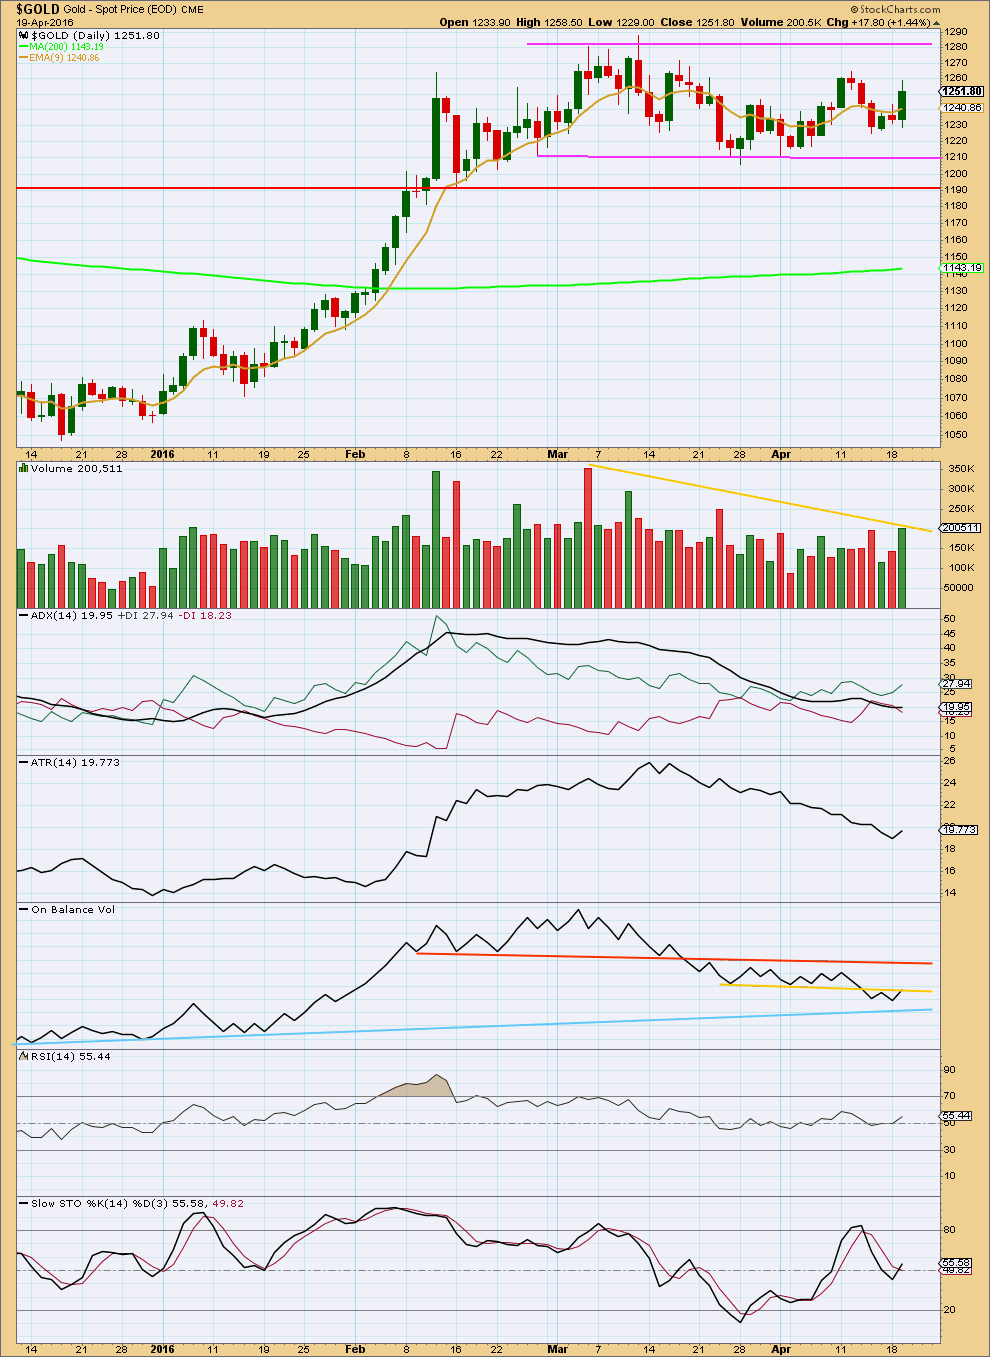
Click chart to enlarge. Chart courtesy of StockCharts.com.
Upwards movement for Tuesday’s session has support from a clear increase in volume. Volume is still lighter than the early stages of the consolidation, but it does look like the last ten days are overall increasing slightly in volume.
Price is still range bound between resistance about 1,280 and support about 1,210. A breakout is required for confidence in the resumption of a trend. A breakout would be supported by a day with higher volume, but for a downwards breakout this is not necessary. The market can fall of its own weight.
It is still a downwards day which has strongest volume during this sideways movement. This trick usually is fairly reliable for Gold, which indicates a downwards breakout is more likely than upwards.
ADX today is slightly increasing and is above 15. This may be the earliest indication of a new trend beginning. The trend would be upwards because the +DX line is above the -DX line.
ATR is also increasing today which agrees with ADX. A new trend may be developing upwards.
ADX and ATR today agree with the alternate daily wave count. This is still very early indication though. If a big third wave up is beginning, then a classic upwards breakout would be still required for confidence in the upwards trend. At that stage, an entry point to join the trend may be found.
On Balance Volume is my favourite early indicator. When used with trend lines, OBV will often breakout and show the direction for price before price breaks out. OBV today is giving a reasonable bearish signal with a break below the yellow line. This signal is reasonable because the break is so strong and the line is horizontal. However, that line is short held and only tested three times. A stronger bearish signal from OBV would come with a break below the blue line.
OBV is turning up again to the yellow line. With this line tested three times before, it has some significance. If the main wave count is correct, this line may offer enough resistance to turn price down here. If this line is breached, it would be a weak bullish signal. The next line of resistance is the orange line which has strong technical significance. If OBV turns down, the blue line may offer support which also has strong technical significance.
RSI is neutral. There is room for price to rise or fall.
With ADX indicating a trend, Stochastics should no longer be used for a range bound trading approach. Stochastics may return to overbought and remain extreme during trending periods.
Trading a range bound market is much more risky than trading a clearly trending market. If you are not a very experienced trader, then it is the trades you don’t take and the times of uncertainty in the market that you do not enter which will reduce risk and preserve your account. This membership has a wide range of market experience. If there is one lesson I could give, which would be the most valuable to new traders, it would be to manage risk.
This analysis is published @ 08:43 p.m. EST.
Gold miners ETF’s ‘key reversal day’ pattern warns that rally may be over
– Apr 20, 2016 4:27 p.m. ET
http://www.marketwatch.com/story/gold-miners-etfs-key-reversal-day-pattern-warns-that-rally-may-be-over-2016-04-20
High volume reversal candle on Gdx -not your average day
Main Hourly update:
Still more likely than the alternate.
Intermediate (2) as a double zigzag. Minor Y to move price substantially lower. A downwards breakout from the consolidation that Gold has been in for a while now.
Confirmation 1,223.78 is very important. Below that point the triangle for the alternate would be invalidated (C of the triangle can’t move beyond the end of A)
A new low below 1,223.78 would indicate a downwards breakout as most likely imminent.
Hourly Alternate update;
price has not managed yet to move up to 1,258.60.
Minor Y may be a triangle. sideways movement for a few days – a week or so yet.
An upwards breakout for intermdiate (3) to begin when it is done.
Another small sideways day. MACD is flat on the daily chart. Price is range bound.
We need to wait for the breakout. Volume should be telling us which direction that will most likely be. So far within the consolidation it is still a downwards day with strongest volume; a downwards breakout is indicated as most likely.
A slight bullish signal from On Balance Volume today moving up through the yellow line. For a clear bullish signal OBV needs to break above the orange line.
For a bearish signal it needs to break below the blue line.
Bullish signsl?
Gold closed lower today?
Sorry. I spoke too soon before StockCharts data was finalised.
Earlier OBV had moved higher above the yellow line.
Now the session is closed and data is finalised OBV is moving lower away from the yellow line.
So yeah, it’s a bearish signal. Support (slight) for the main Elliott wave count – hourly.
Lara:A new low below 1,223.77 would provide strong confirmation for the main wave count as both alternates would then be invalidated.
Watch for 1223???
Yes. 1,223.77 is the line in the sand for that bullish wave count.
Gold breakout down out of triangle it appeared as watching at pmbull at multiple time frames 1, 3,5,15 minutes and longer but triangle gone now.
Miners crashing since 1:15 pm DUST went from 1.76 to 1.96 now NUGT from 95.59 to 86.00 now at 3:12
Miners are aggressively bought on dips and going to new highs.
Pretty close for correction to begin in miners. Nothing goes up forever specially PM sector the most volatile and risky sector.
Waiting days for the correction so far.
And DUST makes new lows, thankfully I sold that already.
Miners are still buying on pullbacks like yesterday very strong both days new highs. When they get high enough they just ignore minor gold dips and keep moving up like the whole yesterday afternoon.
Today NUGT had 4 runs since open of $6, $6, $2, $4
Lara, could we still be in a zig zag 4th wave on the daily, with a triangle for the b wave?
I can’t see how that would fit if minor 4 begins where I have it, from the end of minor 3 on 4th March. For a zigzag the A wave must be a five, and downwards movement from the end of minor 3 doesn’t fit as a five.
What could technically fit would be minor 4 as a triangle.
It would mean minor 4 would be absolutely huge in comparison to minor 2. Minor 2 lasted 9 days. Minor 4 would be so far 33 days and incomplete; it would be only in C of a triangle down now. That’s just too great a difference for the wave count to have anywhere near the right look.