
Gold has broken out of a consolidation upwards exactly as expected.
Summary: Expect price to keep rising while it remains within the best fit channel on the hourly chart. The target for this trend to end is at this stage 1,477. If the channel is breached, then draw a Fibonacci retracement along the first wave up and use the 0.382 and 0.618 Fibonacci ratios as targets for a correction. If price breaks below 1,237.97, then a downwards target would be 1,131.
New updates to this analysis are in bold.
Last published weekly chart is here.
DAILY ELLIOTT WAVE COUNT
Click chart to enlarge.
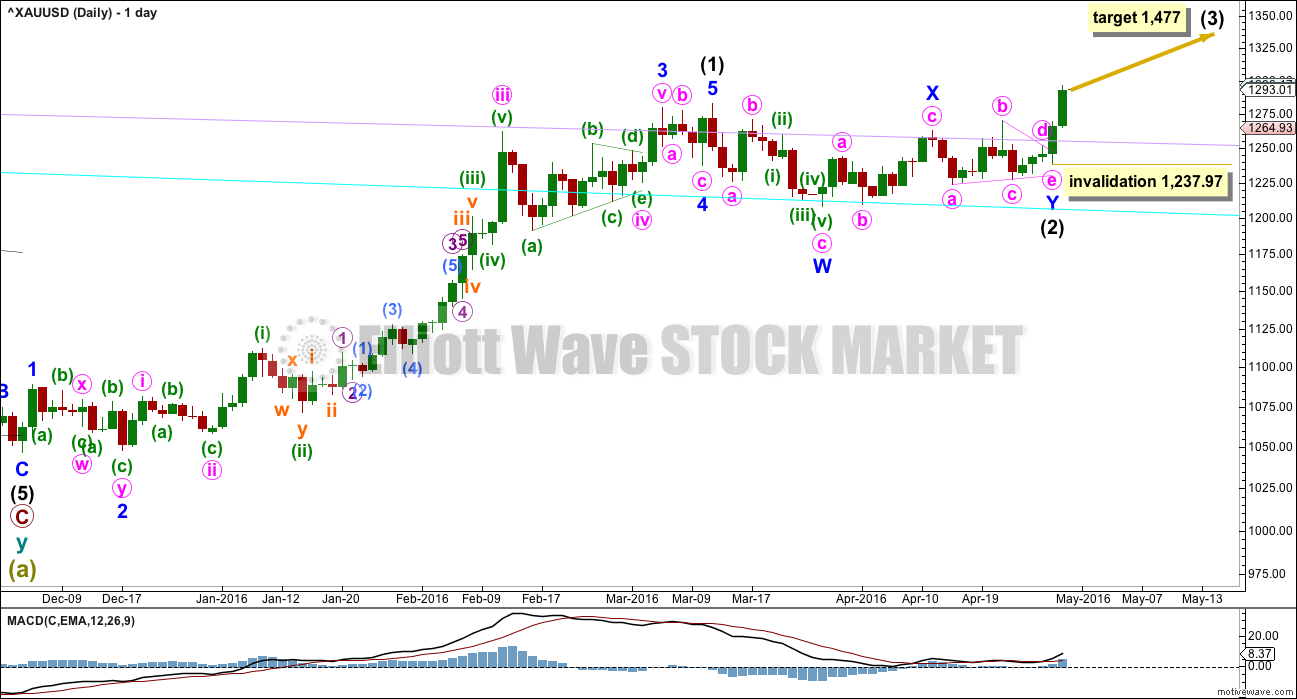
Intermediate wave (2) may be a double combination.
Minor wave W is a zigzag, the first structure in a double. The two structures in the double may be joined by a simple zigzag for minor wave X in the opposite direction.
Minor wave Y may be a running contracting triangle. The triangle is supported by MACD hovering at the zero line here on the daily chart.
Within intermediate wave (3), no second wave correction may move beyond the start of the first wave below 1,237.97.
The next wave up for intermediate wave (3) should be swift and strong. It must move above the end of intermediate wave (1) at 1,282.68. It must move far enough above this point to allow room for intermediate wave (4) to unfold and remain above intermediate wave (1) price territory.
At 1,477 it would reach equality in length with intermediate wave (1). This target is reasonable because intermediate wave (2) was very shallow.
If intermediate wave (2) is over as labelled, then it may have totalled a Fibonacci 34 sessions.
FIRST HOURLY ELLIOTT WAVE COUNT
Click chart to enlarge.
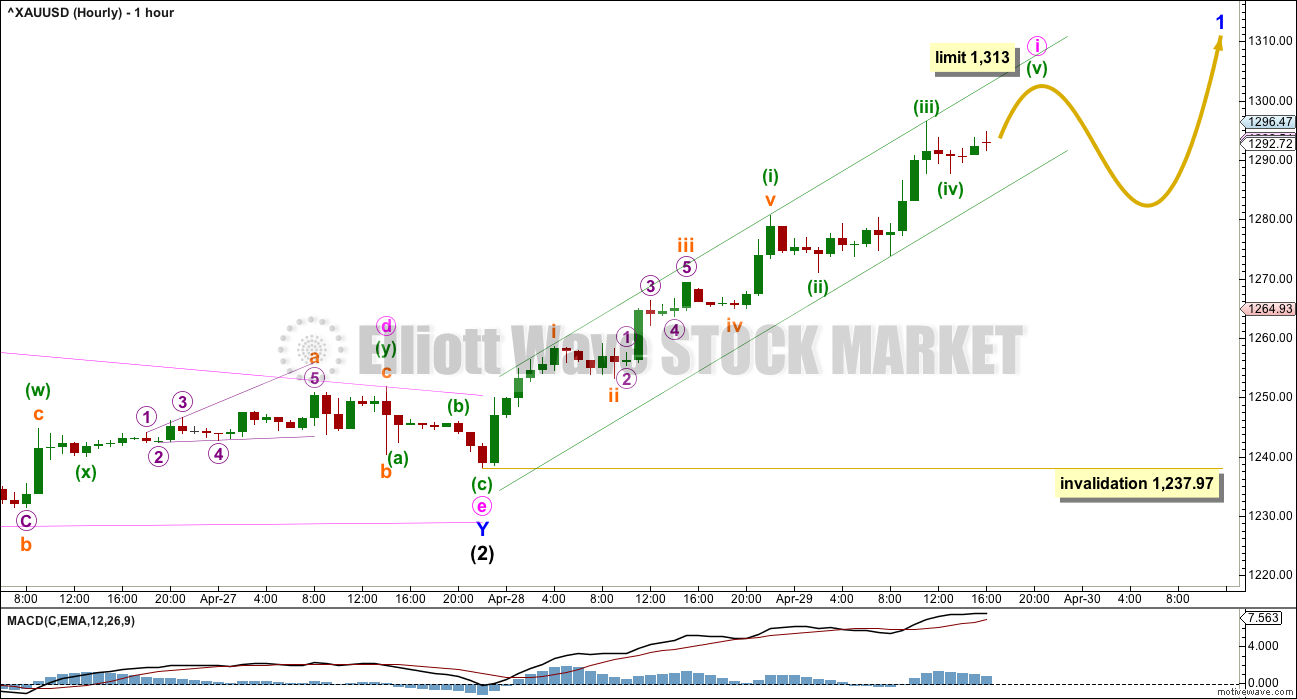
There are at least two ways to label the subdivisions of upwards movement from the start of intermediate wave (3). I slightly favour this first hourly wave count because it has better Fibonacci ratios. Further, we should always assume the trend remains the same until proven otherwise, so use this first hourly wave count while price remains within the green best fit channel.
Expect the trend remains up while price remains within the channel. If price breaks below the lower edge of the channel, then use the second hourly wave count.
Within minute wave i, the first wave of minuette wave (i) is extended. Minuette wave (iii) is 1.06 short of 0.618 the length of minuette wave (i).
Because minuette wave (iii) is shorter than minuette wave (i), this limits minuette wave (v) to no longer than equality with minuette wave (iii) so that the rule stating a third wave may not be the shortest is met. This limit is at 1,313.
When minuette wave (v) is complete, then a five wave impulse for minute wave i would be complete. This would be indicated by a subsequent breach of the channel. When that happens, then draw a Fibonacci retracement along the length of minute wave i and use the 0.382 and 0.618 Fibonacci ratios as targets for minute wave ii.
Minute wave ii may not move beyond the start of minute wave i below 1,237.97.
SECOND HOURLY ELLIOTT WAVE COUNT
Click chart to enlarge.
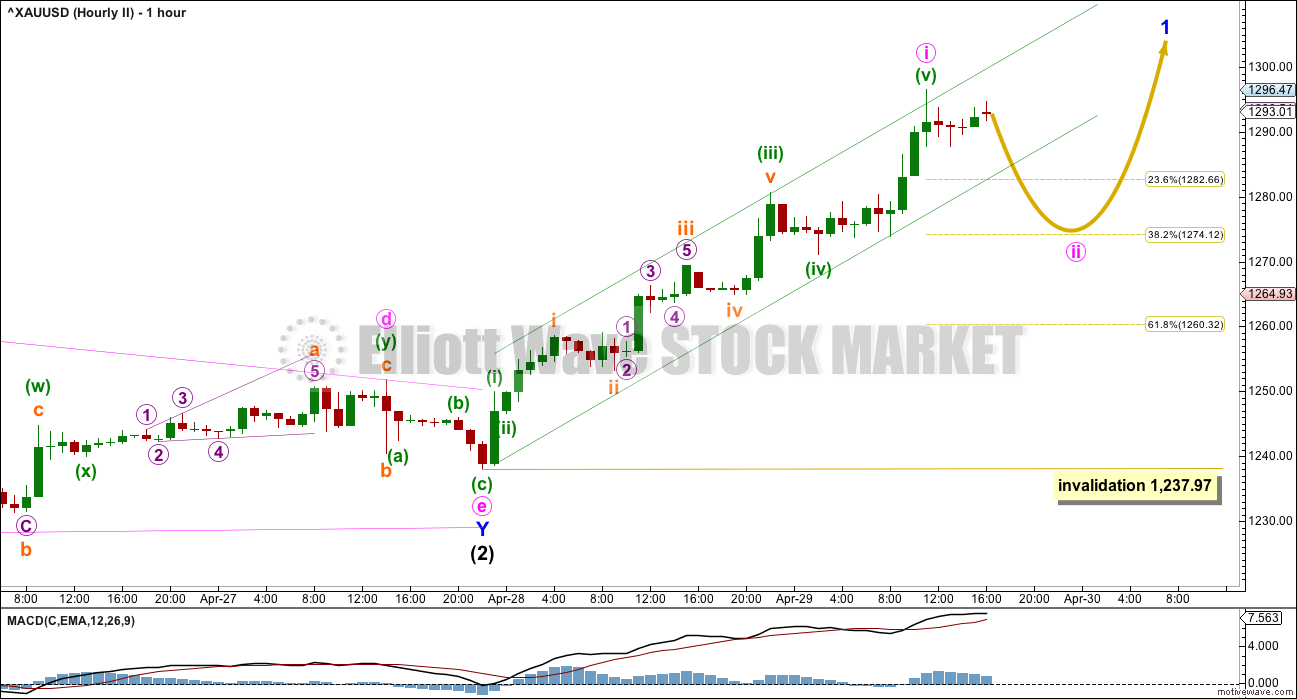
After trying several different ways to label this upwards movement, this idea comes from checking subdivisions on the five minute chart.
There are no Fibonacci ratios between minuette waves (i), (iii) and (v).
It is possible that minute wave i is over. Minute wave ii may correct to either the 0.382 or 0.618 Fibonacci ratios at 1,274 or 1,260. The correction may be more shallow than usual due to strong support from the consolidation.
Minute wave ii may show up on the daily chart as one to three red candlesticks or doji. It may not move beyond the start of minute wave i below 1,237.97.
If price does break below 1,237.97, then use the alternate daily chart below.
ALTERNATE DAILY ELLIOTT WAVE COUNT
Click chart to enlarge.
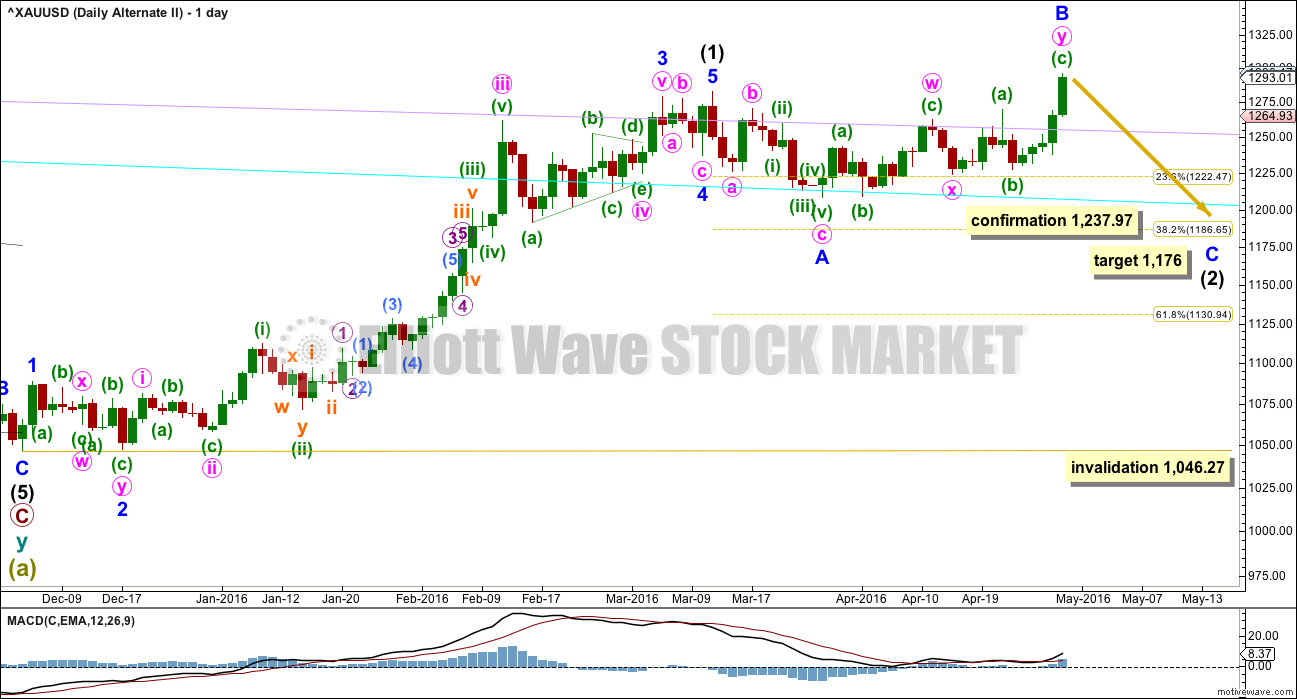
It is still possible that intermediate wave (2) is not over.
Normally, the first large second wave correction within a new trend is very deep, often deeper than the 0.618 Fibonacci ratio. The main wave count sees intermediate wave (2) as very shallow at only 0.19 of intermediate wave (1). This is unusual. And so this alternate must be considered.
If any members have long positions on Gold already it is essential that stops are used in case this alternate unfolds. I have already moved my stop to break even. If the main wave count is right, then I will not have a profit but nor will I have a loss. If this alternate is right, then I can wait until intermediate wave (2) is over to enter long for intermediate wave (3), or possibly enter a small short position to ride down minor wave C.
Intermediate wave (2) may be an expanded flat correction. Minor wave A is a three, minor wave B is a three and a 1.20 length of minor wave A. This is within the normal range of 1 to 1.38.
At 1,176 minor wave C would reach 1.618 the length of minor wave A. This would be the most likely target. If price keeps falling through this first target, then the second target would be at 1,102 where minor wave C would reach 2.618 the length of minor wave A.
Intermediate wave (2) may not move beyond the start of intermediate wave (1) below 1,046.27.
TECHNICAL ANALYSIS
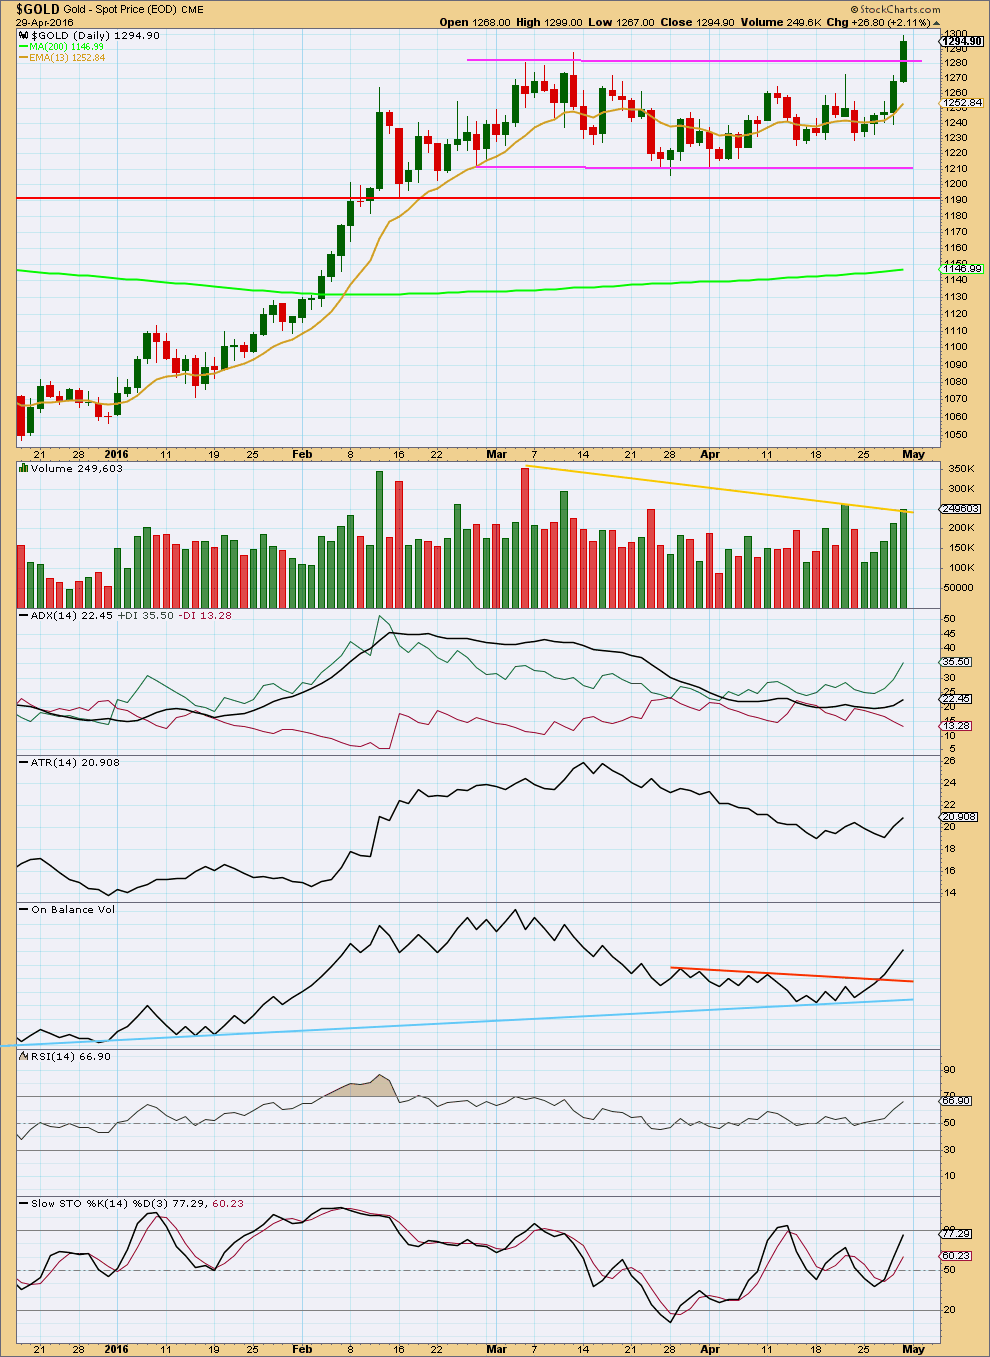
Click chart to enlarge. Chart courtesy of StockCharts.com.
Upwards movement for Friday closed comfortably above prior resistance at 1,280 on a day with increased volume. This looks like a classic breakout from a consolidation.
After a breakout, often price will turn back down for a correction a few days later to find support at prior resistance. For this to have a typical look, price may be expected to move higher before turning down for a small correction which may end about 1,280. That would provide a perfect entry point to join the upwards trend if that is how price behaves.
For five days in a row price rises with increasing volume. The rise in price is supported by volume.
ADX is increasing and the +DX line is above the -DX line. ADX is indicating an upwards trend is in place.
ATR agrees there is a trend as it too is increasing.
On Balance Volume has given a strong bullish signal with a break above the orange trend line.
While the trend is up, the 13 day moving average may be expected to provide support for counter trend corrections.
RSI is not extreme. There is room for price to rise further.
This technical analysis supports the main Elliott wave count. It does not support the alternate daily Elliott wave count.
This analysis is published @ 04:10 a.m. EST on 30th April, 2016.
I have to go out this morning for a while and so Gold analysis is being down now and I aim to have it published in about half an hour.
Short term: a zigzag is unfolding down for a second wave correction: hourly alternate.
Target 1,273 for C = 1.618 X A
Here’s the target range for NUGT based on a similar correction.
Possible GDX target for this correction. We could go lower of course, but if this correction is similar to the last two, here is the target range. I f the gold correction looks complete when GDX hits this range, then the GDX correction is likely complete.
Where will the correction bottom be?
Right now the trend is down for gold, GDX and NUGT
If it ended down about where Friday opened that would be nice.
Friday open 1281.16 GDX at 24.75 and NUGT 105.80
Gold now at 1290.78 GDX at 25.21 and NUGT at 110.67 at 2:49 pm
Monday open 1295.63 GDX at 26.10 and NUGT at 123.00
Did the 3rd subwave of C just end at 1287.72 at 2:14 pm or was that the 3rd of the 3rd?
It can either be the third of a third, or the third of the first of a third. More structure will be needed for me to distinguish that.
Thanks, that sure doesn’t sound like the bottom to me.
I’ll wait until gold drops more and more GDX and NUGT is being dumped out of taking profits or fear.
With the US Dollar down by over .40%, I’m actually surprised to see that gold hasn’t benefited; trading at $1,293.91 at time of this post.
I think that gold in in the C wave down towards the retrace targets, however Lara said daily chart may have 1 – 3 red candlesticks of doji.
A-B-C- down from day high of 1303.84 at 8:19 am
A – 1288.78 at 10:26 am
B – 1297.28 at 11:44 am
c – In process towards 1280 support or retrace targets of 1278.63 or 1263.05 or ?
Methinks C wave has completed the first of 5 subwaves. Currently 1297.28 – 1291.07 – 1294.34 ?
Curious how low the C wave might get down to as several possibilities and if it bottoms today, Tuesday or Wednesday?
Tham, I would appreciate hearing your comments on DUST–if SP500 rolls over and Gold corrects down at same time, DUST would be an exceptional opportunity. Would you provide your view of DUST?
Thanks
Hi Davey.
DUST is unliked and that accounts for its fantastic fall from grace over the past few weeks, and particularly in the past week or so. It would undergo a reverse split, I think, on May 18. I wouldn’t want to touch it in the near future as gold is in an uptrend. If you really want to trade it, I suggest you scalp.
The characteristics I observe with these leveraged ETFs is that they are a darling in line with the trend, to wit, the phenomenal rise of NUGT when gold rose, and a monster when it is contrary to the trend. DUST has now suffered that ignominy. TVIX had sunken when S&P arose, and had gone through a reverse split.
Tham-thanks.
TOS Gold and GDX MACD: all bearish at this moment from 1 minute to 195 minutes time frames
1303.84 high 8:19 am May 2
1237.84 low 10:50 am April 28
Possible retrace targets
1280 support area then
1278.63 .382 retrace
1263.05 .618 retrace
1237.97 confirmation for daily alternate
1176 1st target
1102 2nd target
Maybe big news in a few minutes 10:00 am EST
MONDAY, MAY 2 10:00 am am US ISM
http://www.marketwatch.com/newsviewer
I think the 1 hour chart may being breached as 9 am dropped below lower trendline?
I think we have completed Minute 1 at 1303.84 @ 8:10 am. I can count 5 waves up.
Thanks for the count so gold may have started the retracing then.
Yen flirts with 18-month high vs USDollar,
tests Japan’s patience
May 1, 2016 10:30 pm
http://www.cnbc.com/2016/05/01/yen-flirts-with-18-month-high-vs-usd-tests-japans-patience.html
GUNNER24 May 1st Gold reaching first objective at 1308 now.
http://www.gunner24.com/newsletter/nl-050116/
Great charts. His last article April 10th had targets for HUI and GDX in 3 weeks and they were met in time on last Friday. He has even higher targets.
Financial guru Robert Prechter argues forcefully for the applicability of Elliott wave patterns as an organizing principle for many types of social behavior outside the realm of finance [2].
Prechter’s basic idea is that the units in a social system—investors, voters, music fans, shoppers—tend to make their individual decisions on the basis of what they see others doing. In other words, they herd. These decisions are then translated into a “social mood,” which is measured by things like the DJIA, hemlines levels in women’s skirts, types of musical lyrics, or attendance levels at baseball games. What sets Prechter’s “socionomics” apart from conventional wisdom is that he completely turns around the idea of cause-and-effect in social systems.
If social moods have a definite pattern, they certainly cannot be the result of random events. And there is not a shred of evidence to suggest that a social mood is the result of events that are themselves structured to produce the Elliott Wave patterns they display. Thus, the only possible direction of causality is to assume that events do not shape social mood; rather, social mood shapes events. Thus, collective mood shapes the nature of social interaction, and consequently the resulting social actions and events.
So, for instance, production, recession, political news and even major conditions such as war and peace do not buffet the social mood; rather, the trends in social mood induce people to take actions that show up as economics, politics, and all other manner of social trends that make history.
This forum is not the best platform for such a discussion, but since the basis of EW principle is the social mood, I thought we could have a brief airing on it.
The concept of causality borders on the philosophical. This is my take on it.
Conventional wisdom has evolved based on linearity and is deterministic. This is the basis of such entities like cause-and-effect i.e. “reaping what you sow”, classical science and engineering, and so on.
Reality, on the other hand, appears to be non-linear, and non-deterministic. The best scientific explanation is the Chaos Theory. Prechter’s social mood thinking falls broadly into this category. But, be aware that if it sticks closely to the Chaos principle, then the immediate outcomes cannot be predicted accurately, only approximately. The best description of the outcomes based on Chaos Theory is the weather forecast, and you know how accurate it is.
If I want to know what the weather is going to do, I look out my window 🙂
I’m okay with you all discussing whatever you like in this forum. It doesn’t have to be limited to technical analysis.
If EW theory is correct in that it is social mood which moves markets, then we have a perfect instance to view that in practice unfolding over the next few months.
It is generally accepted that major events are what move the markets. After a large price movement the talking heads will offer many fundamental reasons for the price movement. But they’ll do that AFTER the move, not before.
If EW theory is right then the relationship is turned on its head.
I am expecting that the S&P (and also DJIA, DJT, Nasdaq, and FTSE amongst most others) have just turned and will begin a hard fall to new lows. The turn came early last week in my analysis. If I am right then what is the fundamental cause? At this stage very few talking heads are bearish, the vast majority are I assume bullish. Good times are back and prices will rise.
Only when it is clear that prices are falling will they come up with an excuse for it. When the weakness has been there for all to see for a long time.
I like to keep an eye on some social mood indicators. I’ve noticed fluro colours for over a year now in fashion. The last time I saw such bright colour was late 1980’s.
I’ve also noticed that Ghostbusters has been redone. The original was released in 1984, three years before the market peak of 1987.
But one of the weirdest things, and I’ve never seen this before, is the “mullet” skirt. Short in the front, long in the back. It can’t make up its mind. Which makes sense of the ATH in the stock markets was a B wave. Something is wrong / something is off about it. And who would wear such a skirt anyway? I think they’re ugly, but each to her own I guess 🙂
It’s an odd area to speculate in I guess, this social mood thing. But most interesting.
Hi Lara
Be careful if you are taking your fashion cues from NZ! One of the most endearing aspects of NZ is that it is not at the forefront of fashion. We used to say that NZ was approx 20 years behind Europe and the US but in a positive sense. Less crime, old fashioned morals and altogether less cynical.
When I first went to NZ in 1980, the front page of the Christchurch newspaper included a story of some granny’s cat stuck up a tree that had to be rescued by the fire brigade. So cute! In business meetings our hosts would wheel out a tea and cakes trolley with a pot and matching cups and saucers. So civilised!
The gap has certainly narrowed since those days, but not by much. 🙂
ROTFL
But we have moved on since the 1980’s. We even have our very own fashion week (they may have tea and cakes at the after parties?)
So, has anyone else seen “mullet” skirts? Or is it just us kiwis?
I noticed that the #1 song not too long ago was ‘Happy’. Not just in the US but in many regions internationally. I thought that was interesting in the context of EW theory and causality. Maybe it was enough to constitute the social mood ‘euphoric’ peak.
Sure sounds euphoric.
Reminds me of Don’t Worry, Be Happy released 1988.
RIGHT ON LARA. When Edward Russel Dewey published his book–“CYCLES The Mysterious Forces That TRIGGER EVENTS” in 1971 (Yes the same Dewey who invented the Dewey decimal system) He Knew that cycles (which of course relate to the waves in ELLIOT WAVES) were what caused events ,NOT the other way around. The general public and certainly most of the so called “financial gurus and” experts” on financial matters as they relate to market behavior either know nothing about Elliot wave, or cycles. or they choose to ignore it. ( As maybe do many STILL on this forum ,who “Don’t Get It”. Lara Gets it and I get it. !! When you understand the TRUTH about what really drives the markets you will trade ,or invest with much more confidence and your market TIMING will improve ,enabling you to make money on both the long and short side of the markets. Stephen C ,New London CT.
Have you ever seen the patterns that result from “chaotic” equations? They make fabulous looking designs if you color them with colors that match the possible value ranges of the equation. Imagine two inputs in the x and y axes and the color in the corresponding spot where the x and y converge represents the result of that combination. I’ve attached one classic picture that results. But what is more interesting is that they are fractal in nature, i.e. as you zoom in on any part of the design you get similar designs, down to any arbitrary degree of detail you want to go. What it means is that a very small input (movement along the x and y axes, in a 3 dimensional plot) can yield huge and unpredictable changes in the equation value. it been likened weather-wise to a butterfy flapping its wings and resulting in three additional hurricanes that year.
That Fractals photo is Groovy. Far out!
Ok now I’m dating myself as I was a teenager in the 1,960’s.
Mr. A.J. Frost of Canada considered by some as the greatest living interpreter of the Elliott Wave Principle and Hamilton Bolton, founder of the famous Bank Credit Analyst, between them they revived interest in Elliott Wave in the 1,960’s. Some unhesitatingly say that if it had not been for their efforts, Elliott Wave would be unheard of today.
That’s so cool!
That is a wonderful picture, Thomas. It succinctly portrays the Butterfly Effect propounded by Edward Lorenz in a 1972 lecture “Predictability: does the flap of a butterfly’s wings in Brazil set off a tornado in Texas”: that a single occurrence, no matter how small (initial condition) can change the course of events somewhere down the way. And the changes can be phenomenal. This is the popular concept portrayed in current literature.
However, the true message of Lorenz was more profound than this. It is anchored in Chaos Theory, and has undertones of unpredictability. The true significance is that “minuscule disturbances neither increase nor decrease the frequency of occurrence of various weather events such as tornadoes; the most they may do is to modify the sequence in which these events occur.” That is to say, a long-term event will run on its course, and one initial change would only modify it. It takes a lot of changes, all aligned in one direction, to effect a total change. Which means that it requires concerted social mood changes, repeatedly aimed in one direction to force a change in the long-term trend. Meanwhile, in the short term, social mood can modify the trend, which explains the perturbations to the trend.
Just to summarise my viewpoint.
A long-term trend is in place. A social mood change can modify the trend, but it would only be a minor disturbance. Talking heads are slow to catch up on the perturbation, often dismissing it. They stick to the tried and tested, and that is what people like to hear. You know, people are adverse to change. Usually the talking heads are right, because social mood change is often whimsical. It can also change at the drop of a hat. But, should there be repeated concerted effort, aimed in one direction, then a change can occur in the main trend. This is provided the conditions that define the main trend are completely negated.
The notion of linear cause-and-effect has been strongly ingrained in most people, and that is why the majority believes that event happenings, that is news, drive changes in prices. It takes a lot of thinking out of the box to change the mindset to one of non-linearity. I do. I have been earning a living as an engineer and then as a lecturer. Large scale structures, in engineering, work on linearity, and predictability. It is only when I took time off to reflect on life that I begin to realise that there is another side to the coin.