
The first hourly Elliott wave chart was invalidated with a new high above 1,236.56 confirming the second hourly Elliott wave count.
The second wave count expected upwards movement to 1,244. So far price has reached 1,243.19.
Summary: Upwards movement would most likely be over here or very soon. A break back below the upper edge of the blue channel would provide confidence and a new low below 1,227.93 would provide further confidence. The target for downwards movement is 1,131.
New updates to this analysis are in bold.
Last published weekly chart is here.
MAIN DAILY ELLIOTT WAVE COUNT
Click chart to enlarge.
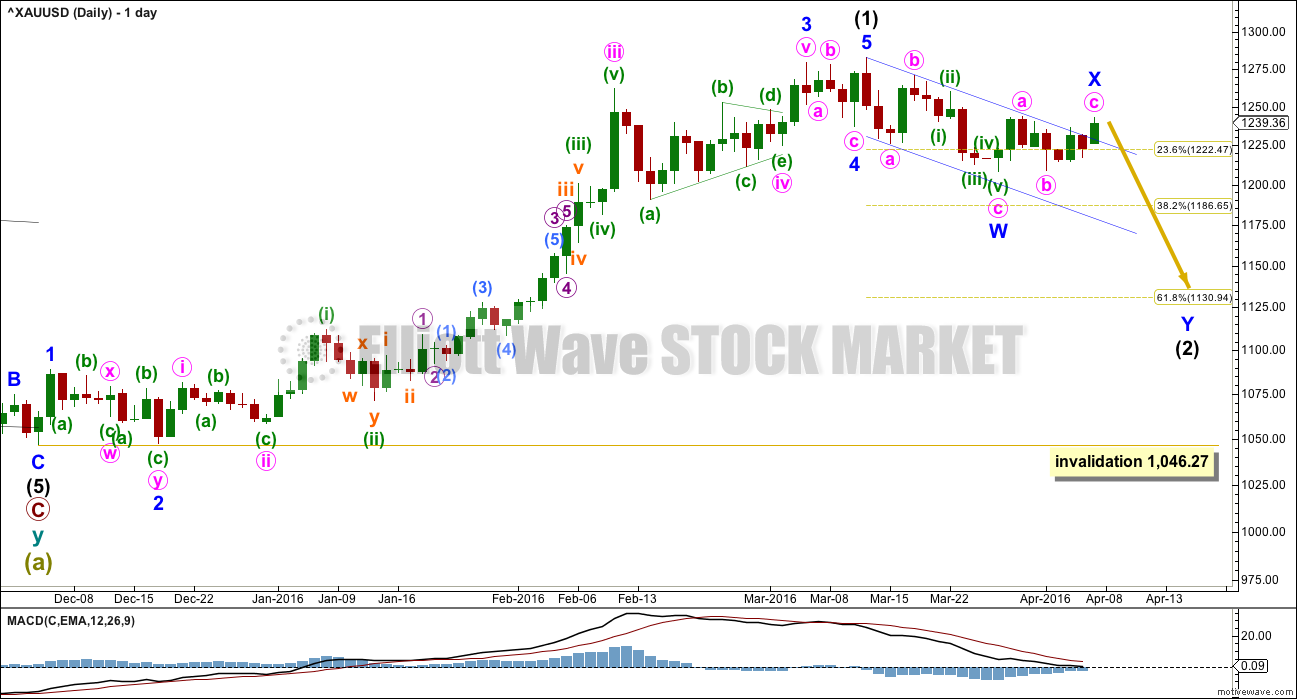
Intermediate wave (1) is a complete impulse. Intermediate wave (2) may have begun. COT supports this wave count; the majority of commercial traders are short (as of 29th March). While this does not pinpoint when price should turn, it does support a larger downwards trend about here.
The first movement down within intermediate wave (2) fits as a zigzag. So far movement to follow it is sideways, moving in an ever decreasing range.
At this stage, it looks like intermediate wave (2) may be unfolding as a double zigzag. Minor wave X may now be a complete zigzag within the double.
Within double zigzags, the second zigzag exists to deepen the correction when the first zigzag does not move price deep enough. Here, minor wave W ends just below the 0.236 Fibonacci ratio fitting the description of “not deep enough” for a second wave correction. The second zigzag in the double should be expected to deepen the correction; minor wave Y may end about the 0.618 Fibonacci ratio at 1,131.
To achieve the purpose for the second zigzag to deepen the correction the X waves of double zigzags are normally shallow. A triangle for minor wave X would be a shallow correction. The whole structure would have the right look for a double zigzag.
The dark blue channel is a best fit. If price returns to within the channel, then it should again show where upwards corrections find resistance.
It is possible that minor wave X may continue higher and be deeper. There is no upper invalidation point for minor wave X; X waves may make new price extremes beyond the start of the first structure in the double. If minor wave X continues higher, then intermediate wave (2) would more likely be a combination than a double zigzag. They are very different structures.
While double zigzags should have a slope against the prior trend, combinations should not. They are sideways structures. To achieve this the second structure in the double normally ends close to the same level as the first structure. In this instance, that would see intermediate wave (2) a very shallow correction failing to reach the 0.382 Fibonacci ratio. This is possible, but it has a low probability. This is the risk to the wave count today.
Intermediate wave (2) may not move beyond the start of intermediate wave (1) below 1,046.27.
HOURLY ELLIOTT WAVE COUNT
Click chart to enlarge.
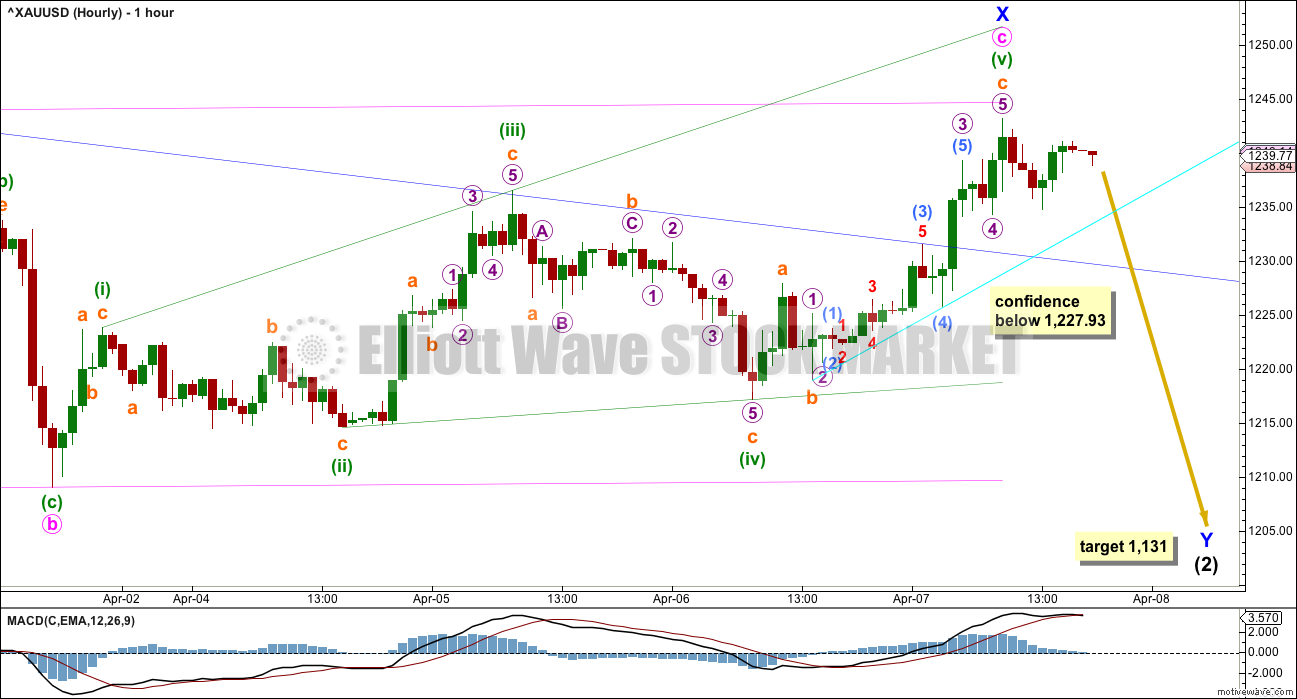
Minor wave X may be either a regular flat correction or a zigzag. Minute wave a will subdivide best as an impulse, but it will also subdivide as a zigzag.
Within the zigzag (or flat) of minor wave X, minute wave b is a 0.98 length of minute wave a. If it is over here, minute wave c is 1.25 short of equality in length with minute wave a.
For both possibilities of a flat or zigzag for minor wave X, minute wave c must be a five wave structure. So far it looks like it may be an ending expanding diagonal.
All subwaves must subdivide as zigzags within an ending diagonal. Also, the fourth wave must overlap first wave price territory but may not move beyond the end of the second wave. For expanding diagonals, the final fifth wave often ends short of the 1-3 trend line. So far this structure has a typical look and meets all rules.
A cyan trend line is drawn across the first two swing lows within this short upwards wave. When price breaks below that line, it would provide the very earliest indication of a possible trend change.
If price breaks back below the dark blue line, more confidence may be had in a trend change.
Thereafter, reasonable confidence may be had if price makes a new low below 1,227.93. This is the high labelled subminuette wave a within minuette wave (v). At that stage, downwards movement could not be a fourth wave correction within an impulse unfolding upwards, so at that stage the upwards wave labelled minuette wave (v) would have to be over.
The target remains at 1,131 where intermediate wave (2) would reach the 0.618 Fibonacci ratio of intermediate wave (1).
ALTERNATE DAILY ELLIOTT WAVE COUNT
Click chart to enlarge.
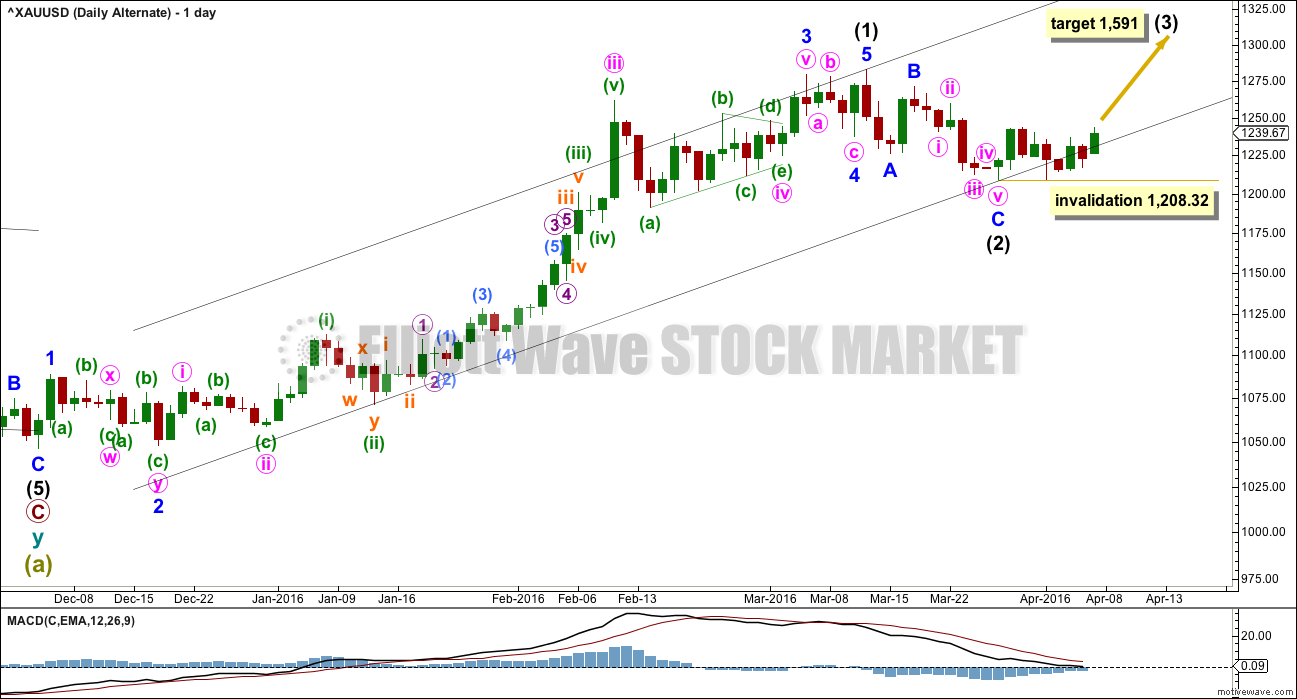
It is technically possible but highly unlikely that intermediate wave (2) is over. This wave count requires confirmation with a five up on the hourly chart for confidence. A new high is not confirmation of this wave count.
If intermediate wave (2) is over, then it is a very brief and shallow 0.31 zigzag lasting only eleven days (intermediate wave (1) lasted 69 days). The probability of this is very low.
At 1,591 intermediate wave (3) would reach 1.618 the length of intermediate wave (1).
Within intermediate wave (3), no second wave correction may move beyond its start below 1,208.32.
I do not want to give too much weight to this alternate by publishing an hourly chart.
TECHNICAL ANALYSIS
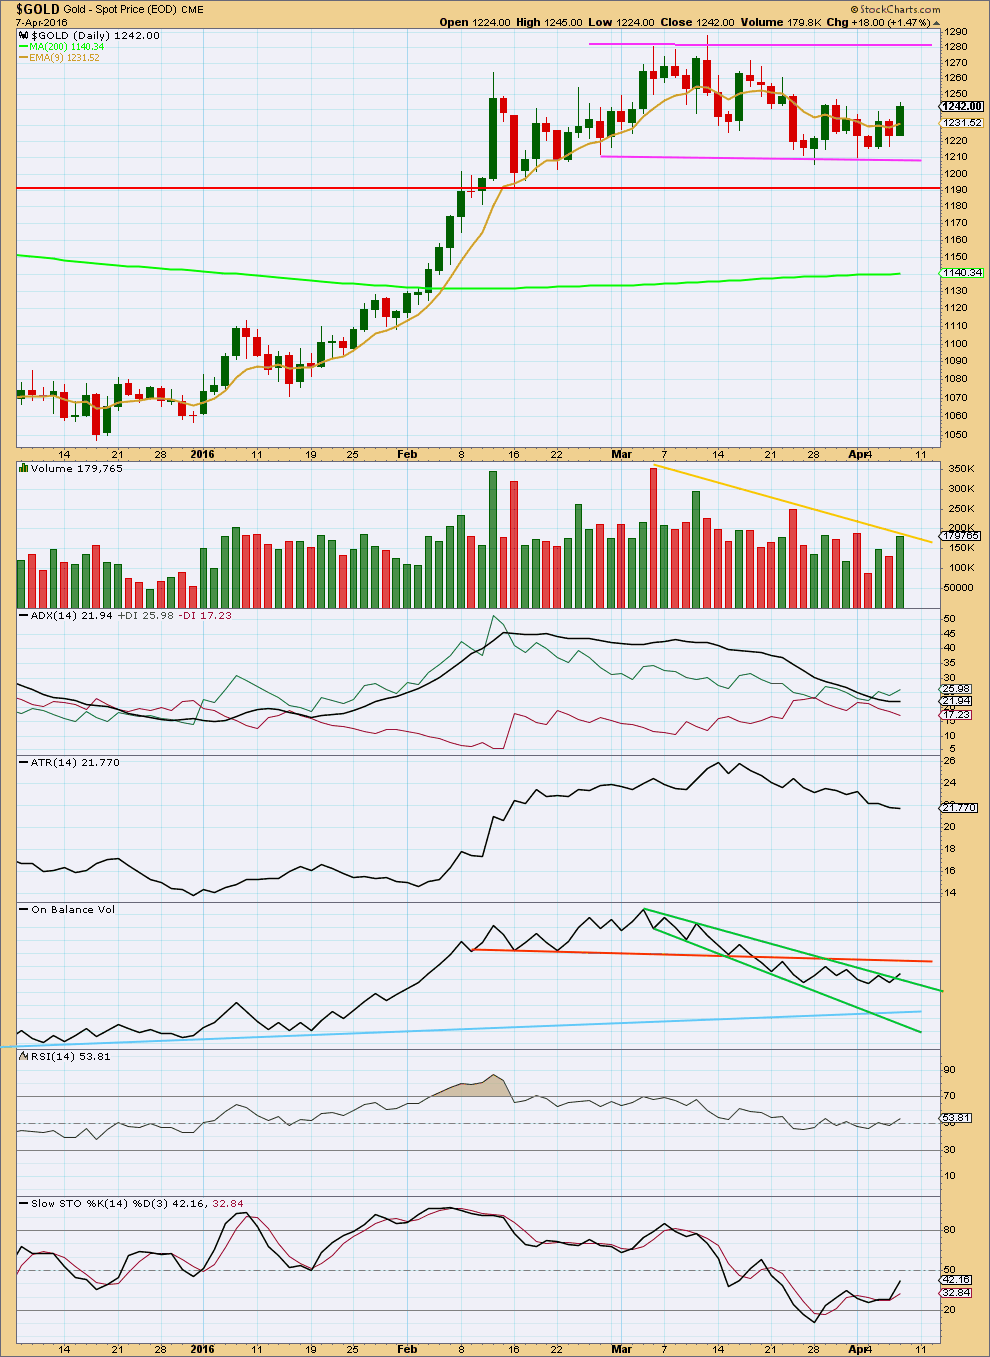
Click chart to enlarge. Chart courtesy of StockCharts.com.
Price is range bound between the pink trend lines, moving sideways. The upper edge is about 1,280 and the lower edge is about 1,210. It should be expected that price will swing from resistance to support and back again, eventually breaking out of the range for the next trend. Only experienced traders should attempt to trade this market while price remains range bound. The rest of us should wait for the next trend to emerge and then join it.
There was support for the upwards movement in price today by volume, but overall during this consolidation volume continues to decline. This indicates that price may yet continue higher to resistance.
Stochastics is returning from oversold and price is returning from support. The upwards swing from this approach would be expected to continue until price finds resistance and Stocahstics is overbought.
Ignoring the Elliott wave count which sees the end of the last wave up on 4th March, it is difficult to accurately state on which day price entered this current sideways trend. It could be as early as 12th February or as late as 14th March. The earlier date seems more reasonable.
If an earlier date is accepted, then during this sideways movement it is a downwards day which has strongest volume. This indicates a downwards breakout is more likely than upwards, which supports the main Elliott wave count.
ADX is today flat indicating the market is still not trending. ATR continues to decline, so these two are in agreement.
RSI is neutral. There is room for price to rise or fall.
On Balance Volume has today broken above the upper green line. This is a weak bullish signal. Weak because this line does not have strong technical significance, but it is still a bullish signal. The orange line on OBV has stronger technical significance because it is horizontal, longer held and more often tested. This is the next line of resistance for OBV. If OBV comes up to touch that line, that may be when upwards movement of price ends if it continues from here. If OBV turns down and breaks below the upper green line, then that line should be discarded.
This analysis is published @ 07:37 p.m. EST.
Lara is gold still bearish now?
I’m sorry Richard, I can see two possibilities, equally likely.
The last zigzag of the ending diagonal could move higher. The downwards wave last session could have been wave B within it.
Or it could be as the hourly chart outlines, the start of minor wave Y down.
To have clarity we need a new low below 1,217.22. At that stage minute c ending diagonal would definitely be over. And minor wave Y would be underway.
Maybe today’s high at 1242.83 at 1:44 pm was a 2nd wave retrace of Thursday’s high of 1243.37 at 9:44 am?
Maybe the high of 1242.66 at 3:47 pm was a 2nd wave retrace back up of today’s high of 1242.83?
At 3:47 pm gold started dropping quickly, perhaps those are 3 bearish signals?
I still have a little DUST from Thursday’s low.
Perhaps I’ll keep my DUST.
At this time today’s gold high was at 1242.83 at 1:44 pm.
Thursday’s gold high was 1243.37 at 9:44 am.
Maybe a 2nd wave back up may have ended at 1242.83, it may or may not be complete.
Any wave counts to today’s high?
Maannnnn so much of distribution is going on in gold since last 10days…its getting hard to judge these waves..terrible…this movement no ways support int 3…this is distribution pattern before a fall..i strongly believe that…but i want lara to comment on this and also give a price point to diffrentiate between main and alt count..thank u. 🙂
There is no price point between the main and alternate charts, other than (confidence below $1227.93) shown on the main hourly chart and in the analysis, which provides price point confirmation the 3rd level of confidence of a down trend.
There are no upper invalidation points, however there is also a lower invalidation point of 1208.32 for the Daily alternate chart if you want to wait that long, which I doubt.
Small short position i had made today..
Lara though int 3 is highly unlikely..but what is the price point where we can diffrentiate it
The dark blue channel is a best fit. If price returns to within the channel, then it should again show where upwards corrections find resistance.
It is possible that minor wave X may continue higher and be deeper. There is no upper invalidation point for minor wave X; X waves may make new price extremes beyond the start of the first structure in the double. If minor wave X continues higher, then intermediate wave (2) would more likely be a combination than a double zigzag. They are very different structures.
A cyan trend line is drawn across the first two swing lows within this short upwards wave. When price breaks below that line, it would provide the very earliest indication of a possible trend change. If price breaks back below the dark blue line, more confidence may be had in a trend change. Thereafter, reasonable confidence may be had if price makes a new low below 1,227.93.
Great Richard!! So gold is almost ready to go down once it drops below blue line.
$1,227.93 is basically at the blue line area (hard to know exact point of the line) and $1,227.93 provides price confirmation, which is the 3rd level of confirming the trend change is down. That would be a clear bearish signal in my opinion.
I’m looking at today and if gold stays under yesterday’s high of $1,243.37 at 9:44 am on pmbull.com
I am looking for a high above yesterday’s 1245 on the June Comex gold contract to confirm (somewhat) taht we will contyinue up in itermediate wave 3. Stephen C.
I do believe we have seen tne bottom of intermediate 2 at 1204.7 on the june gold Comex futures. We are now therefor in a small ,or minute wave up in tghe first wave of a n intermediate third wave. Although not likely (per Lara) the possibility does exist and is shown by Lara. I would not be short unless we drop below 1227 as lara suggests. However I think the probability of being now in as third wave is quite high, given the fundamentals in the world today to the 1976 time frame. IMHO Stephen C.
So far we only have the first indication of a possible trend change as gold dropped down to an over night low of 1,229.68 at 6:15 am which is below the cyan trend line. However gold did at that point bounce off the dark blue trend line providing support.
“A cyan trend line is drawn across the first two swing lows within this short upwards wave. When price breaks below that line, it would provide the very earliest indication of a possible trend change. If price breaks back below the dark blue line, more confidence may be had in a trend change. Thereafter, reasonable confidence may be had if price makes a new low below 1,227.93.”
Any wave counts?
I believe that gold had a 5 wave count from yesterday’s gold high of 1243.37 at 9:44 am down to 1,229.68 at 6:15 am and was retracing back up at and was moving up at the open with bullish signals in many time frames for gold and GDX so miners surged and DUST dropped.
Hopefully the high this morning of 1240.11 at 10:03 am was the top of a second wave retrace and gold may drop from here down today.
May be wishful thinking as many indicators still have gold and GDX s bullish in several time frames.
In my mind your long X wave possibility or a third wave is more likely based on what I am seeing in the miners. Many I follow are in bullish patterns, anticipating or already in some serious upward movement. I’m long some of them (although with some tight stops, just in case). There is a real risk of being left out in the cold if this is a third wave up.
I have a screening tool that I use to identify stocks in bullish trends, meeting some other requirements. What is interesting is that almost all of the top 20 (listed by today’s volume) are gold and silver miners, all rising on very heavy volume. I think they may be telling us something.
Have some reservations about price moving lower based on the miners I own as well. Very firm price action recently.
Attached file of the 76 bottom shows a shallow correction above the previous swing high. So the alt is possible if history repeats.
That’s an interesting chart, stuart. Most of those corrections don’t make it anywhere near the fourth wave one degree lower, which is the usual expectation.
As a gold stock investor for almost 20 years take it from me at critical junctures the miners always lead. Based on the follow through today this is not a market I would be looking to short.
As a gold ,and siver ,stock investor for over 40 years I am in agreement that I would not be short this market Stephen C. ( There is another stephen on this site ,but not me).
Thanks for the interesting chart. Miners certainly got pumped up these last 2 days. Also Gold has been going up since the open which really pumps up miners still adjusting to a higher gold price for Thursday and Friday.
However, I’d feel more comfortable with a strong bullish buy signal if the buy crossover happened a little lower like mid on the MACD and at the 20 on the Full Sto indicators. However I may be wrong.
Let’s see how today ends and if gold makes a new high or doesn’t make a new high over Thursday’s high of 1,243.37 and retraces below the cyan trend line again like overnight and towards the dark blue line?