
Again, the main Elliott wave count expected downwards movement which is not what happened.
A new high above 17.483 indicated more upwards movement instead. The target at that stage was 18.928. So far price has reached up to 17.72.
Summary: A blowoff top today indicates upwards movement is most likely to be over. Silver is due a larger correction. The most likely target would be 14.863. This view is strongly supported by this week’s classic technical analysis.
New updates to this analysis are in bold.
WEEKLY WAVE COUNT
Click chart to enlarge.
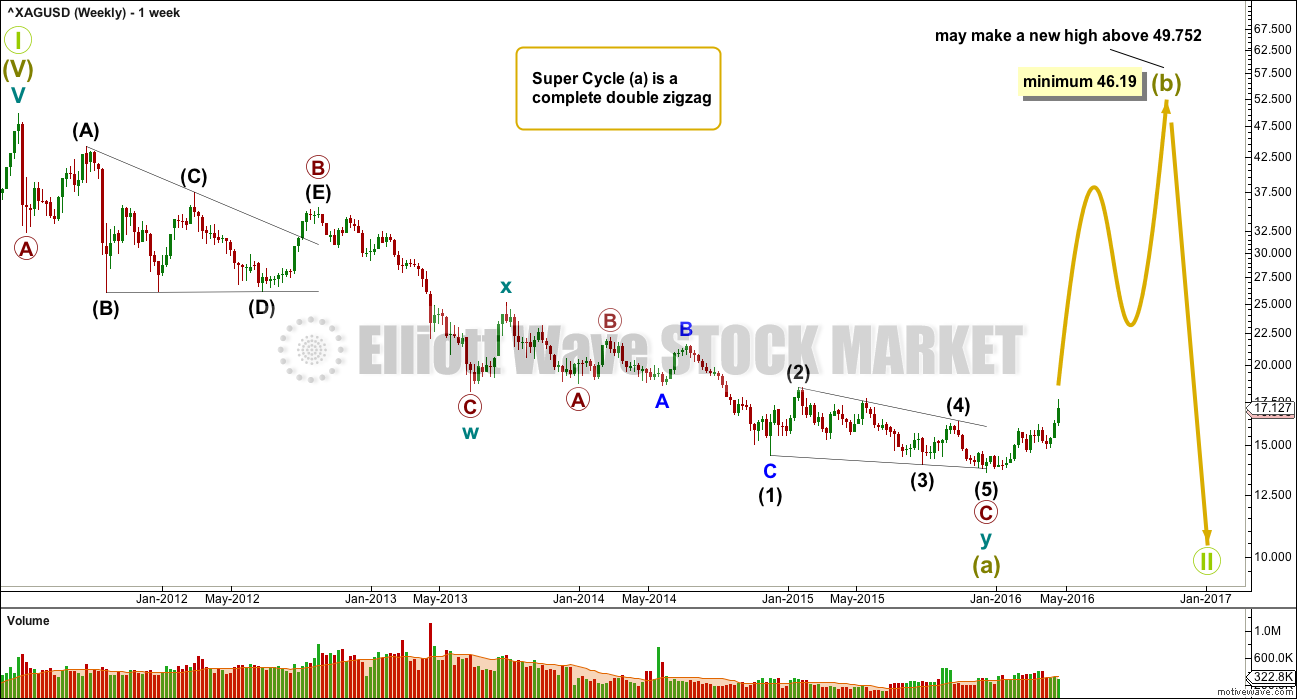
If super cycle wave (a) is a double zigzag, then within the second zigzag of the double labelled cycle wave y the structure may be complete.
Primary wave C is an ending contracting diagonal within the zigzag of cycle wave y. All subwaves subdivide as zigzags. The third wave is shorter than the first, the fifth wave is shorter than the third, and the fourth wave is shorter than the second. The trend lines converge.
There is a small overshoot of the (1)-(3) trend line at the end. This indicates the contracting diagonal structure is very likely to be complete.
If this wave count is correct, then super cycle wave (a) has subdivided as a three wave structure. That indicates Grand Super Cycle wave II may be a flat correction.
If this correction at Grand Super Cycle is a second wave (as opposed to a fourth wave), then a triangle may be eliminated.
A combination may also be eliminated because the first wave is a multiple. Combinations may only consist of a maximum of three corrective structures, so within each of W, Y and Z they may only subdivide into simple A-B-C structures (or A-B-C-D-E in the case of triangles). To label multiples within multiples increases the maximum beyond three, violating the rule.
Super Cycle wave (b) must retrace a minimum 90% of super cycle wave (a) at 46.19. Super cycle wave (b) may make a new price extreme beyond that seen for super cycle wave (a) above 49.752 as in an expanded flat.
Super cycle wave (b) may be any one of 23 possible corrective structures. It is impossible to predict at this early stage which one it will be, only to say it is unlikely to be a rare structure such as a running flat, expanding triangle or triple combination. That still leaves multiple structural possibilities. The most likely structure which would be able to meet the minimum price requirement at 23.945 is a zigzag.
The first movement up for a wave of this large degree must subdivide as a clear five at the daily chart level, and probably at the weekly chart level also.
DAILY WAVE COUNT
Click chart to enlarge.
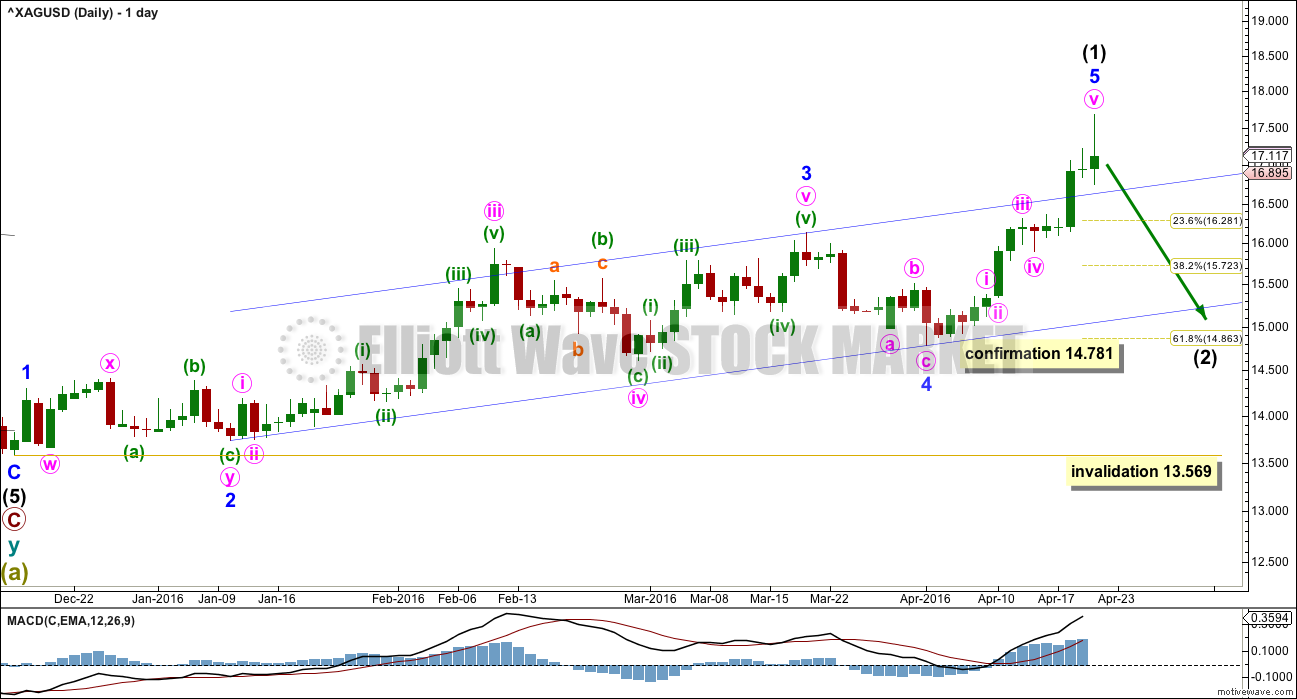
Last analysis expected intermediate wave (1) was over earlier, at the high now labelled minor wave 3. Further upwards movement looks like a typical fifth wave with a blowoff top though, so intermediate wave (1) looks like it continued higher.
Draw a channel about intermediate wave (1) using Elliott’s second technique: draw the first trend line from the ends of minor waves 2 to 4, then place a parallel copy on the end of minor wave 3. The end of minute wave iii overshoots the channel, which is typical for the middle of a third wave. The fifth wave of minor 5 also overshoots the channel, which is typical of a swift strong fifth wave in commodities. This wave count has a typical look.
Intermediate wave (1) lasted 90 days, one longer than a Fibonacci 89. Intermediate wave (2) may be expected to most likely last either a Fibonacci 34, 55, 89 or maybe even 144 days. It is most likely to end about the 0.618 Fibonacci ratio of intermediate wave (1) about 14.863.
Intermediate wave (2) may not move beyond the start of intermediate wave (1) below 13.569.
The alternate will not be published this week because although it was not invalidated its structure no longer has the right look. The upwards wave labelled here minor wave 5 is such a swift strong movement, the probability that this is a fifth wave to end an impulse is very high.
TECHNICAL ANALYSIS
DAILY CHART
Click chart to enlarge. Chart courtesy of StockCharts.com.
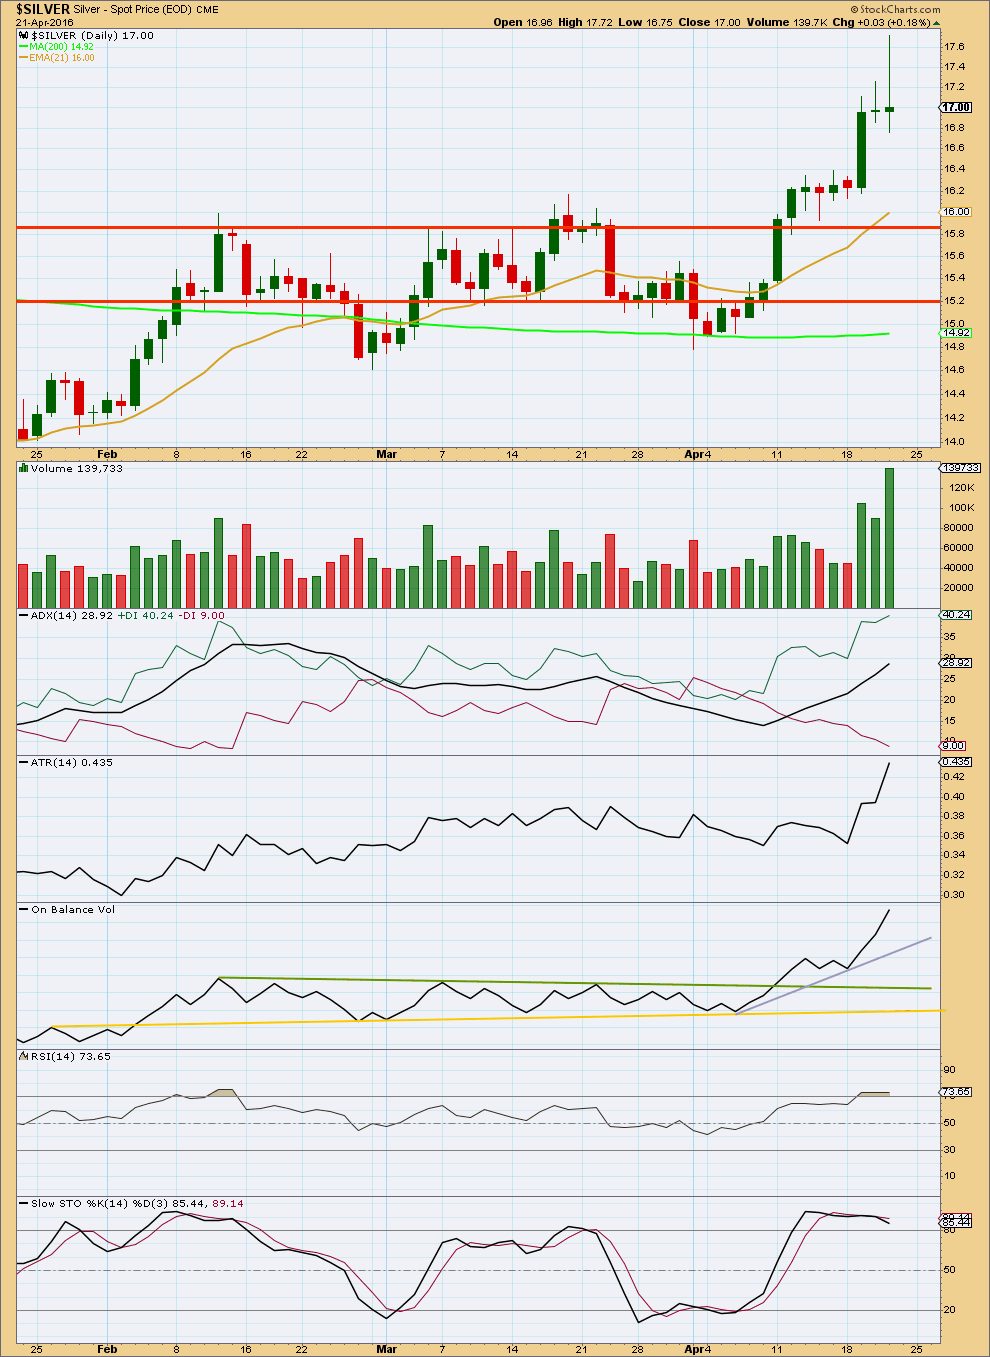
Three green daily candlesticks in a row on increasing volume supports the upwards movement in price. The volume spike for 21st April looks like a typical blowoff top. The long upper shadow on the doji candlestick for the 21st of April looks bearish. Overall, downward movement would be expected from here as very likely.
ADX is increasing indicating an upwards trend is in place. ATR agrees as it too is increasing. Both these indicators are lagging as they are based on 14 day moving averages.
On Balance Volume so far is bullish, breaking above the green line. A break below the grey line would be a weak bearish signal. A break below the green and yellow lines would be a strong bearish signal from OBV.
For three days in a row, RSI failed to make corresponding highs while price made new highs. RSI remained flat. This is a bearish indicator supporting the view that upwards movement is over.
Stochastics shows divergence from 13th April to 21st April. This also is bearish, so some downwards movement would be expected here or soon.
This analysis is published @ 12:46 a.m. EST on 22th April, 2016.
Hello Lara,
Can you offer your thoughts on why you think there are differences from your daily elliott wave count to the one I have sourced from elsewhere?
Many many thanks!
Both counts are valid imho (I would need to check the sub divisions on a 5 min chart to see if the triangle on your chart looks valid – that is the main difference between the 2 counts – on your daily chart it seems to be missing waves D & E).
Lara’s count requires a move below 14.78 for confirmation – that would invalidate your chart and prove Lara’s so that is the line in the sand imho.
If we retrace around 61.8% then make new highs, I would suspect the count shown on your chart would be correct.
Hi Lara, I am wondering is there any particular reasons that lead to a definite target for silver $46.99 on the weekly chart? I am impressed of seeing that as you haven’t labeled a definite target for gold. Thanks for your help as always! 🙂
As wave A is a 3 wave structure, it is suggesting the structure will be a flat (3-3-5). A flat correction requires wave B retrace at least 90% of wave A hence the minimum target albeit it is very common for wave B to retrace more then 100% of A (expanded flat) so can make new highs.
Wave B in a flat does not have a limit, but convention is to discard the count when wave B is greater than 2 x Wave A as the probability that the count is correct reduces significantly.
The same is true for Gold – it should retrace at least 90% of Wave A and may even make new all time highs.