
Last week’s main Elliott wave count expected upwards movement to end soon and be followed by some downwards movement. This is what has happened so far.
Summary: The alternate wave count is invalidated. Only one wave count is left. The target for downwards movement is now a range from 31.85 to 31.21. It is highly likely that downwards movement will at least make a new low below 35.25.
New updates to this analysis are in bold
MONTHLY ELLIOTT WAVE COUNT
Click chart to enlarge.
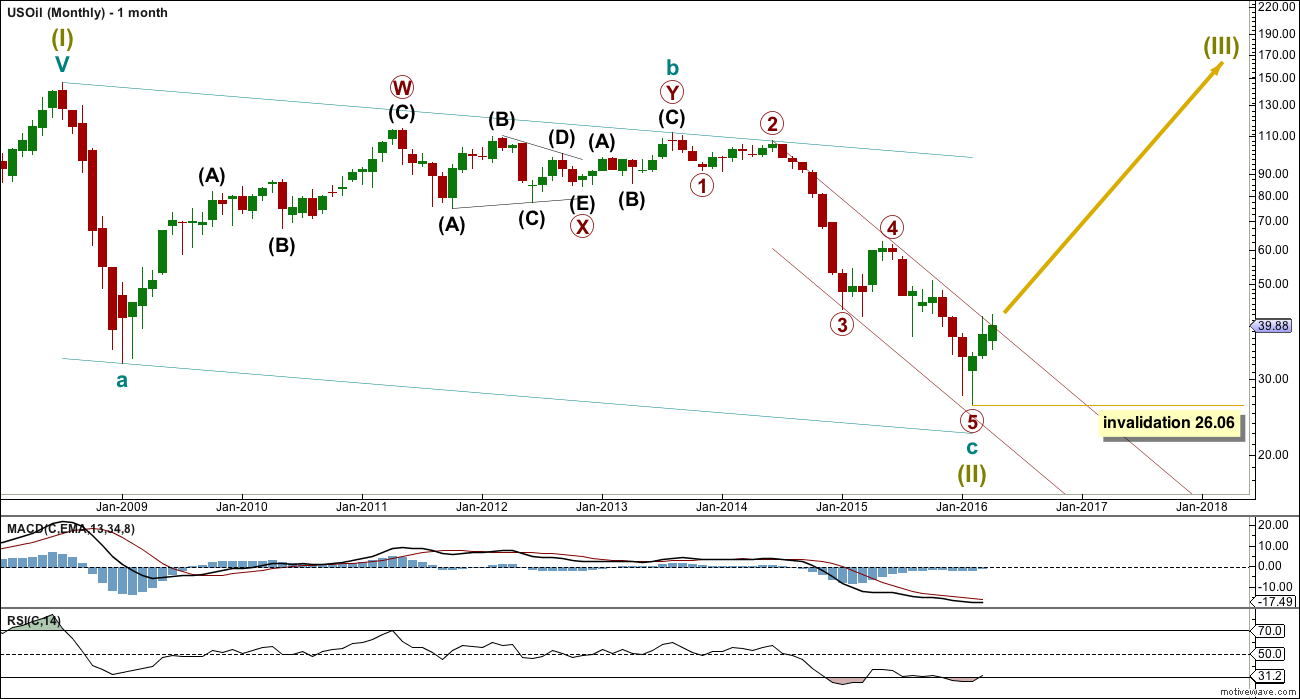
US Oil has been in a bear market since August 2013. While price remains below the upper edge of the maroon channel drawn here and below the 200 day simple moving average it must be accepted that the bear market most likely remains intact. Price has turned back down from the 200 day moving average and back into the maroon channel.
The structure of primary wave 5 may be complete. This wave count has a problem though: primary wave 5 looks like a three wave structure at the monthly chart level. It may only subdivide as a five.
If primary wave 5 is complete, then the zigzag of Super Cycle wave (II) would also be complete. Super Cycle wave (III) must move above the end of Super Cycle wave (I) at 146.76. Within Super Cycle wave (III), no second wave correction may move beyond the start of its first wave below 26.06.
DAILY ELLIOTT WAVE COUNT
Click chart to enlarge.
This wave count is identical to the alternate below up to the high labelled intermediate wave (2).
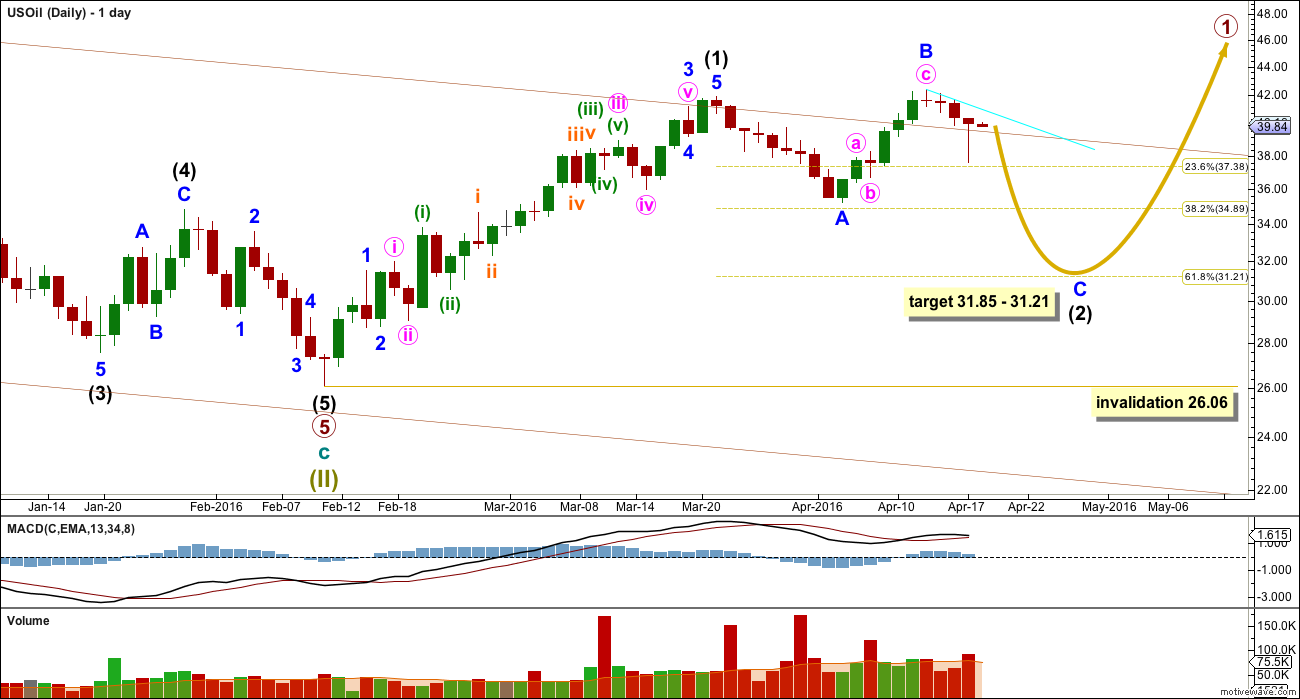
The maroon channel is slightly redrawn. Draw the first trend line from the end of primary waves 2 to the first swing high after primary wave 4 at 61.57, on 24th June, 2015. This upper trend line may show where price is currently finding support. When price breaks below this line, it may then throwback to find resistance. If that happens, it may offer a good opportunity to join the short term downwards trend.
If Super Cycle wave (II) is a complete zigzag, then Super Cycle wave (III) must begin upwards. So far intermediate wave (1) may now be complete as an impulse.
Intermediate wave (1) lasted 28 days (not a Fibonacci number). Intermediate wave (2) should last longer; corrections are usually more time consuming than impulses, particularly first wave impulses. Intermediate wave (2) is most likely to be a zigzag and most likely to end about the 0.618 Fibonacci ratio at 31.21.
Minor wave B looks like a three wave structure and is a 1.1 length of minor wave A. This indicates intermediate wave (2) may be unfolding as a very common expanded flat correction. At 31.85 minor wave C would reach 1.618 the length of minor wave A. This is somewhat close to the 0.618 Fibonacci ratio at 31.21.
Minor wave C is highly likely to make at least a slight new low below the end of minor wave A at 35.25 to avoid a truncation and a very rare running flat.
Draw a trend line (shown in cyan) from the last high across the first two daily highs. Along the way down, upwards corrections may find resistance at this line, if price can get that high again.
Intermediate wave (2) may not move beyond the start of intermediate wave (1) below 26.06.
It is possible but fairly unlikely that intermediate wave (2) is over at the low labelled minor wave A. It would be more brief and shallow than second wave corrections normally are, but it is possible. If upwards movement continues to be strong and shows an increase in volume, then this possibility would increase in probability.
TECHNICAL ANALYSIS
MONTHLY CHART
Click chart to enlarge. Chart courtesy of StockCharts.com.
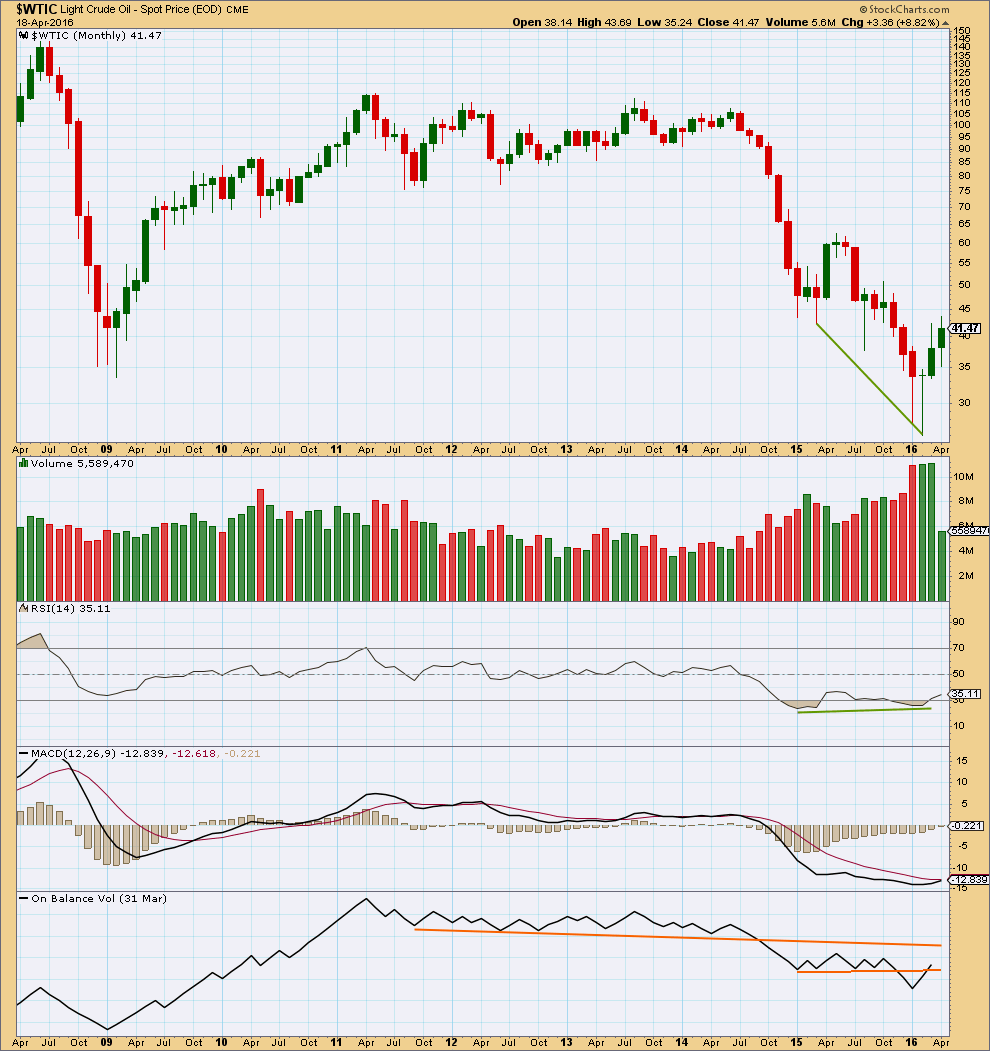
Price shows divergence with RSI as price moved lower.
The fall in price was supported by volume. The rise in price from the low in February is supported by volume. This favours the main wave count.
The three monthly candlesticks for January, February and March create a Morning Doji Star reversal pattern. However, this is a warning of a trend change and not definitive. There is an example of a stronger candlestick reversal pattern on this monthly chart for March and April 2015. April 2015 completed a bullish engulfing candlestick pattern; this is the strongest reversal pattern and this example was particularly strong. Yet it only translated to one more month of slight new highs in May before the downwards trend resumed.
On Balance Volume has broken below two trend lines. OBV is beginning to break above the lower line. If the month of April can close with OBV above the lower orange line, that would be a reasonably strong bullish signal in support of the main Elliott wave count.
DAILY CHART
Click chart to enlarge. Chart courtesy of StockCharts.com.
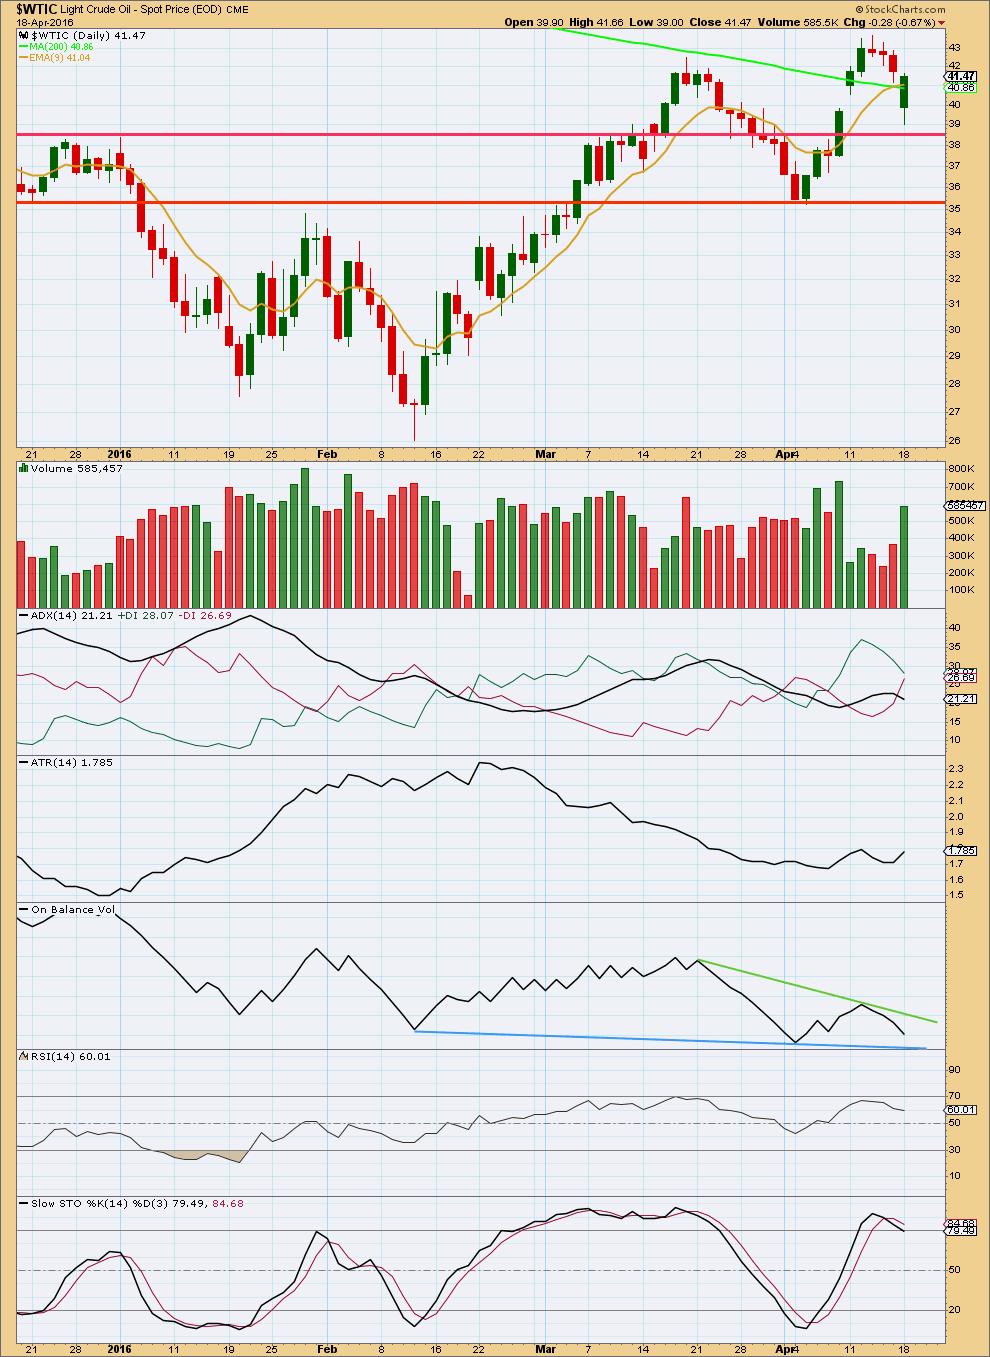
The possible breakaway gap after price broke above the upper horizontal trend line about 38.60 is now closed. What looked like a possible upwards breakout last week is now looking like a false breakout. Price may find some support about 38.60 before it moves lower.
WTI Crude spot price data on StockCharts does not include after hours data. This means what looks like a red hammer on FXCM data is a green candlestick on StockCharts data.
The green candlestick for Monday’s session is bullish, but this is not enough to indicate a trend change. This strong green candlestick does not support the Elliott wave count.
ADX is declining, indicating the market is not currently trending. ATR is overall flat, mostly in agreement with ADX.
On Balance Volume is moving lower and may find support at the blue trend line. If OBV breaks below that blue line, it would be a reasonable bearish indicator. If OBV breaks above the green line, it would be a weak bullish indicator.
There is negative bearish divergence between RSI and price at the last high; price has made a slight new high above the prior swing high of 18th March, but RSI has failed to make a corresponding new high. This supports the Elliott wave count.
Stochastics also exhibits negative bearish divergence with price. Stochastics has reached overbought. As the market is not trending, a downwards swing may be expected from here to continue until Stochastics reaches oversold.
This analysis is published @ 12:01 a.m. EST on 19th April, 2016.
quick look at XM’s chart (quite different from others), the 5 waves shape is simply amazing. wave 3 is about 200% of wave 1, and 4 missed 1 by a small 44 pips.
Most data feeds show the low on Feb 10 (labeled 2) on this chart, as being lower than the low in January (shown as the start of 1 on this chart. I can’t see where the low is for 2 on this chart because of the 2 and the vertical line. Based on other data feeds, this count would be invalid as wave 2 would end below the start of wave 1.
It’s 28.7, sorry for “covering up” the bottom of wave 2
Lara, EWI has a free open house this week, so hope you don’t mind this being posted here. This analysis by Steve Craig offers a significantly different count. What are your thoughts? Thanks.
I think it is a most excellent count. I’m charting it and will present it next analysis here.
Short term I’d still rather label a B wave expanded flat incomplete though. If price breaks below 42.42 short term that view wold be supported.
But it is also possible that a C wave up for a zigzag is underway. My problem with that is the depth and duration of the second wave correction within it. It looks a bit out of proportion.
But the bigger picture for this wave count is excellent, it all fits really well and resolves a problem I had with my count at the monthly chart level.
Thank you for sharing! I don’t normally go to EWI to look at their wave counts.
Thanks Lara. Always appreciate that you are open to other ideas.
Minor B looks like it’s moved higher.
I would still expect it’s unlikely intermediate (2) was over at the low labelled minor A. That would be a very quick shallow correction for a big second wave to have.
Use the pink channel about minor B; when it’s breached to the downside then it would be providing confirmation of a trend change. If price throws back up to the line to find resistance it would offer a good entry to join the trend down for minor C.
Prior to that if you have a higher risk appetite: if we see a strong downwards day with an increase in volume then draw a trend line along the upper edge of the downwards movement and use that to find an entry. This is riskier though; it would be trying to pick a top. The risk is price could yet move higher before minor B is done.
Following on the suggestion by Daniel that the highs today are the end of Minor wave B of an expanded flat, I offer the following wave count for where we are today in Intermediate (2).
Minute b) retraced about .618 of minute a) (orange Fibonacci level on the chart). Wave B wave in an expanded flat commonly reaches 1.236 or 1.382 X wave A. As Minor B has already exceeded the 1.236 level (green) it might stop at the 1.382 level (red) or about $44.43.
Wave C in an expanded flat is commonly 1.618 X wave A, so if wave B does indeed stop at about the 1.382 level, then Minor C would likely have a target near $33.77 (blue). This is also near the 50% retracement of Intermediate (1) at $33.96 (black).
Comments are invited.
Yep. That’s pretty much what I have come up with also.
Lara…now where can we take a short entry in crude..??
answered above
Any wave count for oil??
chart above
New high now may be expanded flat B wave completing while recent high on April13 was a wave a of a-b-c.
US Oil is trading at 40.35 and it bottom at 37.65 yesterday. Filling the gap.
On Finviz.com oil spot is 41.64. Like Dreamer wrote both Finviz and stockcharts.com switched to June contract prices.
This distorts technical analysis. on charts shows breakout but there is really not a breakout?????
How does this pricing changes affect EW analysis?????
Lara, Stockcharts rolled their Spot price to the June contract last Monday, the 11th. That is what caused the “possible breakaway” gap on their chart.
Based on my research and post below, there is no reason for stockcharts to switch to the June contract for spot price over 1 week early. They are confusing people.
As you can see, FXCM is still using the May contract as the spot price. FXCM will likely switch to the June contract by Tuesday (since the June contract now has more volume than May), but as stated below, the official CME Group contract expiration for May is 4/20.
so why wouldnt you buy fxcm….as it is guaranteed to go up?
Reposted since I posted it late on the previous analysis.
I found this article that explains “spot” (cash) prices and how they relate to futures price. This is a gold site, but it works the same for oil.
http://www.jmbullion.com/investing-guide/pricing-payments/spot-prices/
This line is important “The spot price is determined by the front month futures contract with the most volume. Sometimes this contract may be the current month, and sometimes it may be two months or more out in time.”
From my own observations of Oil, the front month of the futures price usually equals the spot or cash price for oil as it has the most volume. As the official expiration date for the front month futures contract nears, the next month may have more volume and therefore becomes the new spot or cash price before the official expiration date. Different sites still “roll” on different dates, which is the confusing part and the part that I can’t explain. You would think they would all follow the same basic rules to reflect the spot price.
My other post below refers to the CME group official futures pricing. The official date for the CL crude oil May contract to expire is 4/20: however, the volume for the June contract exceeded the May contract on Monday, 4/18. Therefore, most sites already reflect the June futures price as the spot or “cash” price as of 4/18, Monday, 2 days before the official expiration date. I hope this helps.