
A little downwards movement was expected from yesterday’s hourly Elliott wave count to end about either 1,270.53 or 1,265.46.
So far price has moved lower to 1,263.
Summary: It is still likely that a third wave upwards is in the very early stages. The target remains at 1,477. Risk remains at 1,237.97. The wave count is supported by volume analysis. Downwards corrections present an opportunity to join the trend at a good price.
New updates to this analysis are in bold.
Last published weekly chart is here.
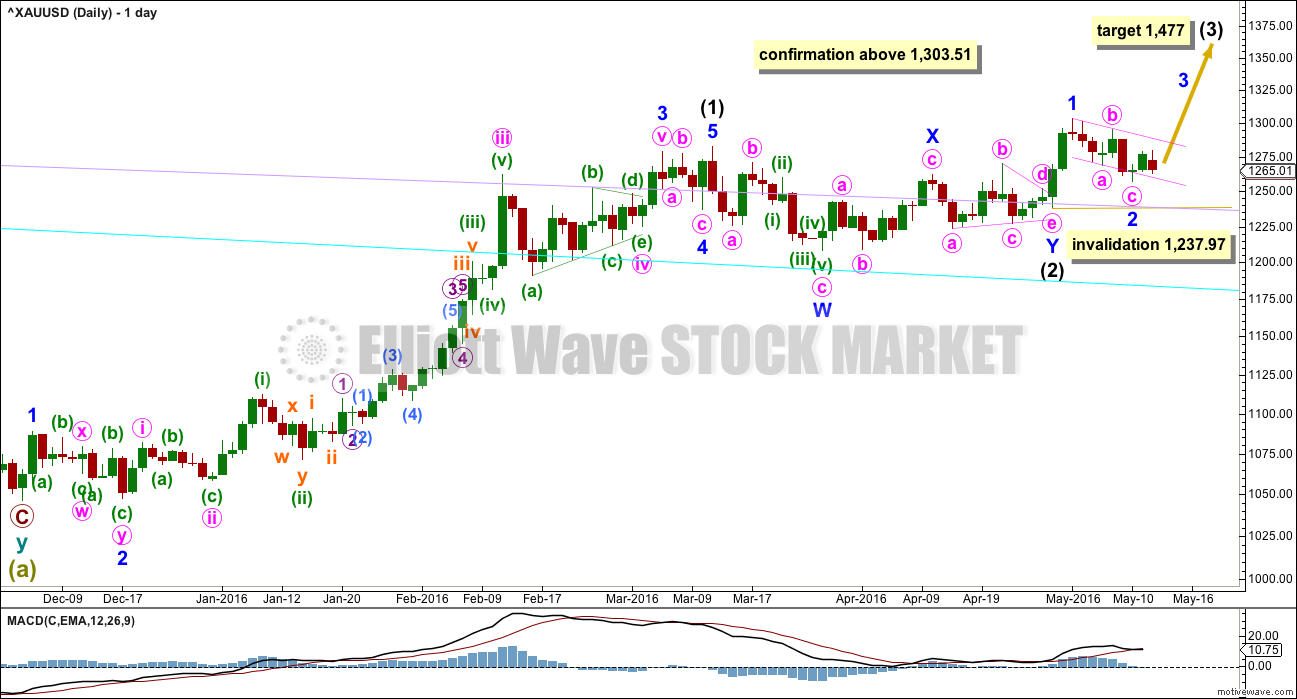
DAILY ELLIOTT WAVE COUNT
Click chart to enlarge.
Intermediate wave (2) may be a double combination.
Minor wave W is a zigzag, the first structure in a double. The two structures in the double may be joined by a simple zigzag for minor wave X in the opposite direction.
Minor wave Y may be a running contracting triangle. The triangle is supported by MACD hovering at the zero line here on the daily chart.
Minor wave 2 may not move beyond the start of minor wave 1 below 1,237.97.
The next wave up for intermediate wave (3) should be swift and strong. It must move above the end of intermediate wave (1) at 1,282.68. It must move far enough above this point to allow room for intermediate wave (4) to unfold and remain above intermediate wave (1) price territory.
At 1,477 it would reach equality in length with intermediate wave (1). This target is reasonable because intermediate wave (2) was very shallow.
If intermediate wave (2) is over as labelled, then it may have totalled a Fibonacci 34 sessions.
Minor wave 2 has moved lower and is now 0.71 the depth of minor wave 1. Minor wave 1 lasted two days. Minor wave 2 now has lasted six days. If it is over here, it would have good proportion and look like a clear three wave structure on the daily and hourly charts.
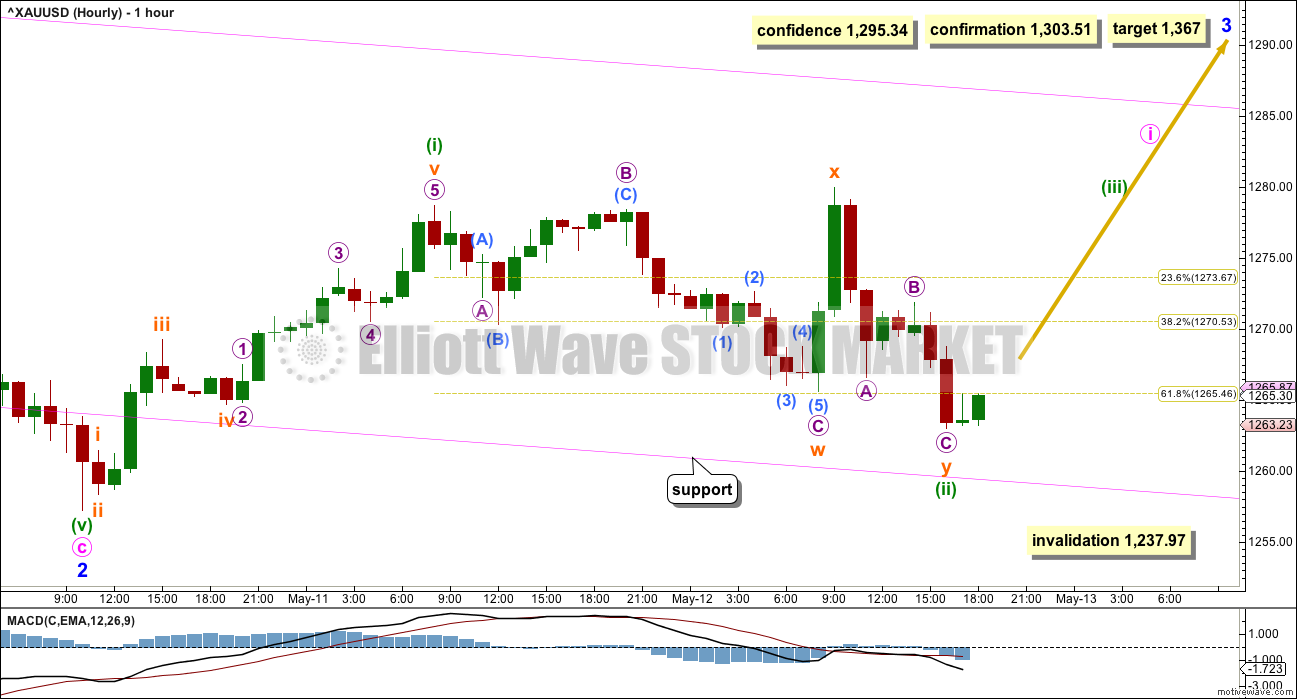
HOURLY ELLIOTT WAVE COUNT
Click chart to enlarge.
Minor wave 2 fits as a zigzag.
Within minute wave i so far, it looks now like the first five up is complete for minuette wave (i). On the five minute chart, subminuette wave iii has strongest momentum and all subdivisions within this impulse fit neatly.
Minuette wave (ii) has moved lower and subdivides as a deep double combination or double zigzag (it will fit as both). The second structure in the double labelled subminuette wave y has ended just below the 0.618 Fibonacci ratio, falling a little short of the lower edge of the pink channel.
What looks fairly clear on this hourly chart is the upwards movement for minuette wave (i) looks like a five, and the downwards / sideways movement for minuette wave (ii) so far looks like a three. With a five up and now a three down, a little more confidence may be had that minor wave 3 has begun. It is still not confirmed by price, and price is the ultimate determinator.
The invalidation point and risk must remain at 1,237.97 while there is no confirmation of a trend change.
Confidence may be had in a trend change with each of these conditions being met, in order:
1. A five up followed by a three down which does not make a new low. This first condition is now met.
2. A breach of the upper edge of the pink channel.
3. A new high above 1,279.99.
4. A new high above 1,303.51. This will be final confirmation.
Depending upon risk appetite, members may choose to wait for one or more of these conditions to be met before entering long. Manage risk carefully. The risk of a loss on a long position here must be accepted. The alternate wave count does remain viable, although unlikely. Do not invest more than 3-5% of equity on any one trade, and always use a stop loss to protect your account.
At 1,367 minor wave 3 would reach 1.618 the length of minor wave 1. If this target is wrong, it may be too low. The next possible target would be at 2.618 the length of minor wave 1 at 1,433.
Minor wave 3 may only subdivide as an impulse. Within the impulse, minute wave i looks likely to have begun. When it arrives minute wave ii may also be deep and may also be time consuming.
It would not be until the middle that acceleration to the upside may be expected to be clear for minor wave 3. The fourth wave corrections within it may be quick and shallow, and the fifth waves to end minor wave 3 and then the final fifth wave up of minor wave 5 also may be expected to be very strong movements, completing blowoff tops for Gold.
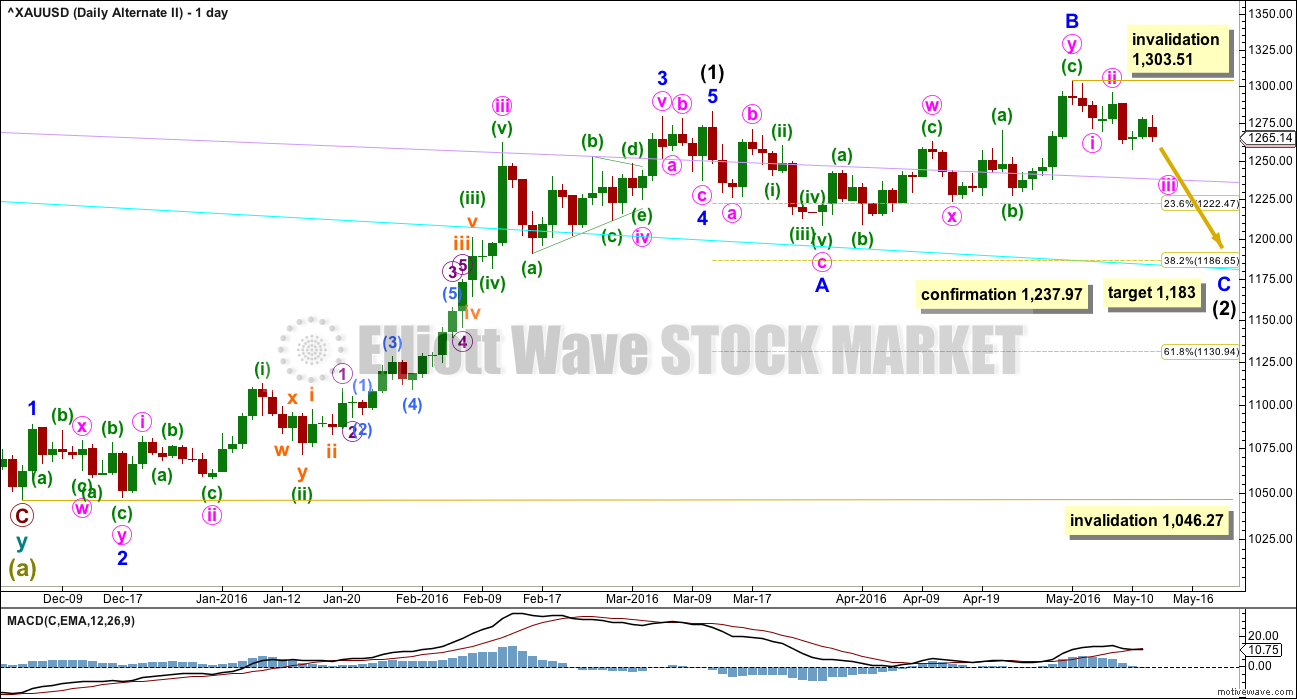
ALTERNATE DAILY ELLIOTT WAVE COUNT
Click chart to enlarge.
It is still possible that intermediate wave (2) is not over. It is my judgement that this alternate is unlikely. If asked to put a number on it, I would give it about a 10% probability. This judgement is based upon classic technical analysis, not Elliott wave.
Normally, the first large second wave correction within a new trend is very deep, often deeper than the 0.618 Fibonacci ratio. The main wave count sees intermediate wave (2) as very shallow at only 0.19 of intermediate wave (1). This is unusual. And so this alternate must be considered.
If any members have long positions on Gold already it is essential that stops are used in case this alternate unfolds.
Intermediate wave (2) may be an expanded flat correction. Minor wave A is a three, minor wave B is a three and a 1.28 length of minor wave A. This is within the normal range of 1 to 1.38.
At 1,183 minor wave C would reach 1.618 the length of minor wave A. This would be the most likely target. If price keeps falling through this first target, then the second target would be at 1,108 where minor wave C would reach 2.618 the length of minor wave A.
Intermediate wave (2) may not move beyond the start of intermediate wave (1) below 1,046.27.
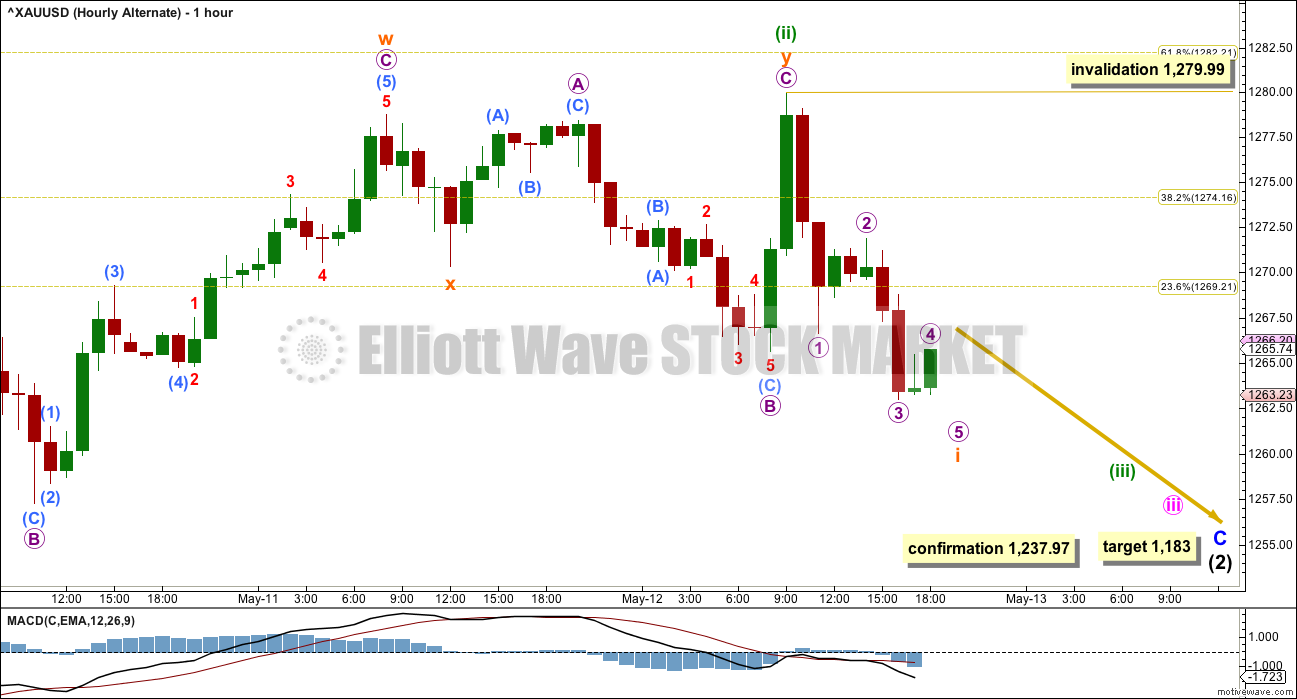
ALTERNATE HOURLY ELLIOTT WAVE COUNT
Click chart to enlarge.
The main purpose in publishing an hourly chart for this alternate is to determine what price points need to be passed to reduce the probability of this alternate and increase the probability of the main wave count.
A secondary purpose is to remain open to considering what this alternate looks like at a lower time frame. Alternates should always be considered; what if the main wave count is wrong? Alternates provide a road map for what should happen next if the main wave count is wrong.
Minor wave C must subdivide as a five wave structure. This may be either an impulse (as labelled) or an ending diagonal (not charted but considered in this analysis).
If minor wave C is unfolding as the more common impulse, then within it there would now be overlapping first and second waves for minute waves i and ii, then minuette waves (i) and (ii). Minuette wave (ii) fits as a sideways double flat correction; the second flat in the double ends very slightly beyond the end of the first flat.
Double flats and combinations are fairly common. Triples are very rare. If this structure of minuette wave (ii) is correct, then it is extremely likely to be over. For it to continue as a very rare triple has a very low probability. Within minuette wave (iii), the fist impulse down of subminuette wave i is incomplete. When subminuette wave i is complete, then the following upwards correction for submineutte wave ii may not move beyond the start of subminuette wave i above 1,279.99.
A new high above 1,279.99 would invalidate an impulse unfolding downwards for minor wave C.
At that stage, the other less common structure of an ending diagonal would need to be considered for this alternate.
All subwaves must subdivide as zigzags within an ending diagonal. To the low of 10th May, downwards movement will subdivide as a 5-3-5 structure, so it may be a complete zigzag (as per labelling on the main daily and hourly wave count). That may be the end of a zigzag for minute wave i, the first wave down of an ending diagonal.
The normal depth of second and fourth waves within diagonals is from 0.66 to 0.81 the prior wave. Minute wave ii of a diagonal would have a normal range of 1,288 to 1,295.
If a diagonal is indicated, then the invalidation point is at where it is placed on the daily chart. Minute ii of a diagonal may not move beyond the start of minute wave i at 1,303.51.
Only a new high above 1,303.51 would fully invalidate this alternate idea at this stage.
TECHNICAL ANALYSIS
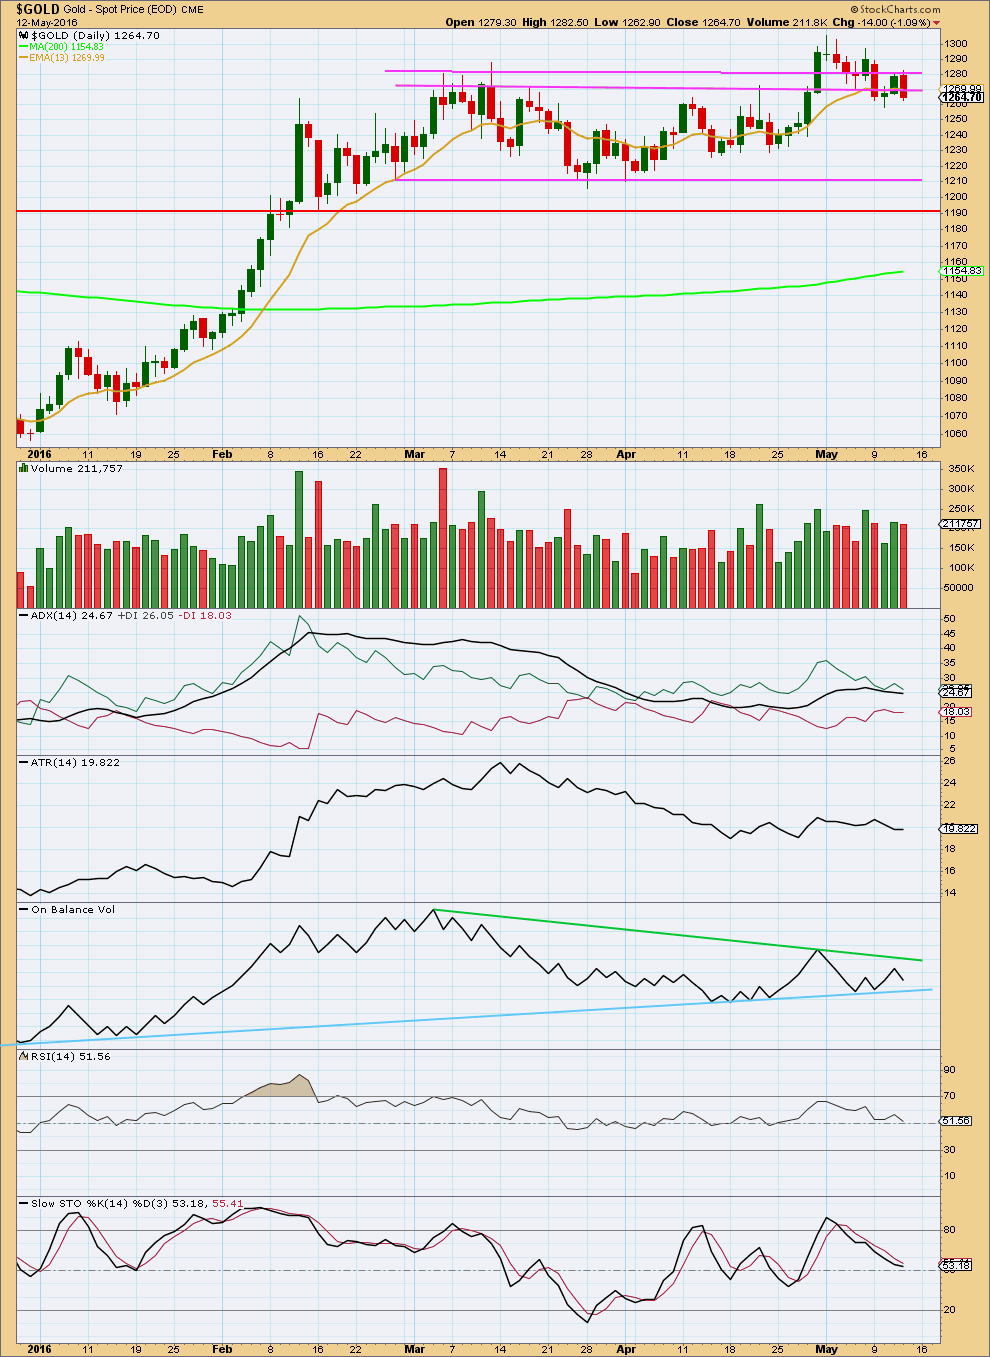
Click chart to enlarge. Chart courtesy of StockCharts.com.
Although today completes a strong bearish engulfing candlestick pattern with StockCharts data at the daily chart level, this pattern has not come at the end of an upwards trend. From Nison’s “Japanese Candlestick Charting Techniques” page 43: “the market has to be in a clearly definable uptrend (for a bearish engulfing pattern)… even if the trend is short term.” It is my judgement that the small green doji before this pattern is not a clearly definable uptrend, not even short term. This pattern comes within an overall sideways movement; price has been moving overall sideways for the last ten days.
In the last several days, it is upwards days which still have strongest volume. As price rises it is supported by rising volume. Today falling price has slightly lighter volume than the prior upwards day. The volume profile for Gold remains predominantly bullish supporting the main Elliott wave count.
ADX is still flat indicating the market is not currently trending. The +DX line remains above the -DX line; ADX is not indicating a trend change. If a trend returns at this stage, it would be upwards.
ATR is still overall flat, in agreement with ADX.
On Balance Volume is constrained between the blue and green trend lines. A break above the green line would be a strong bullish signal. A break below the blue line would be a strong bearish signal. OBV will be watched closely; it often breaks out before price.
RSI is neutral. There is room for price to rise or fall.
Stochastics is also neutral. A range bound approach would expect more downwards movement from here.
Overall, it still looks like Gold completed a consolidation which began late February / early March and ended with an upwards breakout on high volume on 20th April. Following downwards movement looks like a typical throwback to support of the prior consolidation, even though price is reaching slightly back into the consolidation zone. This still looks like fairly typical behaviour after a consolidation. Price may be expected to most likely begin to move up and away from the zone very soon.
This analysis is published @ 07:56 p.m. EST.
Gold futures gain, but still fall nearly 1.7% for the week
http://www.marketwatch.com/story/gold-futures-firm-as-dollar-churns-ahead-of-retail-report-2016-05-13
Dow falls more than 200 points; S&P 500 fights to hold 2016 gain
May 13, 2016 2:49 p.m. ET
S&P 500 year-to-date gains erased
http://www.marketwatch.com/story/pressure-builds-for-us-stocks-as-oil-falls-retail-sales-loom-2016-05-13
Good morning every body 🙂
I’m a bit concerned today about the structure of this movement and the strength of the wave down today.
I am going to look for an alternate to see what if minor 2 isn’t over, what would that look like and how would it subdivide?
However, patience at the beginning of Gold’s impulses is usually a good idea. They do tend to start out slowly.
This one is just excruciatingly slow though.
Maybe Gold is effected by Crude down today and markets down, the Dow is down 200 points 1%.
I was expecting S&P to go down and Gold to go up.
That’s not happening.
That’s the problem with these relationships. They are subject to change.
Lara the big US news today has a huge retail gain that spooked the markets and perhaps gold that the US FED may increase interest rates which is also negative for non interest bearing Gold.
The Central banks this year going with negative interest rates was bullish for gold.
If you believe any of this! Or you believe only in EW or perhaps they are all part of a complex system and we all know EW is the best!
Well, the premise of Elliott wave theory is that it is social mood that moves markets, not news.
Gold at 2:25 just hit a 1,3, and 5 minute upper trend line on pmbull maybe an important wave count just ended and w’re getting more drop?
I’ll be bottom feeding on discount miners at the close with my bottoming trend detectors.
GDX and NUGT peaked at 11:12 am even though gold made higher peaks in the afternoon. It’s because after a two hour brutal drop, then it was a faster and stronger rally up 9 dollars in only 1 hour 15 minutes from the day low versus this afternoon choppy for 3 and 1/2 hours with only a 5 dollar range.
MIners weakening from 1:55 pm even though gold inching slowly a little higher.
Gold is hitting a 10 and 15 minute upper trend line on http://www.pmbull.com where it dropped from Thursday’s high and two highs this morning.
Will it happen again, maybe? before the close like yesterday?
Ah. If the main wave count is correct, this is last wave down for micro 2 of subminuette 3. Micro 2 is an expanded flat, and now submicro c is in progress.
7000 GLD 6/17 $125 calls just hit the tape at $1.32 per contract
Strange there is no time stamp but the volume is certainly included in the daily volume number
Wow, thats a big position.
Alan is this still expected today?
“Target slightly above 1262.”
Hi Richard. Sorry for the late reply. I’m still monitoring the situation, but was away from my computer to take a break due to price consolidation. The critical level is the low of 1263 reached this morning.
If the main count is correct, then 1263 completes subminuette 2. Subminuette 3 is underway, and now micro 1 is complete at 1271.98. Currently undergoing micro 2. Target = 1266-1267.
If the alternate count is correct (in my revision of it), then a larger drop is next, much lower than 1266-1267 as it is a third wave down (subminuette 3). This count should pass 1250 for a test of 1237.97, possibly breaking it.
If Minor 2 is incomplete, then 1263 is subminuette 3 of minute y, 1271.98 is subminuette 4. The next low would complete it.
So, my strategy is to nibble in once the next low arrives. This caters for the danger of a (large) drop due to the alternate count scenario. I don’t want to be caught like yesterday’s whipsaw.
If you twist my arm, I say the main count is still the most likely.
Apologies. As I mentioned before, I don’t have the resources to put up a chart. It would be so much clearer.
Ok Alan, I sold my holdings at a profit today and will wait for 1266 – 1266 area and will look for possible lower prices before buying. Will use several trend indicators for clarification of an end to the drop today.
Richard, that’s good to hear. In this trying period, the best way to make gains is to scalp. I’m not a gunslinger otherwise I’ll just gamble on a whim. Perhaps the scientific training makes me cautious. Or, have a bottomless account so that losses are negligible.
Price movement is clear and spot on. For the main count, we may have passed the middle of micro c of subminuette 2. Target slightly above 1262.
But, if Minor 2 is not complete yet, the selloff could reach 1250 as the next level of support, or maybe lower. This means that 1261.74, the end of minuette 2 of the main count is the line in the sand. Any drop below that means the main count has to be reworked.
Thereafter, gold price should resume its uptrend. Probably later today or on Monday. Good luck trading, guys.
Awesome Alan thanks. I was curious how low gold might still go lower if it hadn’t bottomed yet this morning. I’ll wait for another dip in gold slightly above 1,262 area before buying this morning, while watching it doesn’t drop below 1261.74.
Amazing how resilient GDX and NUGT are coming back after dips it provides some quick trade opportunities. I won’t hold NUGT over the weekend as too volatile and leaves me the opportunity to trade the open or mornings.
Just a few dollars away this morning from reaching the $1,279/ $1,280 figure to help confirm trend.
“A new high above 1,279.99 would invalidate an impulse unfolding downwards for minor wave C.”
and a selloff right on cue
It’s the morning traffic jam of traders getting out of and then into gold and the miners. It’s a love hate relationship, very temperamental.
Lara did your logo on your charts ever used to say ‘Elliott Wave Gold’? I thought I noticed a change a while back to ‘Elliott Wave Stock Market’. Maybe I’m imagining it. Just curious really.
Nicely spotted 🙂
Yes, it did used to say “Elliott Wave Gold”.
When I switched my data supplier to BarChart I was able to use the one Motive Wave workspace for both S&P500 and Gold cash market.
It just so happened that the first watermark I uploaded was Stock Market. And it’s stayed.
It’s a security measure more than anything else, and it’s proved useful in that regard.
It’s much better. I don’t have to constantly switch workspaces on Motive Wave for those two markets.
Investor appetite for gold is soaring and there’s little sign of a slowdown
May 12, 2016 6:57 a.m. ET
World Gold Council notes record inflow into gold-related ETFs
http://www.marketwatch.com/story/investor-appetite-for-gold-is-soaring-and-theres-little-sign-of-a-slowdown-2016-05-12?mod=MW_story_top_stories
Lara, http://www.pmbull.com has the price as $1,280.99 and not 1,279.99 the high today at 9:55 am. I bring it up because it seems important for both hourly charts.
Not sure if it is a typo or different data feed price.
3. A new high above 1,279.99.
A new high above 1,279.99 would invalidate an impulse unfolding downwards for minor wave C.
I think the best approach to these differences in data is for members to trade using the data supplied from their broker.
Find the equivalent high in your brokers data from the same time. That is your own invalidation / confirmation point.
I know different data suppliers for this global market have slightly different price points for highs / lows from time to time. Quite a lot actually. I expect for this truly global market it is because different data fees include or exclude different geographic locations.
So no, it’s not a typo. That is the price point for that hour from COMEX.
With MACD in bearish territory and a slow down in momentum/ROC, I would be watchful for a possible break below 1258-57 for 1254-52….
Lara, Is this a viable alternate wave count, assuming that Minor 2 is not yet complete?
Yes, it certainly is.
A new low below 1,257.24 would see this idea my main hourly wave count.
This is why risk remains at 1,237.97. Minor 2 could continue lower as a double zigzag, exactly as you have it labelled there.