
The main hourly Elliott wave count expected upwards movement for Monday from Gold, which is what happened.
Price has made a higher high and a higher low on slightly increasing volume.
Summary: At the beginning of this week, the picture is not as clear as last week. The main wave count expected stronger upwards movement. It still does, and the target remains at 1,477, but there is a very real risk that this count is wrong and price may move substantially lower for a few weeks. Risk remains at 1,237.97. If members have long positions, it is essential that risk is managed and stops are used. Do not invest more than 3-5% of equity on any one trade and stops should be set just below 1,237.97. For profitable long positions, members may like to consider moving stops to break even to remove the risk of losses if price moves strongly lower from here.
New updates to this analysis are in bold.
WEEKLY ELLIOTT WAVE COUNT
Click chart to enlarge.
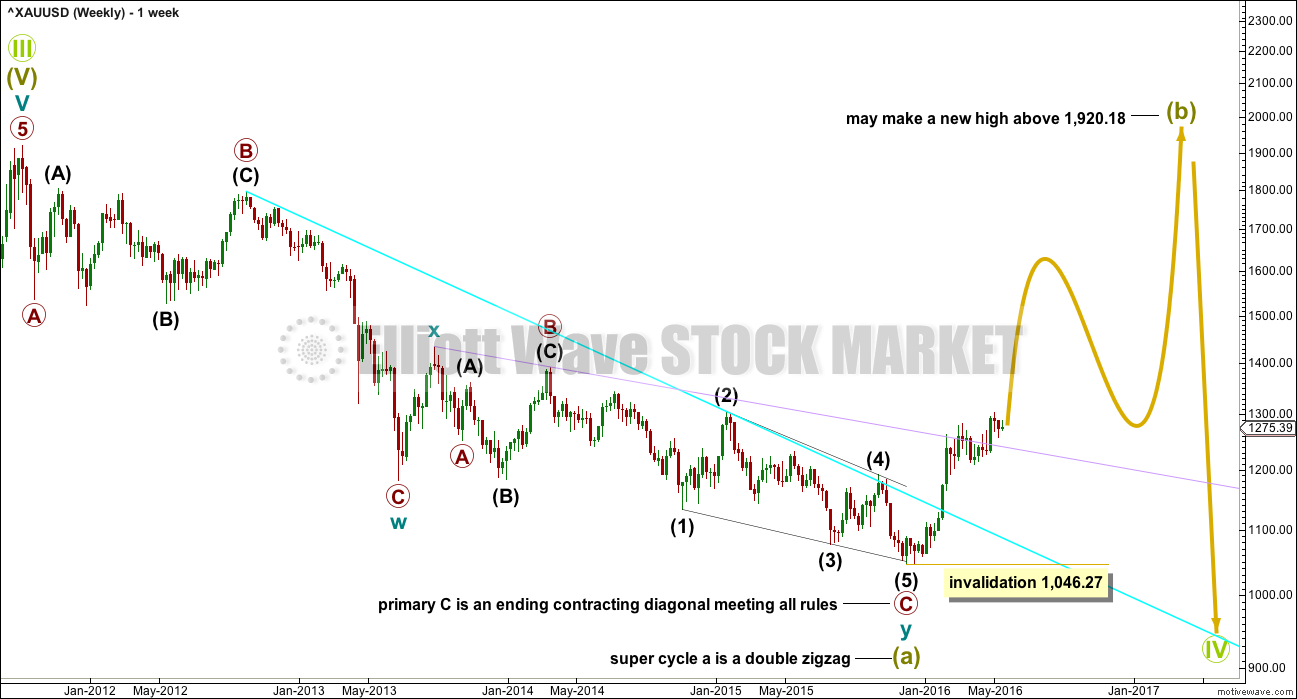
The cyan trend line is breached. This gives substantial confidence that Gold has very likely changed from bear to bull.
This downwards movement subdivides as a double zigzag from the all time high.
Within the first zigzag labelled cycle wave w, primary wave C is 10.13 short of 1.618 the length of primary wave C.
Within the second zigzag labelled cycle wave y, there is no Fibonacci ratio between primary waves A and C. Primary wave C is an ending contracting diagonal which meets all Elliott wave rules.
For this downwards movement this is the only wave count that I have been able to see so far which meets all Elliott wave rules. I remain aware that Elliott Wave International and Danerics have this downwards movement as a five wave impulse which ends with a contracting diagonal for the fifth wave, but that wave count violates the rule for wave lengths within a contracting diagonal. I will keep that wave count in mind, but for now I do not want to publish a wave count which does not meet all Elliott wave rules as laid out in Frost and Prechter.
Grand Super Cycle wave IV may not be a combination because the first wave subdivides as a multiple, and the maximum number of corrective structures within a multiple is three. To label multiples within multiples increases the maximum beyond three, violating the rule.
It may not be a zigzag because Super Cycle wave (a) subdivides as a three and not a five.
This leaves two groups of corrective structures: flats or triangles.
Within an expanded flat or running triangle, Super Cycle wave (b) may make a new high above the start of Super Cycle wave (a) at 1,920.18.
Within a flat, Super Cycle wave (b) must retrace a minimum 90% of Super Cycle wave (a) at 1,833.71.
Super Cycle wave (b) may be any one of 23 possible corrective structures. First, a move of this size should have a clear five up on the daily and weekly charts. That is still to complete. Within the first five up, no second wave correction may move beyond its start below 1,046.27.
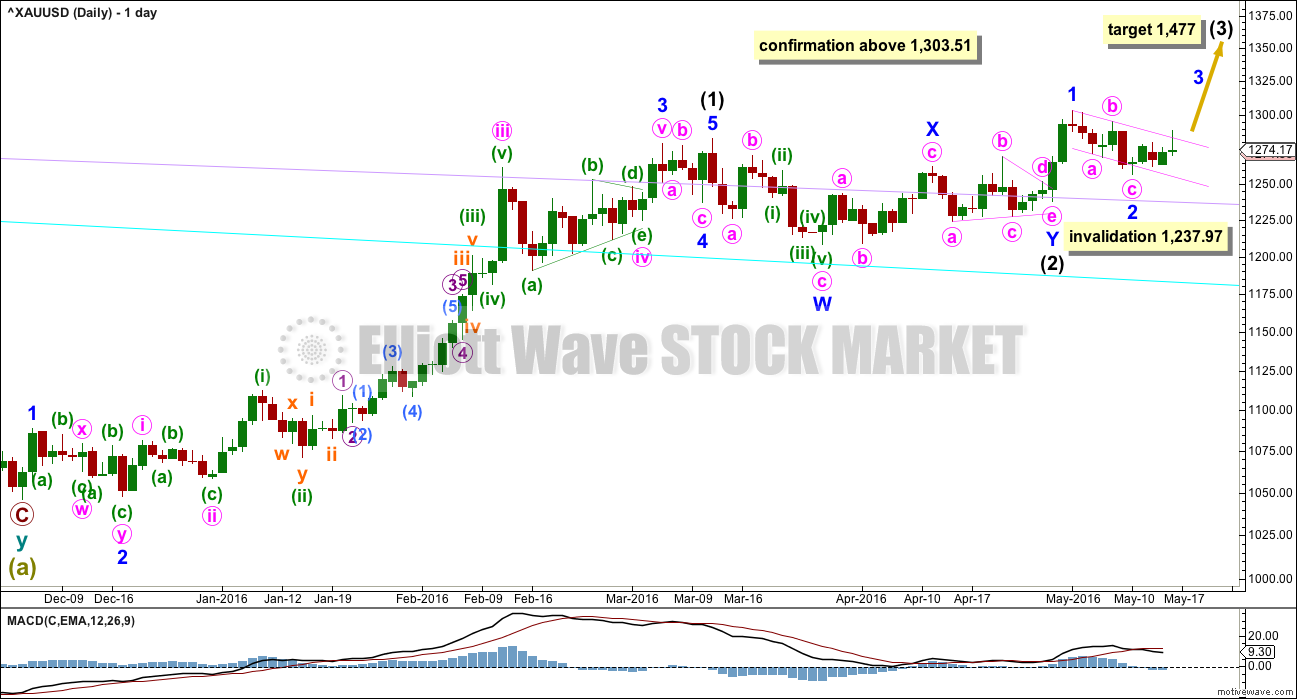
DAILY ELLIOTT WAVE COUNT
Click chart to enlarge.
Intermediate wave (2) may be a double combination.
Minor wave W is a zigzag, the first structure in a double. The two structures in the double may be joined by a simple zigzag for minor wave X in the opposite direction.
Minor wave Y may be a running contracting triangle. The triangle is supported by MACD hovering at the zero line here on the daily chart.
Minor wave 2 may not move beyond the start of minor wave 1 below 1,237.97.
The next wave up for intermediate wave (3) should be swift and strong. It must move above the end of intermediate wave (1) at 1,282.68. It must move far enough above this point to allow room for intermediate wave (4) to unfold and remain above intermediate wave (1) price territory.
At 1,477 it would reach equality in length with intermediate wave (1). This target is reasonable because intermediate wave (2) was very shallow.
If intermediate wave (2) is over as labelled, then it may have totalled a Fibonacci 34 sessions.
Minor wave 2 is 0.71 the depth of minor wave 1. Minor wave 1 lasted two days. Minor wave 2 lasted six days. If it is over here, it would have good proportion and look like a clear three wave structure on the daily and hourly charts.
If minor wave 2 continues lower for another one or two days, as per the first hourly alternate wave count, it would still look reasonable in proportion to minor wave 1.
Gold often begins new trends slowly. There is a good example on this daily chart: the beginning of intermediate wave (1) saw brief impulses and time consuming deep second wave corrections at minor, minute and minuette wave degrees.
Golds impulses, particularly its third waves, normally accelerate at the middle and explode in a blowoff at the end of the fifth wave.
All hourly charts today will show movement from the low labelled minor wave 2 at 1,257.24 on 10th May.
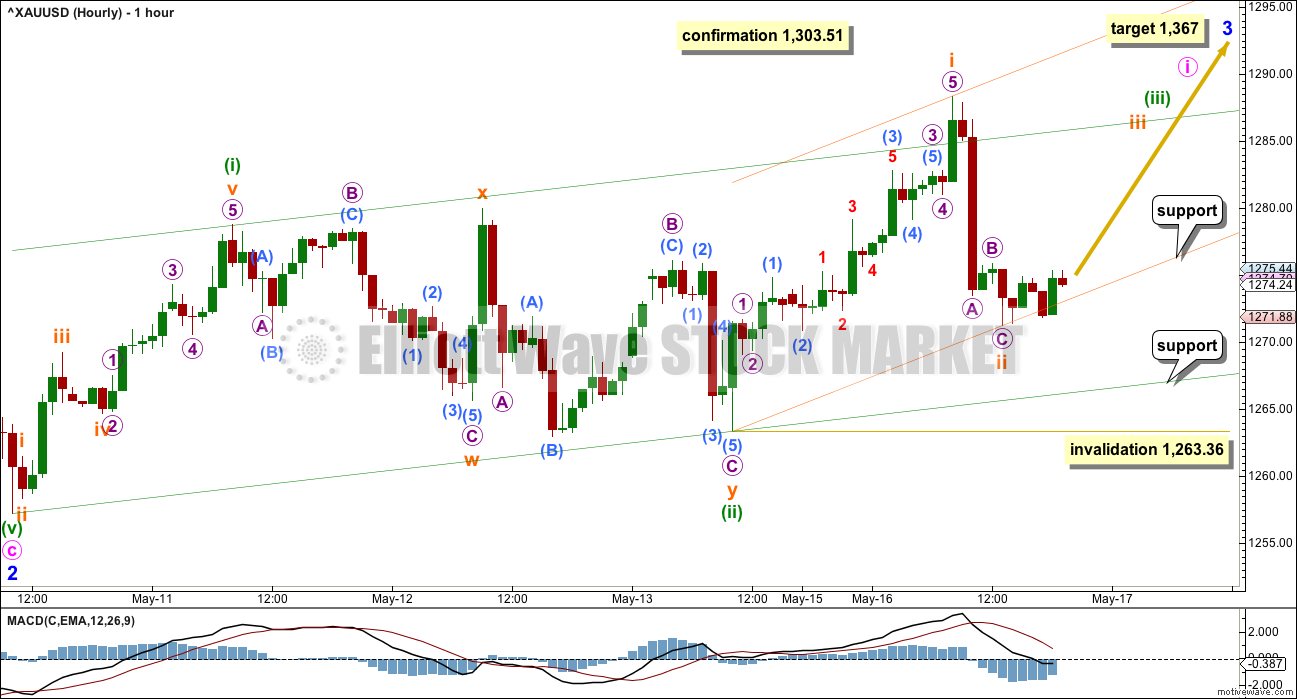
HOURLY ELLIOTT WAVE COUNT
Click chart to enlarge.
Minor wave 2 fits as a zigzag.
Minor wave 3 may only subdivide as an impulse. Minute wave i is incomplete.
Within minute wave i, there may now be two first and second waves complete: minuette waves (i) and (ii) now followed by subminuettte waves i and ii.
Subminuette wave ii may not move beyond the start of subminuette wave i below 1,263.36, if it continues further.
A green base channel is added about minuette waves (i) and (ii). Lower degree corrections along the way up should find support at the lower green trend line.
Another base channel is added about subminuette waves i and ii. If subminuette wave ii is over, then along the way up downwards corrections should find support about the lower edge of this orange channel.
At 1,367 minor wave 3 would reach 1.618 the length of minor wave 1. If this target is wrong, it may be too low. The next possible target would be at 2.618 the length of minor wave 1 at 1,433.
Confidence may be had in a trend change with each of these conditions being met, in order:
1. A five up followed by a three down which does not make a new low. This first condition is now met.
2. A breach of the upper edge of the pink channel. This is overshot today (see daily chart), but price quickly returned to below the upper edge. For confidence price needs to break above this channel and stay above it.
3. A new high above 1,295.34 would invalidate the reworked first alternate below.
4. A new high above 1,303.51. This will be final confirmation.
It would not be until the middle that acceleration to the upside may be expected to be clear for minor wave 3. The fourth wave corrections within it may be quick and shallow, and the fifth waves to end minor wave 3 and then the final fifth wave up of minor wave 5 also may be expected to be very strong movements, completing blowoff tops for Gold.
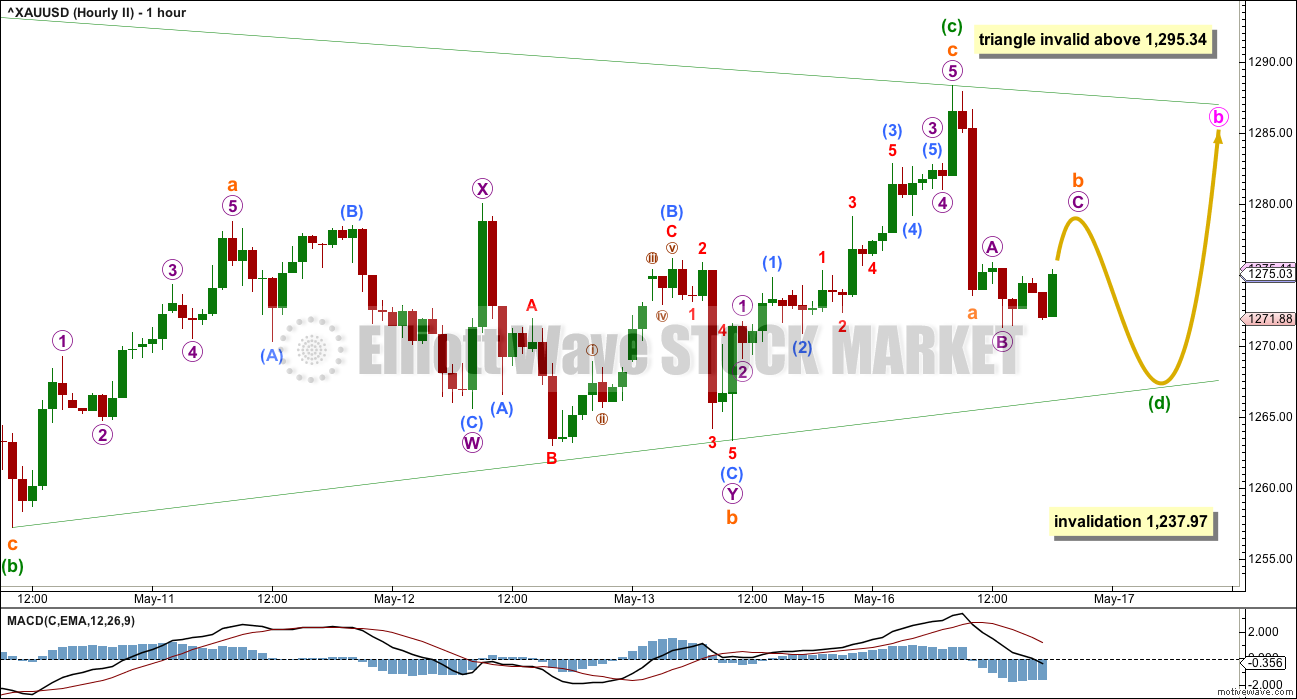
FIRST ALTERNATE HOURLY ELLIOTT WAVE COUNT
Click chart to enlarge.
What if minor wave 2 is not over?
Sideways movement of the last several sessions is still not convincing as another impulse up so far.
Minor wave 2 may be continuing further as a more time consuming correction, still subdividing as a zigzag. The last four days may be a running contracting triangle for minute wave b which may now be incomplete.
Direction of price entry into the triangle is down, so direction of price exit from the triangle should be down.
Within the possible triangle, minuette wave (c) may have moved higher during Monday’s session. If it continues any further as a more time consuming and complicated double, then it may not move above the end of minuette wave (a) at 1,295.34. This is the final upper invalidation point for any triangle idea.
Minuette wave (d) may end when price touches the lower triangle trend line. Minuette wave (d) may not move beyond the end of minuette wave (b) below 1,257.24.
The following zigzag upwards for minuette wave (e) would most likely fall short of the (a)-(c) trend line and may not move beyond the end of minuette wave (c).
When the triangle is complete, then a five wave structure downwards for minute wave c would complete a zigzag for minor wave 2. That may not move beyond the start of minor wave 1 below 1,237.97.
This alternate wave count expects sideways movement in an ever narrowing range for another two to three days, followed by a short sharp downwards thrust which may end close to but not below 1,237.97.
Thereafter, the upwards trend should resume.
This wave count is published primarily to illustrate why risk to long positions must remain at 1,237.97 while price remains below 1,303.51.
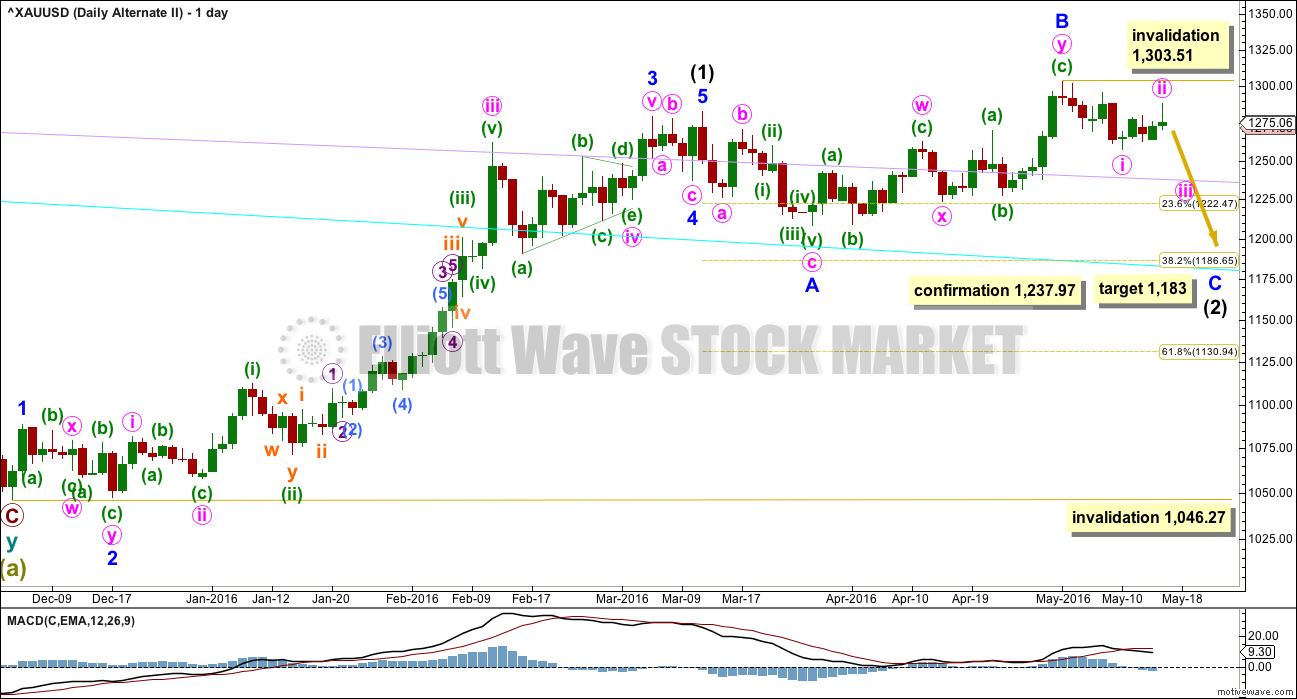
ALTERNATE DAILY ELLIOTT WAVE COUNT
Click chart to enlarge.
It is still possible that intermediate wave (2) is not over. With inconclusive sideways movement for the last five days, the probability of this wave count has slightly increased.
Normally, the first large second wave correction within a new trend is very deep, often deeper than the 0.618 Fibonacci ratio. The main wave count sees intermediate wave (2) as very shallow at only 0.19 of intermediate wave (1). This is unusual. And so this alternate must be considered.
If any members have long positions on Gold already it is essential that stops are used in case this alternate unfolds.
Intermediate wave (2) may be an expanded flat correction. Minor wave A is a three, minor wave B is a three and a 1.28 length of minor wave A. This is within the normal range of 1 to 1.38.
At 1,183 minor wave C would reach 1.618 the length of minor wave A. This would be the most likely target. If price keeps falling through this first target, then the second target would be at 1,108 where minor wave C would reach 2.618 the length of minor wave A.
Intermediate wave (2) may not move beyond the start of intermediate wave (1) below 1,046.27.
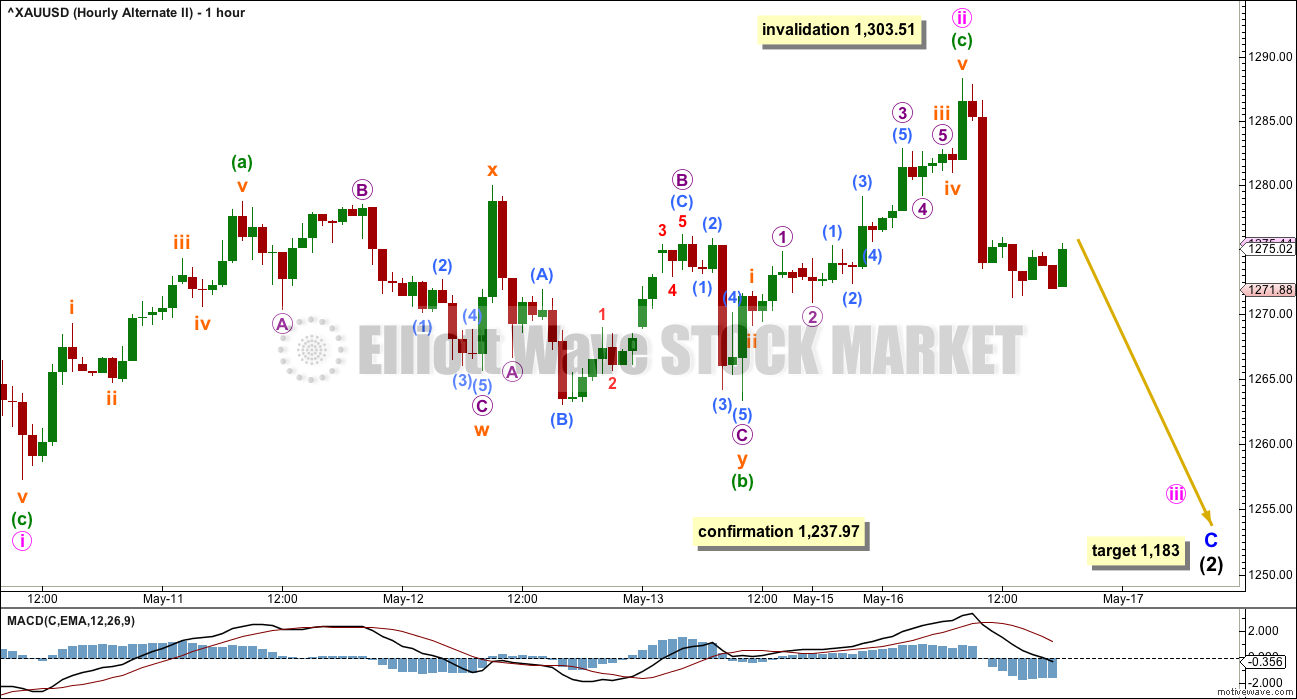
ALTERNATE HOURLY ELLIOTT WAVE COUNT
Click chart to enlarge.
The main purpose in publishing an hourly chart for this alternate is to determine what price points need to be passed to reduce the probability of this alternate and increase the probability of the main wave count.
A secondary purpose is to remain open to considering what this alternate looks like at a lower time frame. Alternates should always be considered; what if the main wave count is wrong? Alternates provide a road map for what should happen next if the main wave count is wrong.
Minor wave C must subdivide as a five wave structure. With inconclusive sideways movement for the last five days, an ending diagonal must now be considered and published.
Within an ending diagonal, all sub-waves must subdivide as zigzags. The fourth wave must overlap back into first wave price territory and may not move beyond the end of the second wave. Second and fourth waves are commonly from 0.66 to 0.81 the depth of the first and third waves they correct. Thus ending diagonals are choppy overlapping movements. Contracting diagonals, the more common variety, have their classic technical analysis equivalents as falling or rising wedges.
Minute wave i subdivides as a zigzag in the same way as minor wave 2 subdivides as a zigzag for the main wave count.
Minute wave ii is now a complete zigzag most likely. It is possible that it could continue higher. If it does, it may not move beyond the start of minute wave i above 1,303.51.
Here, minute wave ii is 0.67 the depth of minute wave i which is within normal range of 0.66 to 0.81.
Minute wave iii must subdivide as a zigzag and must make a new low below the end of minute wave i below 1,257.24.
When minute wave iii is complete, then the type of diagonal, contracting or expanding, would be known, so a target range and minimum or maximum for minute wave iv may be calculated.
TECHNICAL ANALYSIS
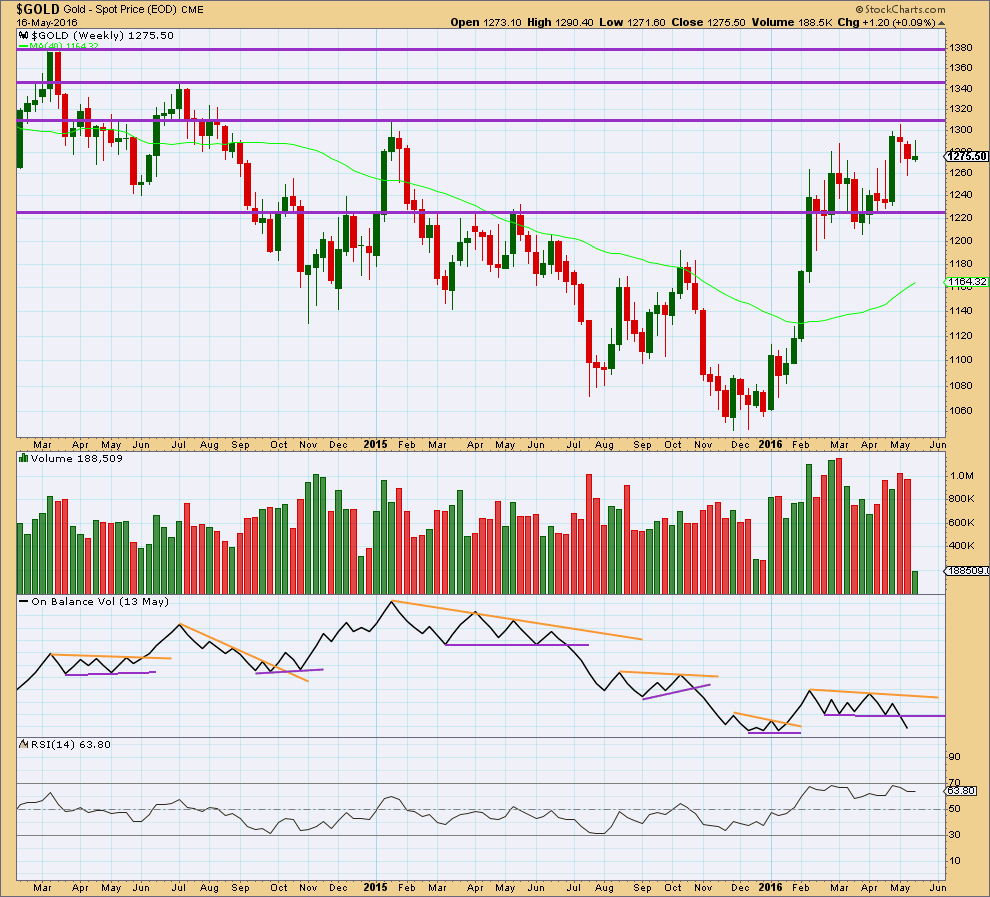
WEEKLY CHART
Click chart to enlarge. Chart courtesy of StockCharts.com.
How useful is weekly volume data?
Looking at recent movement, going back to March 2014, lets examine each rally and see if volume at the weekly level indicated weakness.
The first rally from June 2014 to July 2014 was six green weekly candlesticks in a row. Within the last four weekly candlesticks, three came on declining volume indicating weakness and the final week saw an increase in volume which may have been due to a volume spike on the final day at the high.
The next rally from November 2014 to January 2015 did not indicate much weakness. The last three strong upwards weeks of the rally came on strong volume, with only the final week showing weakness.
The next rally from March 2015 to May 2015 saw divergence with price and volume at the end compared to the first swing high within the rally: as price made a new high to end the rally, it came on lighter volume than the high of April within the rally. Overall, during this rally, it was an upwards week with strongest volume, but this was not a reliable indicator of future price direction as price completed the rally and went on to make new lows as the bear market continued.
The next rally from July 2015 to October 2015 also saw much lighter volume at its end compared to the start. The strongest week during the rally was a downwards week.
Turning attention to the current rally, from March 2016 to the last high at the start of May 2016, so far price comes overall on increasing volume as price is rising. So far that does not indicate weakness. Strongest weeks are downwards weeks.
Conclusion: Currently, for this market, weekly volume in terms of strongest vs weakest weeks is not a reliable indicator of future price direction. It may be better to “look inside” each week and analyse daily volume data. Currently, for this market, overall weekly divergence with price and volume may indicate weakness to upwards movement.
More weight will be given to volume analysis at the daily chart level.
On Balance Volume, however, will work well with trend lines at the weekly chart level. A few examples are drawn here:
On the week beginning 9th June, 2014, OBV broke upwards out of a consolidation. This preceded four more weeks of upwards movement for a bear market rally.
On the week beginning 6th October, 2014, OBV broke above a resistance line. This was followed by a new low for price and then a strong bear market rally. The consolidation zone here for OBV is not clear.
On the week beginning 6th July, 2015, OBV broke below a clearly defined and long held consolidation zone. This preceded two more strong downwards weeks for price.
On the week beginning 2nd November, 2015, OBV broke below a short support line delineating a short consolidation. This was followed by more downwards movement from price.
On the week beginning 25th January, 2016, OBV broke above a small consolidation zone. This was followed by several weeks more of strong upwards movement from price.
Now OBV is breaking below a reasonably long held and clearly defined consolidation zone. It would be entirely reasonable to expect price to follow by continuing lower for a few weeks. This piece of evidence strongly supports the alternate daily Elliott wave count.
Price has found resistance at the horizontal line about 1,310. The first support line may be about 1,225.
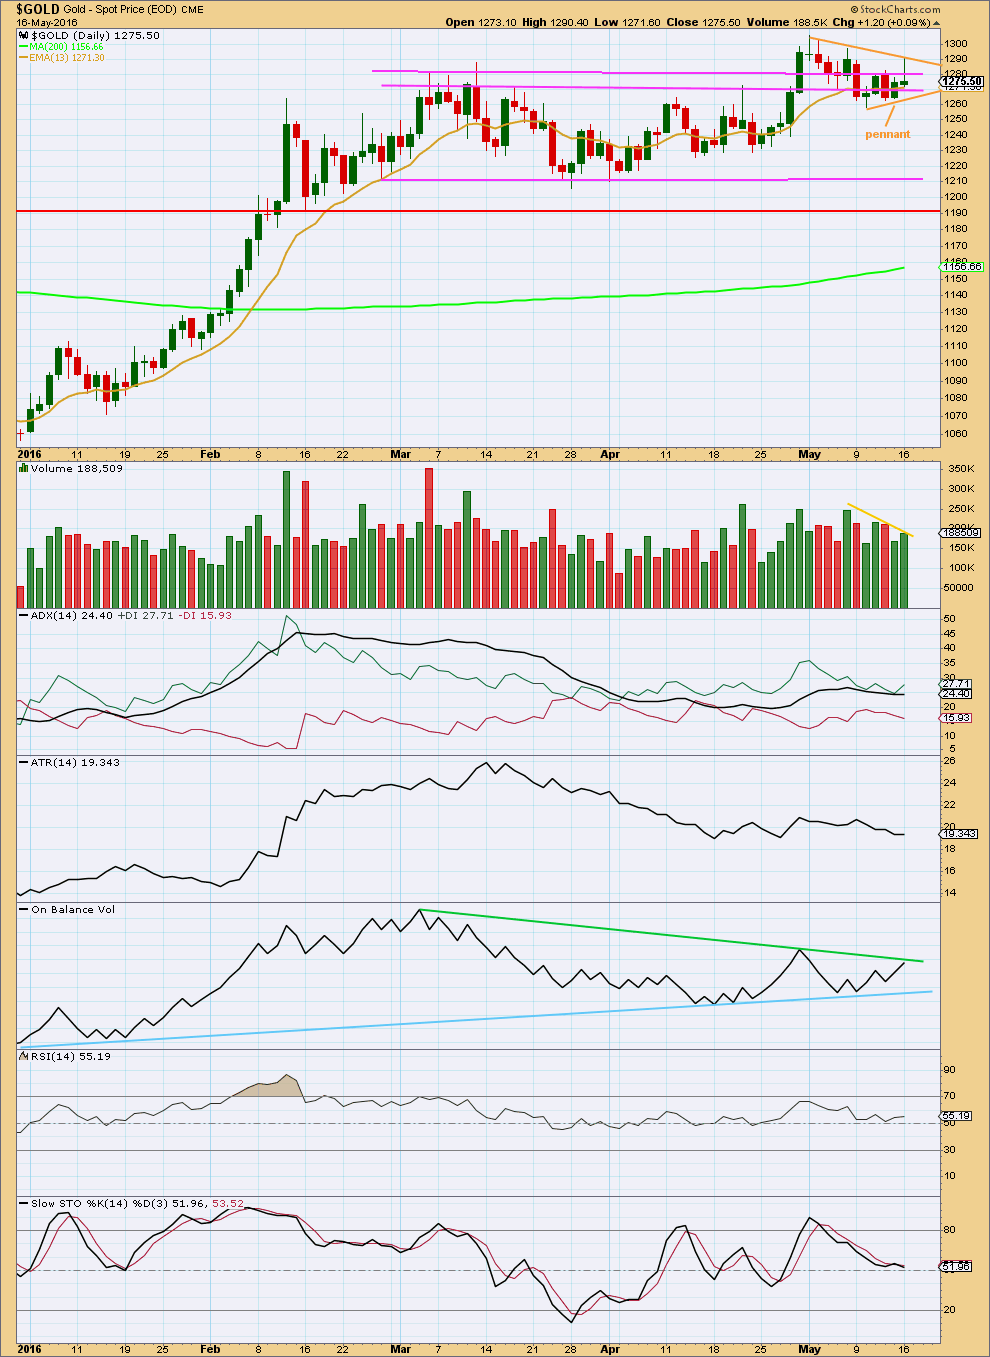
DAILY CHART
Click chart to enlarge. Chart courtesy of StockCharts.com.
Last week looked like Gold had broken out of a consolidation delineated by the pink support and resistance lines on 29th April. This strong upwards day broke above resistance and had strong volume. A throwback was expected.
Price turned and moved lower as expected for a throwback, to initially find support around the uppermost pink line, then the next pink line.
But price has failed to move strongly away from support; it seems to have stalled. This is concerning for the main wave count.
Overall, price is moving sideways on declining volume. This indicates another small consolidation, possibly an Elliott wave triangle which equates to a classic pennant pattern in this instance.
Pennant patterns are one of the most reliable continuation patterns, so the breakout direction would be expected to be upwards. They commonly come with declining volume, which is seen here. This favours the main hourly Elliott wave count.
Of recent days, volume increases as price rises, supporting the rise in price. The last two daily candlesticks again come with increasing volume. At the daily chart level, volume looks to be more bullish which also supports the main Elliott wave count.
ADX is flat indicating the market is not currently trending and ATR agrees as it is declining. ADX does not indicate a trend change: the +DX line remains above the -DX line.
On Balance Volume at the daily chart level is constrained within the two trend lines which are converging. A break above the green line would be bullish. A break below the blue line would be bearish. A bearish daily indication from OBV would switch this analysis strongly to bearish. A bullish indication from daily OBV would be interpreted in conjunction with weekly OBV, but it would not necessarily be strongly bullish.
RSI is neutral. There is room for price to rise or fall. There is currently no divergence between price and RSI to indicate weakness in either direction.
Stochastics is neutral. There is room for price to rise or fall. A fall in price may end when Stochastics reaches oversold.
This analysis is published @ 10:17 p.m. EST.
[Note: Analysis is public today for promotional purposes. Member comments and discussion will remain private.]
Expecting an upturn, short term rally…. remains to be seen how far above 1286 this will go (to test a break above 1292-93?)….
Looks like we have an upwards breakout in OBV. A bullish sign, but still not above the high in April.
That’s so good. That adds a little confidence to the main wave count.
I’m still concerned enough about the bearish On Balance Volume at the weekly chart level to hang onto the alternate ideas.
Dollar drops as stronger inflation reading fails to boost rate-hike expectations
May 17, 2016 3:15 p.m. ET
http://www.marketwatch.com/story/dollar-edges-up-but-110-remains-in-the-distance-2016-05-17
Triangle, hourly II, updated.
It could be over.
Or minuette (c) or minuette (d) could be incomplete. So the invalidation point for the triangle must remain the same to the upside; if it continues it can’t move above 1,295.34.
If the triangle is complete then at 1,250 minute c would reach equality with minute a.
It may be annoying to some that I”m leaving the invalidation point at 1,295.34 for this wave count. There’s a good reason for it.
I’ve learned the hard way to give triangles room to move and have patience with them. Also, always have an alternate ready if you think a triangle is unfolding.
Triangles are the trickiest of all EW structures. They are really hard to see correctly, and it’s often not until the end that it is clear. Often what looks like a triangle invalidates only to turn into some kind of combination.
Here’s a tip:
For an Elliott wave triangle the direction of entry into the triangle is the same as the direction of exit from the triangle.
In other words, Elliott wave triangles are always continuation patterns.
Now the hard part is figuring out exactly where the triangle begins. That’s harder than it sounds.
Updated hourly chart.
Subminuette ii moved lower. Now within subminuette iii micro 1 is an incomplete impulse.
When micro wave 1 is complete look for micro 2 to find support at the orange trend line. It may not move beyond the start of micro 1 at 1,269.63.
Retrace possible calculation
1282.32 high at 1:05 pm
– 1269.14 low at 4:42 am
x.618 – 1282.32
= 1,274.17 .618 retrace rough guess
Any comments?
I’m seeing similar…..for me a close over 1280 is imperative for further upwards movement.
Sure, let me finish tidying up my chart and I’ll post it.
In short, from todays low I can see a 1-2-3-4 now beginning 5 up.
This looks like another first wave. Possibly.
I’ve yet to work on my triangle chart this morning. Main count first.
How low might this current drop go as some of Lara’s potential drops are scary?
🙂
This upwards movement of the last six days looks anaemic. It’s mostly sideways, with an upwards bias.
This market is not behaving as expected for the start of a third wave up.
Which makes me think that a triangle may be completing which means it should be followed by a sharp downwards thrust.
Which could be scary, yes.
If it travels the same distance as the widest part of the triangle that would be 38.10
Hello Lara,
What do you mean by saying 38.10 in your note above about the wild triangle part?
Thanks a lot,
Pete
She means the downwards breakout may be 38.10 in length, the same as the widest part of the triangle.
Alan/ Richard – Thanks for your discussions! They are definitely read.
Reference is made to a “correction” within your comments. Two Fed members are scheduled to speak this afternoon. If they’re consistent with the previous Fed members who spoke previously, I would expect more hawkish tones. Also, today’s economic data that was released was favorable to support the Fed and their motion towards a rate hike. However, the dollar didn’t follow in strength but maybe it will strengthen this afternoon?
In your comments, you also mentioned the Fed Minutes being released tomorrow and how you’re anticipating a correction; supportive of hawkish tones which may alter the market’s expectation of a 4% chance of a rate hike in June/July; strengthening the dollar.
Ultimately, interest in your continued dialogue would be very helpful to read.
I think that the news released today was dovish and doesn’t support a rate hike and that is why gold up and US dollar and stock markets down.
http://www.kitco.com/news/2016-05-17/Gold-Pushes-Higher-As-U-S-Stock-Market-Comes-Under-Selling-Pressure.html
The minutes from the last FOMC will be the big news this week Wed 2:00 pm EST.
U.S. stocks edge lower as consumer prices rise
Consumer prices jump by biggest amount in more than 3 years
http://www.marketwatch.com/story/us-stock-futures-seesaw-as-oil-rally-fades-2016-05-17
Strange that gold went up with increase in CPI, but likely because stocks down and safe haven effect?
Likely because “Inflation, overall, remains tame however.” The FED has been concerned about inflation and were looking to raise rates to keep inflation at 2% and it is still below that.
Bullish Firings have been happening in Gold and GDX this morning.
Bullish firing GDX 3 minute at 9:36 am, 15 minute at 10:15 am, 39 minute at 10:00 am, 195 minute at 7 am, Gold 5 minute at 10:00 am and 15 minute at 10:00 am.
GDX and NUGT MFI index indicator looks topped and looks likely to head down now at 10:27 am
Any wave counts?
Gold may end a 5th of a 5th wave up in several minutes then correct?
Low today was 1269.14 at 4:42 am start of this 5 wave up?
Richard. See my detailed count below. I think it is completing/completed only the third of a third, at 1280.19. Two 4-5s to go before the correction, which will be micro 2 of the main count.
Gold Pushes Higher As U.S. Stock Market Comes Under Selling Pressure
Tuesday May 17, 2016 09:58
http://www.kitco.com/news/2016-05-17/Gold-Pushes-Higher-As-U-S-Stock-Market-Comes-Under-Selling-Pressure.html
Can anyone tell if gold is now following the main Hourly or the Hourly II chart today?
I did notice that gold went up a little since the 8:30 am US news this morning on the Consumer price index.
http://www.marketwatch.com/story/us-consumer-prices-jump-04-in-april-2016-05-17
Richard. I can’t tell for certain yet. I have modified the count such that subminuette 2 of the main and subminuette 4 of the 1st Alternate are both 1269.14 instead, that being the lower low.
Thereafter, minuette 1 of the main targets 1289.56 while Minute B of the 1st Alternate targets 1291.62, pretty close by.
The alternate count as is will have to be reworked above 1288.79, but invalidated above 1303.84.
In short, I expect tortuous upward movement, navigating through a series of 4th and 5th waves until 1289.56 / 1291.62. Probably correct, as FOMC minutes will be out tomorrow. Traders tend to drag their feet till then. All prices are based on pmbull data feed.
Terrific Alan, thanks for the bullish update. I like the word Tortuous, sure sounds like gold’s journey and EW trying to track, count and forecast it.
tor·tu·ous
ˈtôrCH(o͞o)əs/
adjective
full of twists and turns.
“the route is remote and tortuous”
synonyms: twisting, twisty, twisting and turning, winding, windy, zigzag, sinuous, snaky, serpentine, meandering, circuitous
“a tortuous route”
Similar daily candles have recently preceded 1-3 additional down days.
Lara, thanks for the weekly update, and especially the extra focus on volume and OBV!
You’re welcome. Your message was timely.
U.S. Dollar Will Be Key For Gold Next Week – Analysts
Friday May 13, 2016 14:44
http://www.kitco.com/news/2016-05-13/U-S-Dollar-Will-Be-Key-For-Gold-Next-Week-Analysts.html
Why gold won’t break out of a tight trading range
May 14, 2016 12:49 p.m. ET
Investor sentiment doesn’t support a sustained rally
http://www.marketwatch.com/story/why-gold-wont-break-out-of-a-tight-trading-range-2016-05-13