
The main Elliott wave count was invalidated at the hourly chart level with a new low below 1,269.63. At that stage, both alternates expected more downwards movement.
Summary: More downwards movement should be expected from here. The preferred wave count (about a 60% probability) has a target at 1,250. If price makes a new low below 1,237.97, then more downwards movement should be expected. The target then would be at 1,183.
New updates to this analysis are in bold.
To see last weekly charts click here.
DAILY ELLIOTT WAVE COUNT
Click chart to enlarge.
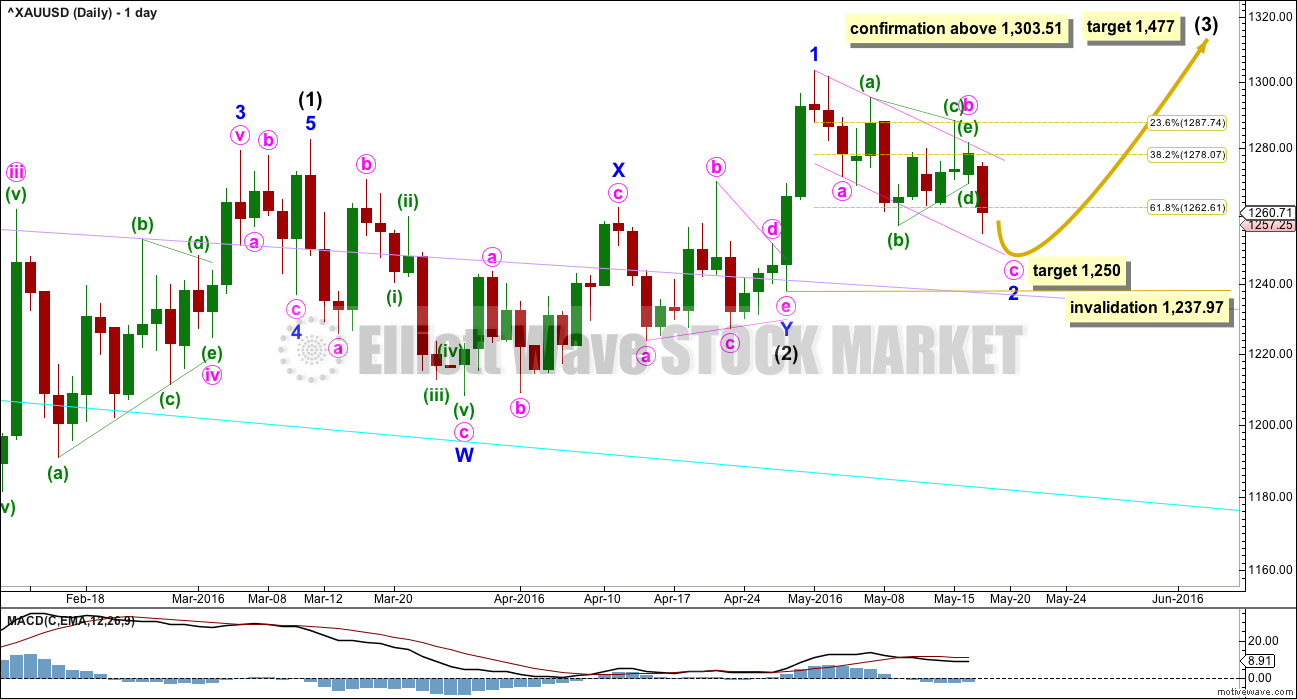
Intermediate wave (2) may be a shallow 0.19 double combination.
Minor wave W is a zigzag, the first structure in a double. The two structures in the double may be joined by a simple zigzag for minor wave X in the opposite direction.
Minor wave Y may be a running contracting triangle. The triangle is supported by MACD hovering at the zero line here on the daily chart.
The next wave up for intermediate wave (3) should be swift and strong. It must move above the end of intermediate wave (1) at 1,282.68. It must move far enough above this point to allow room for intermediate wave (4) to unfold and remain above intermediate wave (1) price territory.
At 1,477 it would reach equality in length with intermediate wave (1). This target is reasonable because intermediate wave (2) was very shallow.
If intermediate wave (2) is over as labelled, then it may have totalled a Fibonacci 34 sessions.
Minor wave 2 is moving lower as a zigzag with a triangle for minute wave b within it. Minor wave 2 may be a very deep correction. So far it is deeper than 0.618 of minor wave 1. At 1,250 minute wave c would reach equality in length with minute wave a. Draw a small channel (pink) about minor wave 2 using Elliott’s technique for a correction as shown. Copy this over to the hourly chart.
Minute wave a lasted two sessions. Minute wave b triangle lasted nine sessions. Minute wave c may last another one session to total two, or two more sessions so that minor wave 2 totals a Fibonacci thirteen sessions.
Minor wave 2 may not move beyond the start of minor wave 1 below 1.237.97.
Gold often begins new trends slowly. The beginning of intermediate wave (1) saw brief impulses and time consuming deep second wave corrections at minor, minute and minuette wave degrees.
Golds impulses, particularly its third waves, normally accelerate at the middle and explode in a blowoff at the end of the fifth wave.
HOURLY ELLIOTT WAVE COUNT
Click chart to enlarge.
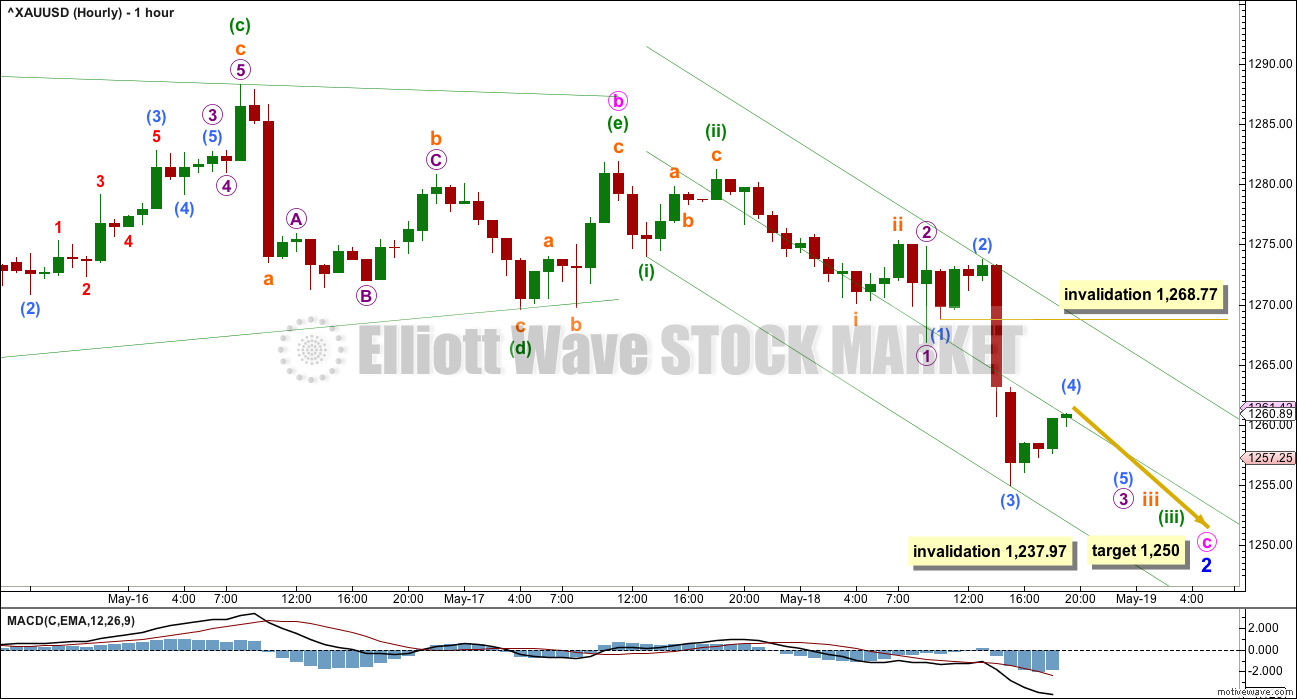
With minor wave 2 obviously continuing lower, the structure that still makes the most sense and has the best fit is a zigzag with a running contracting triangle for minute wave b.
The triangle is complete. Minute wave c is moving lower. The structure of minute wave c is incomplete.
Minute wave c must subdivide as a five wave structure, either an impulse (more likely) or an ending diagonal (less likely but still possible).
Within minute wave c, the structure may have begun with four overlapping first and second waves. The middle of the third wave may have passed during Wednesday’s session; it shows a strong increase in momentum. Now a series of fourth wave corrections and fifth waves downwards should follow to complete the structure.
A best fit channel is drawn about this downwards movement. Along the way down, corrections may find resistance about the mid line in the first instance, and the upper edge at the most.
Short term submicro wave (4) may not move into submicro wave (1) price territory above 1,268.77.
ALTERNATE DAILY ELLIOTT WAVE COUNT
Click chart to enlarge.
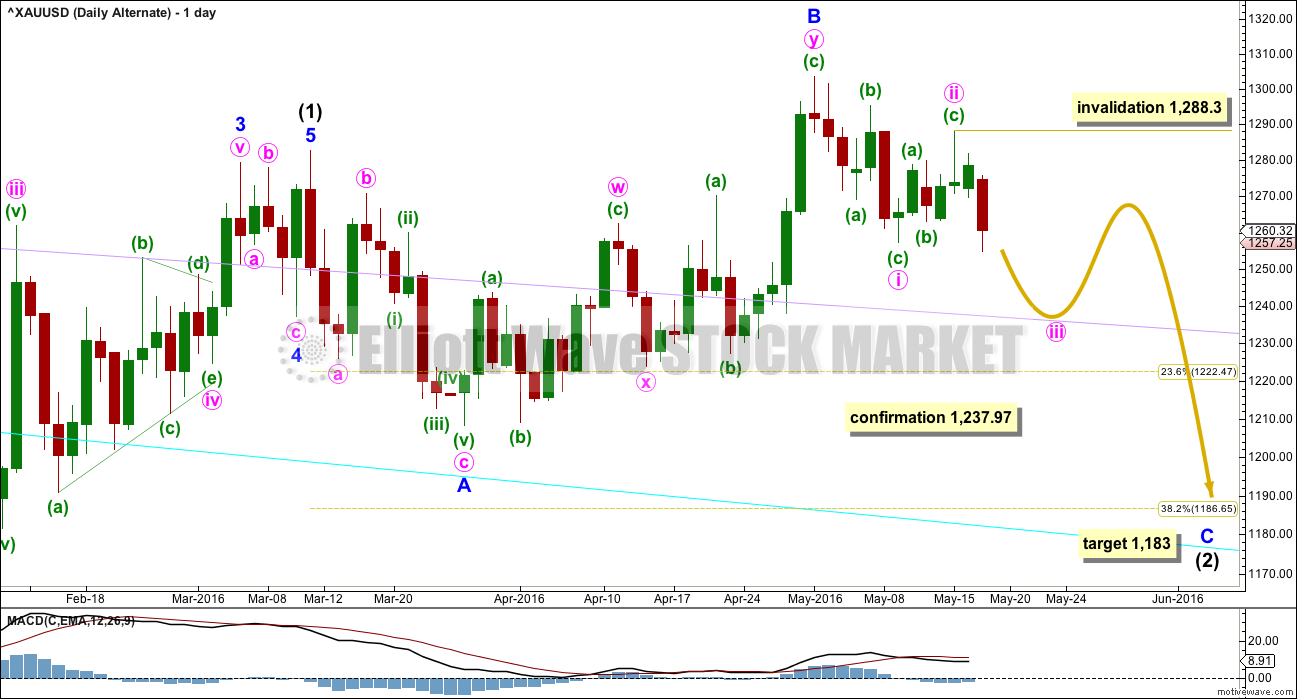
It is still possible that intermediate wave (2) is not over. The probability of this wave count has slightly increased. It would be my judgement that this alternate has about a 40% probability and the main count about a 60% probability.
Normally, the first large second wave correction within a new trend is very deep, often deeper than the 0.618 Fibonacci ratio. The main wave count sees intermediate wave (2) as very shallow at only 0.19 of intermediate wave (1). This is unusual. And so this alternate must be considered.
If any members have long positions on Gold already it is essential that stops are used in case this alternate unfolds.
Intermediate wave (2) may be an expanded flat correction. Minor wave A is a three, minor wave B is a three and a 1.28 length of minor wave A. This is within the normal range of 1 to 1.38.
At 1,183 minor wave C would reach 1.618 the length of minor wave A. This would be the most likely target. If price keeps falling through this first target, then the second target would be at 1,108 where minor wave C would reach 2.618 the length of minor wave A.
Intermediate wave (2) may not move beyond the start of intermediate wave (1) below 1,046.27.
A new low below 1,237.97 by any amount at any time frame would immediately invalidate the main wave count and confirm this alternate. At that stage, more downwards movement would be expected.
There are two structural options for minor wave C: either an impulse or an ending diagonal. At this stage, with the choppy overlapping movement to start minor wave C, an ending diagonal looks more likely.
Within the diagonal, minute wave i fits as a zigzag as does minute wave ii. Minute wave iii may now be underway. When minute wave iv arrives, it may not move beyond the end of minute wave ii above 1,288.30.
ALTERNATE HOURLY ELLIOTT WAVE COUNT
Click chart to enlarge.
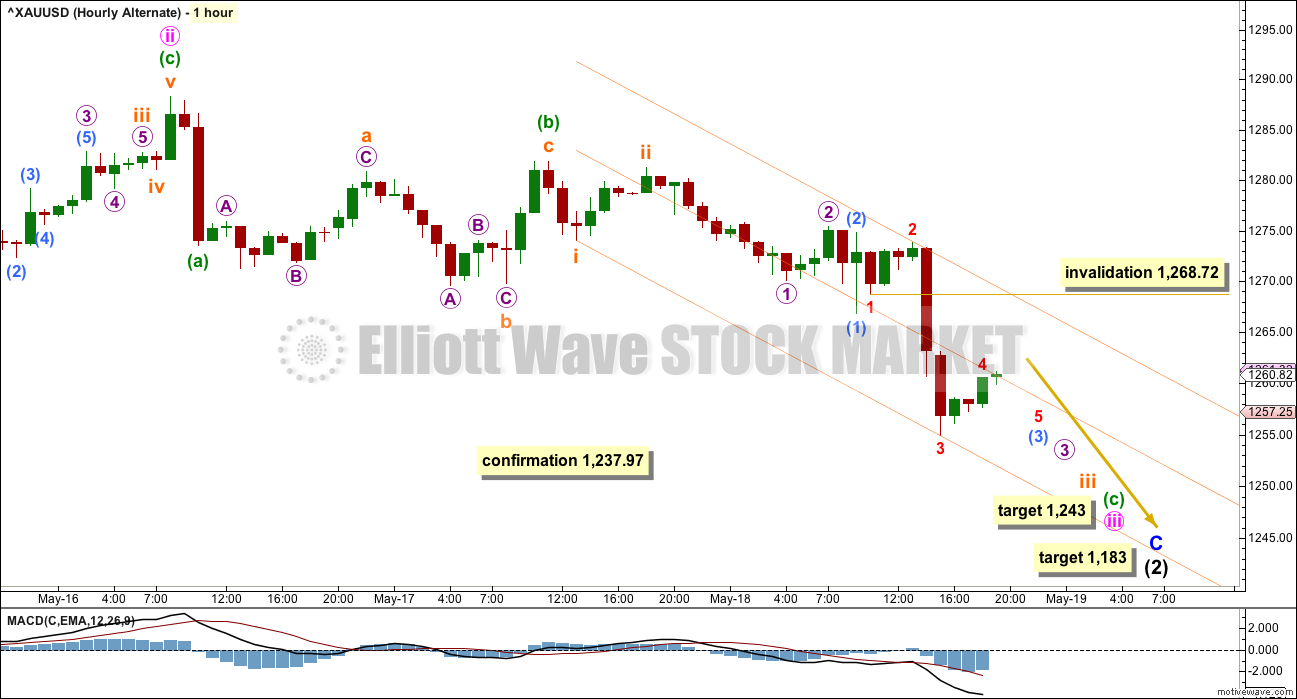
Within an ending diagonal, all sub-waves must subdivide as zigzags. The fourth wave must overlap back into first wave price territory and may not move beyond the end of the second wave. Second and fourth waves are commonly from 0.66 to 0.81 the depth of the first and third waves they correct. Thus ending diagonals are choppy overlapping movements. Contracting diagonals, the more common variety, have their classic technical analysis equivalents as falling or rising wedges.
Minute wave ii is 0.67 the depth of minute wave i which is within normal range of 0.66 to 0.81.
Minute wave iii must subdivide as a zigzag and must make a new low below the end of minute wave i below 1,257.24.
When minute wave iii is complete, then the type of diagonal, contracting or expanding, would be known, so a target range and minimum or maximum for minute wave iv may be calculated.
At 1,243 minuette wave (c) would reach 2.618 the length of minuette wave (a). This target would complete the zigzag of minute wave iii.
When minute wave iii is complete, then the invalidation point must move back up to the end of minute wave i. Minute wave iv should be a deep correction and must overlap back into minute wave i price territory above 1,257.24, but it may not move beyond the end of minute wave ii above 1,288.30.
TECHNICAL ANALYSIS
WEEKLY CHART
Click chart to enlarge. Chart courtesy of StockCharts.com.
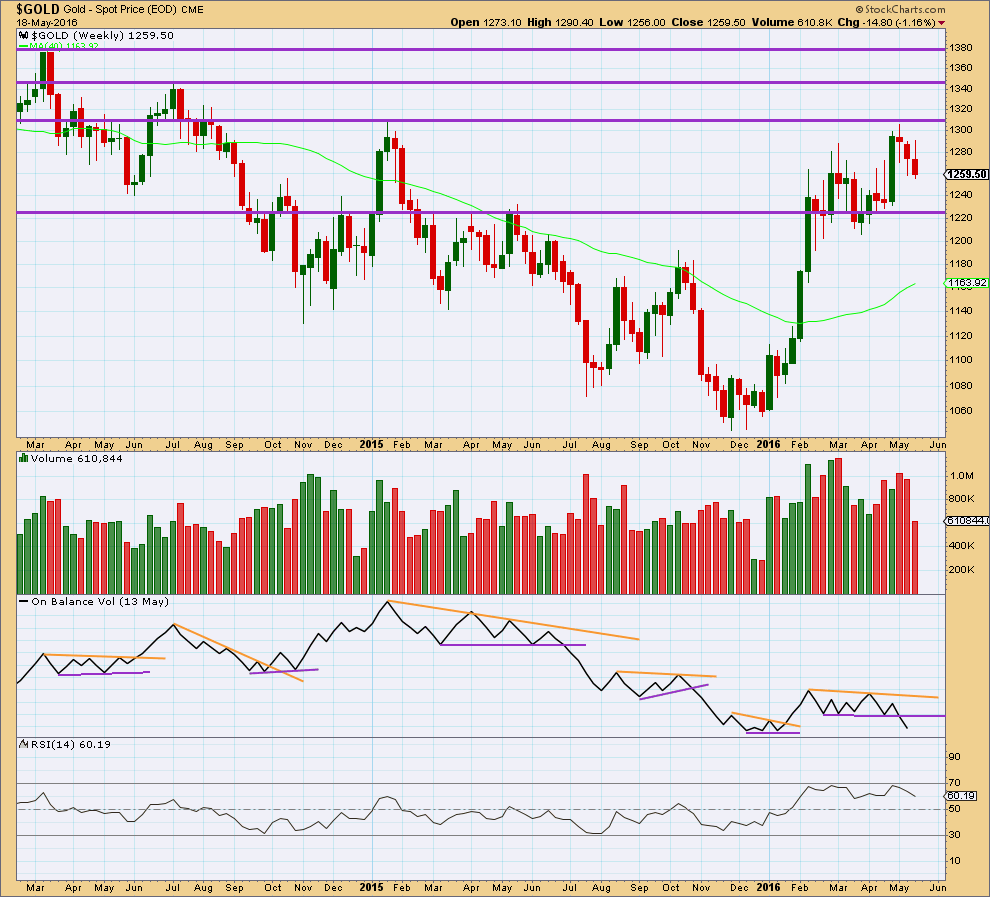
On Balance Volume is breaking below a reasonably long held and clearly defined consolidation zone. It would be entirely reasonable to expect price to follow by continuing lower for a few weeks. This piece of evidence strongly supports the alternate daily Elliott wave count.
Price has found resistance at the horizontal line about 1,310. The first support line may be about 1,225.
DAILY CHART
Click chart to enlarge. Chart courtesy of StockCharts.com.
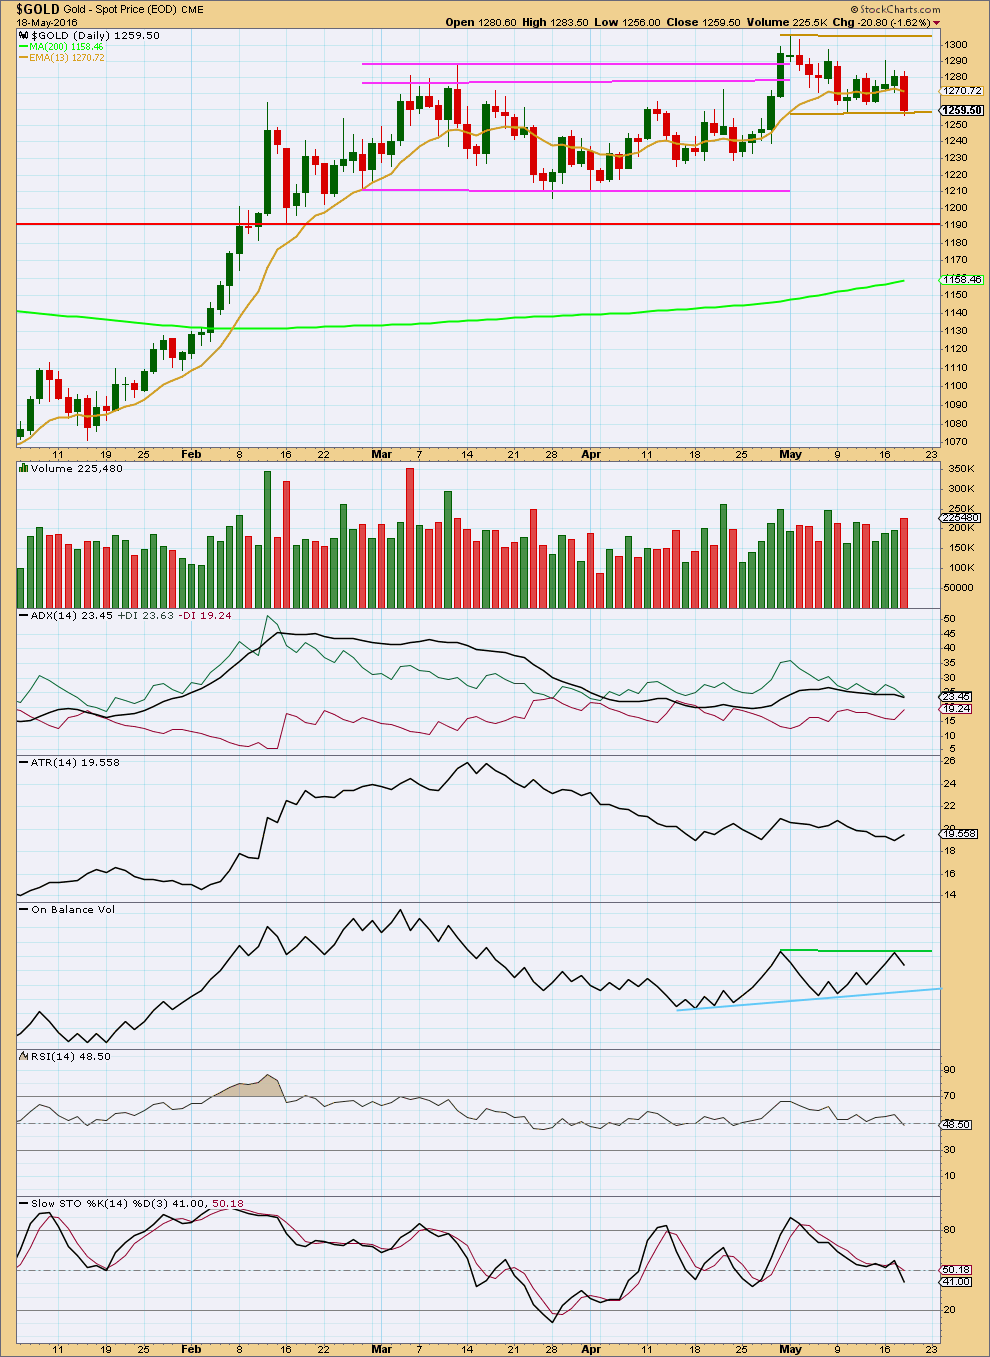
The breakout above resistance on high volume for 29th April now looks like it may have been a false breakout. Price today has returned to close comfortably back down in the prior consolidation zone, delineated by pink trend lines.
If it is accepted that the consolidation began in February, then the day with the strongest volume during this period is the downwards day of 4th March, suggesting a downwards breakout.
However, if it is accepted that the consolidation began after the high of 11th March, then the days with strongest volume are 29th April and 21st April, suggesting an upwards breakout.
It may be more helpful to break the consolidation into separate zones. A new consolidation may be forming delineated by brown lines. The lower edge may not yet be determined, so the lower trend line may need to be moved lower. This smaller consolidation began from the high on 2nd May. So far within it the upwards day of 6th May has strongest volume suggesting an upwards breakout.
ADX is slightly declining today and for several days has been flat to declining, so no clear trend is indicated. ATR overall still agrees; it is still flat to declining.
The green trend line on On Balance Volume as it was drawn yesterday did not work. It was breached suggesting an upwards movement from price, but now OBV has come back down below the line. The green line is today redrawn, as is the blue line.
On Balance Volume is constrained within two contracting lines. A break above the green line would be a bullish signal. A break below the blue line would be a bearish signal.
Both RSI and Stochastics are neutral. There is room for price to rise or fall. Downwards movement may be expected to continue within the consolidation until price reaches support (yet to be determined) and Stochastics reaches oversold at the same time.
There is no divergence between price and either of Stochastics or RSI to indicate weakness at this stage.
This analysis is published @ 08:51 p.m. EST.
Updated main hourly chart.
If I have the waves within minute c counted correctly then a final wave down is required.
Target 1,243 where minuette (v) = 1.618 X minuette (i)
Caveat: I haven’t properly checked the 5 minute chart yet. This may change.
If price breaks above the green channel then this expectation is probably wrong, expect then there’s been a trend change.
Okay, I’ve checked the subdivisions on the five minute chart and this fits. It looks right on the hourly chart.
While that green channel on the main hourly holds this will be the expectation, one more fifth wave down.
If price breaches that green channel then I’m most likely wrong, the downwards movement is over. Price would confirm its over above 1,274.04.
*Note: the invalidation point on this chart posted wasn’t updated. It should read 1,274.04. Sorry, I was too quick, wanted to get this chart posted before NY closed for you.
The channel is breached so this count is wrong.
The downwards movement is over already.
I’ll now be looking for an entry for a long position. I may just jump in right here, risk is at todays low so price isn’t too far away.
Good morning everybody. I’m here. Sorry for delay.
For the main hourly: the structure still isn’t complete. It needs one more fifth wave down IMO.
For the alternate hourly short term same problem.
The target was inadequate.
Is this in play now?
“Minute wave iv should be a deep correction and must overlap back into minute wave i price territory above 1,257.24, but it may not move beyond the end of minute wave ii above 1,288.30.”
I think we need to wake up Lara from her slumber in order to get some direction 😉
It’s great to have our own modern day Heroine, Lara, performing impressive feats of ingenuity day in and day out for us here in times of confusion.
I think she may swoop in for one of her trademark Elliott Wave rescues between 3 and 4 pm.
LOL
Not sure I’d want to call myself a heroine 🙂
I do have “Wonder Woman” clothing though. Love Wonder Woman, reminds me of my childhood.
Captain America was actually secretly in love with wonder woman, but tried not to show it. Anyway ,I still have my helmet with eagles wings on the top and shield in my closet . Didn,t know my love was in Australia! Stephen C. New London Connecticut (home of the Brave).
Wonder Woman is in New Zealand.
Wonder Woman was in the latest Batman v Superman: Dawn of Justice
http://www.aliexpress.com/item-img/Batman-vs-Superman-Dawn-of-Justice-Wonder-Woman-3-in-1-Movie-poster-Fabric-Silk-Poster/32552313981.html?spm=2114.10010108.1000017.2.ZGnqFW
Sorry Stephen, a slow start for me today. Heavy sleep which I really needed.
No apologies needed, whatsoever. My statement was made only to bring some humor to the situation and to echo your heroine status. We’ve grown to depend on your thoughts and ideas immensely.
No worries.
Wondering which chart is in play? Will this peak over 1257 and before 1263 then head down?
Both still are correct at this stage. They’ll both expect this impulse down to end, then they’ll expect upwards movement.
At that stage the price point which differentiates them to the upside will be 1,288.30. A new high above 1,288.30 tells us the correction is over and the next wave up is underway.
But if upwards movement subdivides as a three and doesn’t move above 1,288.30 then the alternate may be correct, more downwards movement.
The move down today is perplexing.
Lara, I think I spotted an anomaly. This has got to do with the data feed. On your main hourly graph, micro 2 is lower than subminuette 2. But on pmbull, that micro 2 (1276.22) is higher than subminuette 2 (1275.71).
I am not too keen on the alternate count because the 1200 level has been tested twice (1202.50, 1206.00) and had held well. A third test in very unlikely, although not impossible.
At the moment, I am looking to see whether Minute C = 1.382 Minute A, ending this drop at 1238.12, just above the invalidation 1237.97. This is while awaiting a possible rework of the main wave count.
I’m checking the 5 minute chart and my data does have the high of micro 2 slightly below the end of subminuette ii.
This data comes from COMEX.
There will be differences between data feeds for this global market.
Gold normally does well when market crashes.
Stock market continuing down today and also since 9:00 am US dollar dropping.
9:00 am is day low for gold at 1243.90.
Any wave counts?
Gold dropped down to low of 1243.90 at 9:00 am below Lara’s 1,250 target and 90 cents from Lara’s minute iii target of 1,243 for the Hourly Alternate. GDX 22.92 NUGT 78.00 premarket lows.
Is that the bottom? Is gold still more likely to be following the main hourly?
Dreamer,
regarding your Nugt chart posted on May 17 page…
Nice Chart. REALLY like these colors and the layout.
was noticing your entry notations for tripple buy in appears to be my anytime buy in. but i’m not following how you have your macd set up and don’t see it here. Care to explain a bit?
do you mean macd in the +, above the zero line?
Hi ds, I read your comment on yesterday’s post first and replied more there. In brief, the chart was by Joanne Klein on public stock charts. You can find them here:
http://stockcharts.com/public/1107832
Detailed Rambus post. Key numbers are 1235 and 1190, very similar to Lara’s confirmation and target for the daily alternate.
https://rambus1.com/2016/05/18/wednesday-report-120/
Avi Gilburt May 15th – Comments on the COT report.
Second, I would like to address the Commitment of Traders report. Many have suggested that simply because one segment of the market is shorting the market it means that the market MUST decline.
As for me, simply because a segment of the market is shorting the market does not mean that segment cannot be wrong. We have seen many times in the past where this segment of the market has been caught on the wrong side of the market.
So, consider what the short covering will do if this segment gets caught on the wrong side of the market this time. Remember, this perspective is truly a double edged sword, and can have just as significant an impact on the long side of the market if they do get caught on the wrong side of price. Therefore, I suggest you follow the price action more so than your fears or general assumptions.
During Bull Markets the Specs have topped out at about 250K contracts long. Right now they are at about 265k (an extreme). If we look at this chart we can see the bottom may occur about 150K long for the specs (again assuming this is a bull market). http://www.cftc.gov/Marketreports/CommitmentsofTraders/index.htm; http://www.cftc.gov/dea/futures/deacmxsf.htm
Note: The commercials are net short about 285K contracts. They are usually correct when they get to extremes like this. All this talk about tightening now might prick this gold bubble a bit and shake out the weak hands.
Thanks for this chart. It really is informative… I’ve stayed away from longing gold for now just due to the COT reports. Once we finish minor 2, whenever that is, it will be a great long opportunity. Its been very difficult to be patient because I’m a long gold bull for sure…
There is also the “news” factor. Everyone and their whole family tree is saying gold will hit $1400+ in the next few months…
in a bullmarket you see relatively strenght. the specs move the price in cycles from low to the high and so on while the physical demand is high. this causes higher highs and higher lows while specs top and bottom at the same levels.
actually i cant see that strenght. and we were already at 280k contracts by the specs when price was at 1286$ so the top propably was abou 300k.
where is the relatively strenght?
watch closley cot report from week to week. if there is no relatively strenght forget about buying at 1200.
actually this is a bubble nothing else.
9 weeks ago we were at 1260$ and the specs were long 170k contracts.
last cot report we also were at 1260$ and the specs are long 270k?
does this look like a typical bullmarket? i dont know.
i think there will be surprises to the downside
another thing is the time period this contracts got built up. normaly to go from 10k to 300k it takes 2 years . we did it in 6 months.
this all looks very unhealthy.
so watch closely cot reprot from week to week.
if there is no relatively strengh coming in i would stay short
The Bullish Percentage for the gold stocks is still way up there, usually bottoming around 0 to 20 percent. Since we may be in a bull market now it may bottom higher this time around.