
Price has moved a little lower after a channel breach of the hourly chart. The long term Elliott wave targets remain the same.
Summary: In the short term, a second wave correction, when it is over, may present an opportunity to join the upwards trend. The short term target for the correction to end is at 1,273. The target for the longer term upwards trend to end is at this stage 1,477.
New updates to this analysis are in bold.
Last published weekly chart is here.
DAILY ELLIOTT WAVE COUNT
Click chart to enlarge.
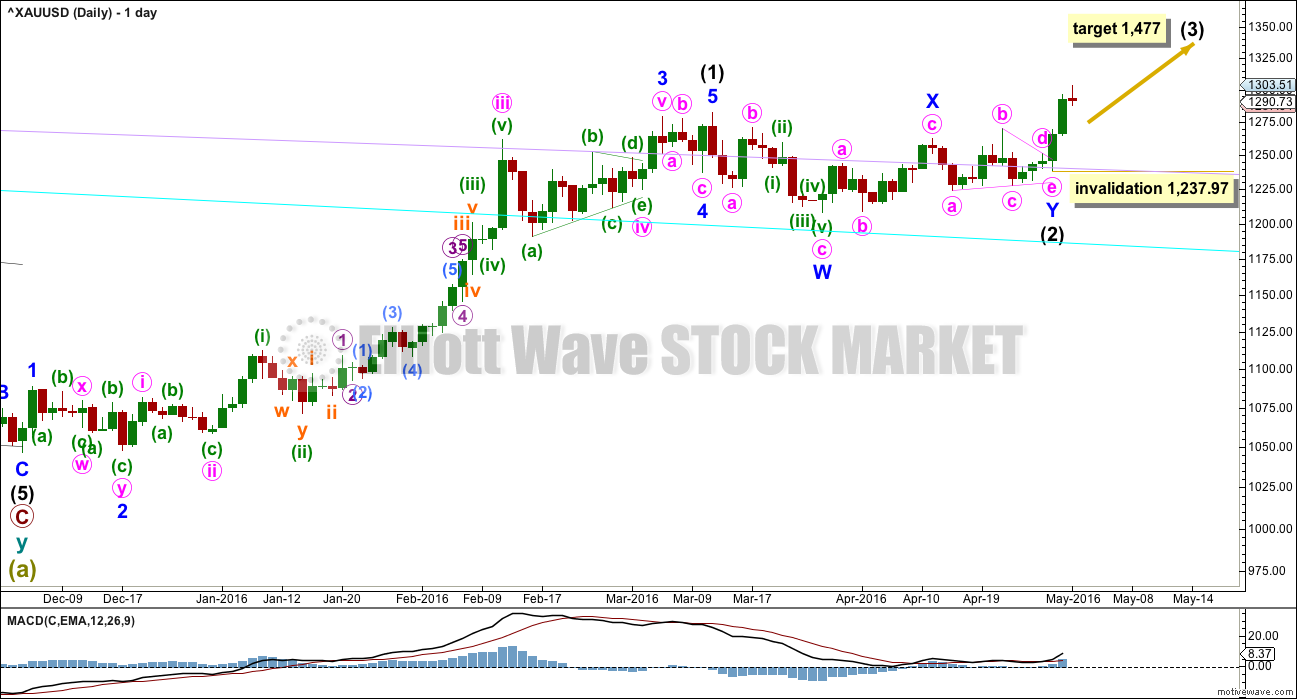
Intermediate wave (2) may be a double combination.
Minor wave W is a zigzag, the first structure in a double. The two structures in the double may be joined by a simple zigzag for minor wave X in the opposite direction.
Minor wave Y may be a running contracting triangle. The triangle is supported by MACD hovering at the zero line here on the daily chart.
Within intermediate wave (3), no second wave correction may move beyond the start of the first wave below 1,237.97.
The next wave up for intermediate wave (3) should be swift and strong. It must move above the end of intermediate wave (1) at 1,282.68. It must move far enough above this point to allow room for intermediate wave (4) to unfold and remain above intermediate wave (1) price territory.
At 1,477 it would reach equality in length with intermediate wave (1). This target is reasonable because intermediate wave (2) was very shallow.
If intermediate wave (2) is over as labelled, then it may have totalled a Fibonacci 34 sessions.
HOURLY ELLIOTT WAVE COUNT
Click chart to enlarge.
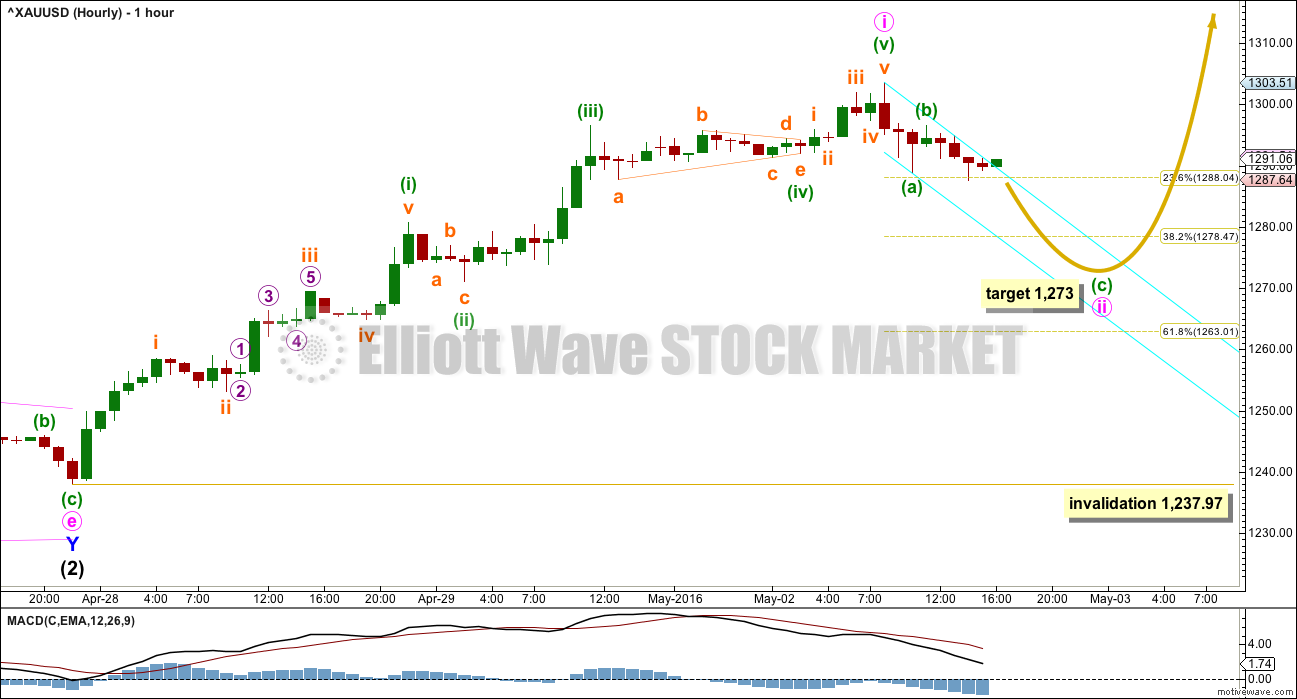
Upwards movement for minute wave i fits as a completed impulse.
Ratios within minute wave i are: minuette wave (iii) is 1.06 short of 0.618 the length of minuette wave (i), and minuette wave (v) has no Fibonacci ratio to either of minuette waves (i) or (iii).
There is alternation between the shallow zigzag of minuette wave (ii) and the more shallow triangle of minuette wave (iv).
If my labelling on this hourly chart is wrong, it would be a premature labelling of minuette wave (b) within the correction of minute wave ii as over. Minuette wave (b) may move higher, and may make a new high above the start of minuette wave (a) at 1,303.51. This is entirely possible because minuette wave (a) fits as a zigzag, a three wave structure, on the five minute chart. It can also be seen as an impulse, so both possibilities must be considered. Minute wave ii may be unfolding as a flat or double zigzag. The structure may be relabelled minuette waves (w) – (x) – (y) for a double zigzag.
If minuette wave (b) is over as labelled, then at 1,273 minuette wave (c) would reach 1.618 the length of minuette wave (a).
Minute wave ii is likely to show up on the daily chart as two to four red candlesticks or doji. It will likely continue overall lower tomorrow.
A low degree second wave correction is not a trading opportunity. It presents an opportunity to join the larger trend. The trend at this stage for Gold is up. Do not trade against the trend. If choosing to enter long during or at the end of minute wave ii, the risk is at 1,237.97. Manage risk carefully. Do not invest more than 3-5% of equity on any one trade and always use a stop loss order. The risk is in the alternate daily wave count below.
ALTERNATE DAILY ELLIOTT WAVE COUNT
Click chart to enlarge.
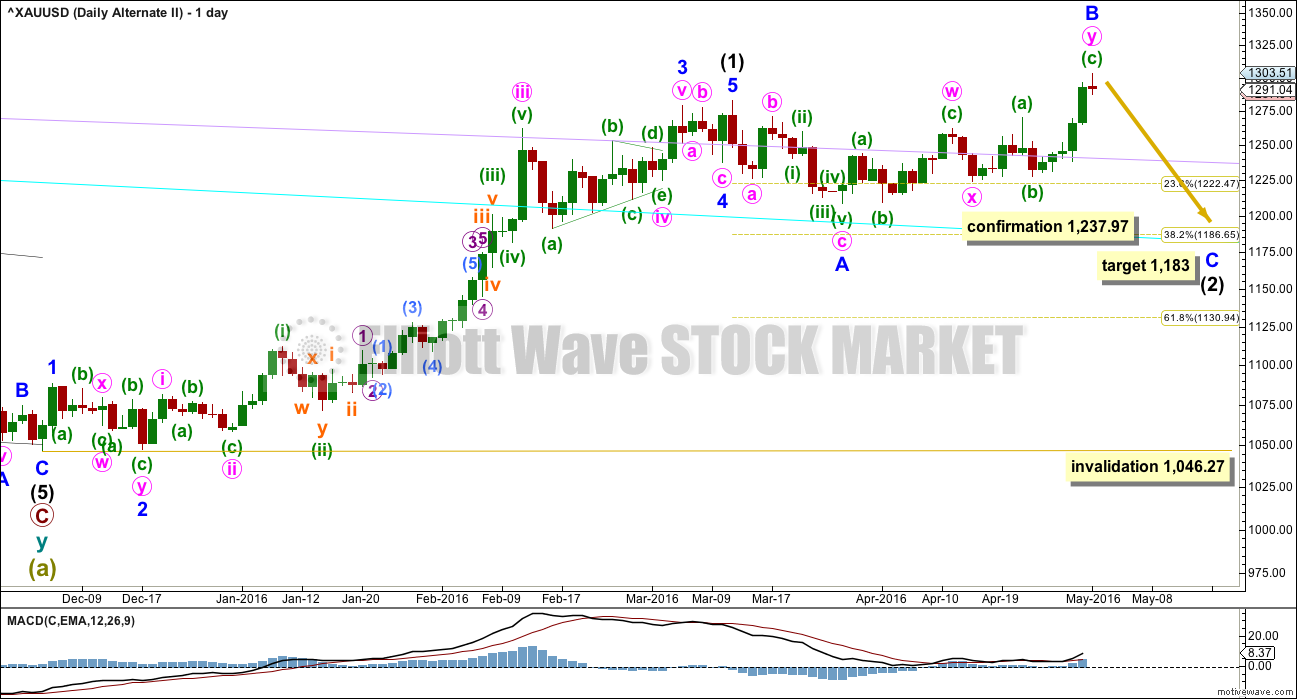
It is still possible that intermediate wave (2) is not over.
Normally, the first large second wave correction within a new trend is very deep, often deeper than the 0.618 Fibonacci ratio. The main wave count sees intermediate wave (2) as very shallow at only 0.19 of intermediate wave (1). This is unusual. And so this alternate must be considered.
If any members have long positions on Gold already it is essential that stops are used in case this alternate unfolds. I have already moved my stop to break even. If the main wave count is right, then I will not have a profit but nor will I have a loss. If this alternate is right, then I can wait until intermediate wave (2) is over to enter long for intermediate wave (3), or possibly enter a small short position to ride down minor wave C.
Intermediate wave (2) may be an expanded flat correction. Minor wave A is a three, minor wave B is a three and now a 1.28 length of minor wave A. This is within the normal range of 1 to 1.38.
At 1,183 minor wave C would reach 1.618 the length of minor wave A. This would be the most likely target. If price keeps falling through this first target, then the second target would be at 1,108 where minor wave C would reach 2.618 the length of minor wave A.
Intermediate wave (2) may not move beyond the start of intermediate wave (1) below 1,046.27.
TECHNICAL ANALYSIS
Click chart to enlarge. Chart courtesy of StockCharts.com.
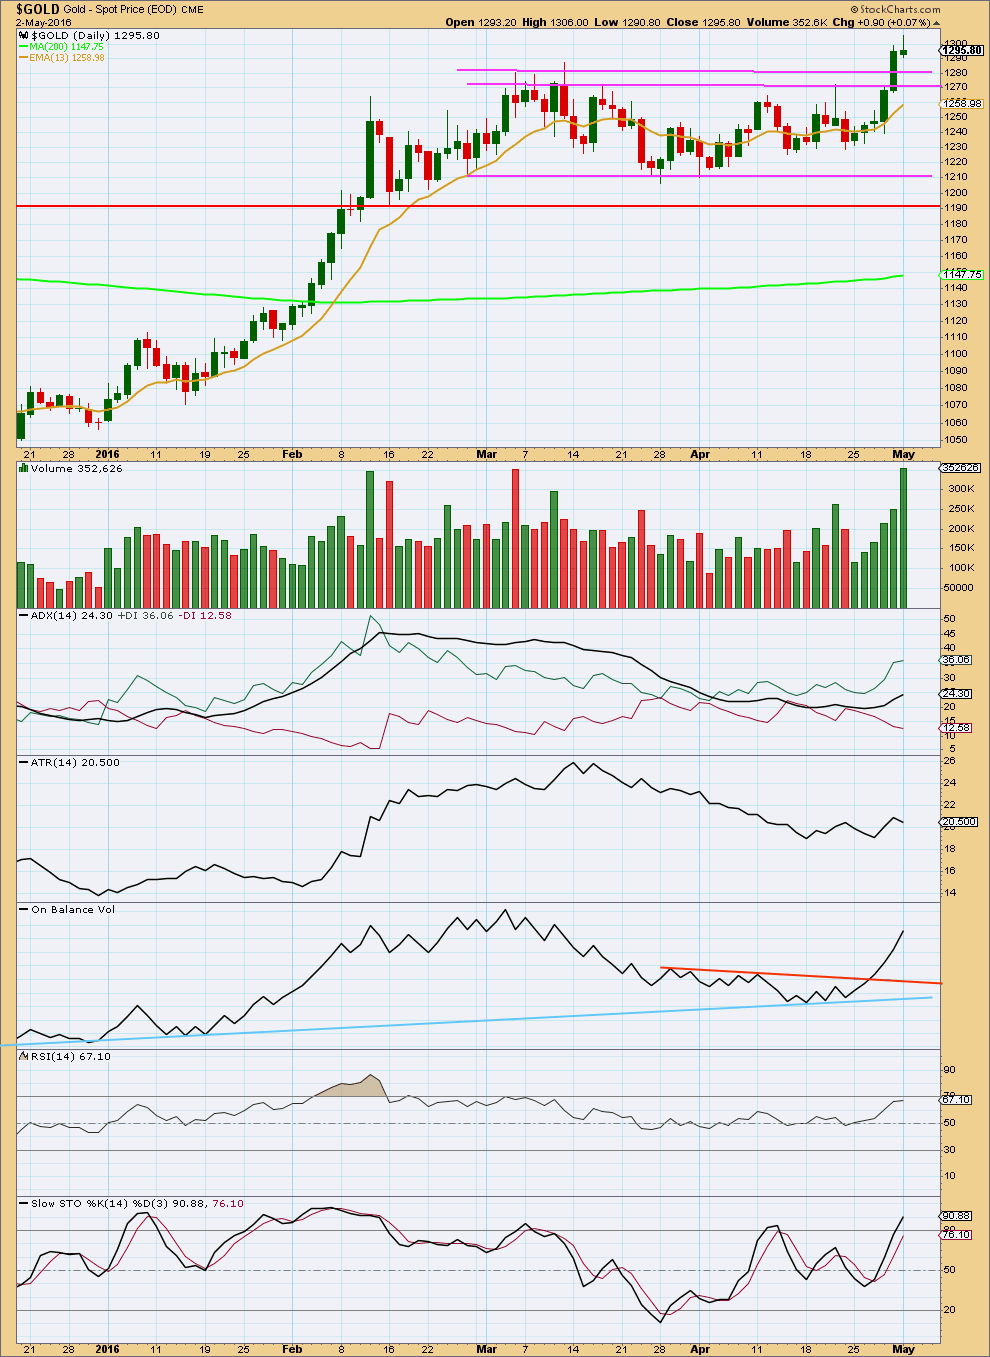
Upwards movement for Friday closed comfortably above prior resistance at 1,280 on a day with increased volume. This looks like a classic breakout from a consolidation.
After a breakout, often price will turn back down for a correction a few days later to find support at prior resistance. Price moved slightly higher today and may now be beginning to turn down for a typical throwback to support. I have added a second support line; there are now two, one about 1,280 and the other about 1,270. Downwards movement may be expected to end at either of these two lines.
For five days in a row price rises with increasing volume. The rise in price is supported by volume. The volume spike for Monday will probably disappear when StockCharts finalise their volume data at 6:30pm EST.
ADX is increasing and the +DX line is above the -DX line. ADX is indicating an upwards trend is in place.
ATR still may be agreeing as it has so far made a small higher high and so far a higher low. ATR may be increasing.
On Balance Volume has given a strong bullish signal with a break above the orange trend line.
While the trend is up, the 13 day moving average may be expected to provide support for counter trend corrections.
RSI is not extreme. There is room for price to rise further.
This technical analysis still supports the main Elliott wave count. It does not support the alternate daily Elliott wave count.
This analysis is published @ 05:27 p.m. EST.
Here’s an updated hourly chart for you. My preferred target for minute ii now would be the 0.618 Fibonacci ratio at 1,263, only because the structure looks like a double zigzag. The second zigzag may deepen the correction to the most common depth.
My labelling of minuette wave (y), the second zigzag, as having subminuette a and b complete may be premature. This could also be labelled micro waves 1-2-3-4 within subminuette a.
Another day to complete maybe. One more red candlestick. Or a doji. Or a candlestick with a long lower shadow.
Hello Lara, Thanks very much for your morning update; our afternoon prior to trading hour close. You are really nailing your projections as of late. Based on the updated hourly chart you just shared, tomorrow could potentially result in a 1.8% gold decline; today’s close to tomorrow’s target price of $1,263. That’s a substantial move that should also impact GDX and DUST. Interesting, nonetheless.
Yes, very exciting minute wave (ii) even deeper at $1,263 and maybe in 1 day, or even if it ‘s 2 days.
Like it to be optimum lower prices for gold and even more so miners for you and your subscribers to buy in on this dip opportunity to join the trend up over $200 to $1,477, WOW!
You’re welcome. It doesn’t have to correct that deep, but for a double zigzag that would be my expectation of most likely.
It may still only correct to the 0.382 Fibonacci ratio.
I’m looking to add to my buy position when it comes down lower.
Looks like a classic breakout from consolidation, followed by a turn to test support. The perfect trade set up IMHO. My favourite.
Lara: USDX had a very strong reversal today, should continue higher for a while, looks like. XAU and USDX had a very close inverse correlation on the way up (for gold) — favors your alt count, with minor C down.
Yes today for the 1st time since April 22nd the US dollar index moved up.
http://www.investing.com/quotes/us-dollar-index-streaming-chart
Did the 5th subwave of Minuette Y down end today at 11:00 gold low of 1282.31 of may it be another day for gold low to this correction?
Maybe not as Lara said, “Minute wave ii is likely to show up on the daily chart as two to four red candlesticks or doji. It will likely continue overall lower tomorrow.”
Monday was the 1st red candlestick.
I think the 5th subwave (subminuette 5) has just started. Micro 1 is done at 1284.92.
Minute 2 will need at least tomorrow to complete.
Then maybe Wednesday gold may hit the 1273 target for minute wave (ii) then to get gold down another $10 below today.
US dollar index coming back bullish today since dropping from April 22nd to big lows.
http://www.investing.com/quotes/us-dollar-index-streaming-chart
Gold Hits 15-mth High; Expect More Dollar Weakness Says Peter Hug
May 02, 2016
http://www.kitco.com/news/video/show/For-Petes-Sake/1249/2016-05-02/Gold-Hits-15-mth-High-Expect-More-Dollar-Weakness-Says-Peter-Hug
Too Far, Too Fast? Gold Up 19% YTD, But Are Commodities Really Making a Comeback?
May 02, 2016
Guest(s): Frank Holmes
KITCO video with Daniela Cambone
http://www.kitco.com/news/video/show/Gold-Game-Film/1250/2016-05-02/Too-Far-Too-Fast-Gold-Up-19-YTD–But-Are-Commodities-Really-Making-a-Comeback
What is the smart money saying about gold and silver? – May 3, 2016 12:07 p.m. ET
http://www.marketwatch.com/story/what-is-the-smart-money-saying-about-gold-and-silver-2016-05-03#:R6p2nTMFHkAf-A
Gold, oil and the markets are down today.
The US dollar had dropped since April 22nd until today as bouncing up today since 4 am when gold started dropping.
I think Minute 2 has morphed into a double zigzag. Currently we are in Minuette Y, subminuette 3, probably completed micro 3 @ 1285.51.
I will wait for the end of Minute 2 before placing a trade in NUGT. My target for Minute 2 to end is 1278.63 (0.382 retrace of Minute 1) or 1275.84 (1.618 X Minuette W).
Good luck guys. I’ll be spending some time with S&P (waiting to short after a rebound) and oil (playing for a bounce, contrarian to main trend).
Thanks Alan for sharing your entry target. I’ve been waiting too. (It’s almost here!).
And I’ve also been waiting at S&P before adding to position, want to make sure that one is secure for no wiggling out of acceleration down. Wishing you a wonderful day!
Hi dsprospering. You have a wonderful day too.
I really hate these 4-5 grinds. But, somehow we’ll get there. S&P and oil are also slowing down. Must be due to the lunch hour.
Now in 5th subwave of Minuette Y down, I think.
Good to hear. Looking for a gold bottom today on this correction.
Gold and Silver are in an early bull trend BUY position on group cycle chart by
RBC Wealth Management
I tend not to trust bank calls.
I tend to not trust banks. 🙂
The only bank I trust is the river bank.
LOL
I agree that banks may not all be trustworthy, however it is nice that they also agree that gold and silver are a BUY and early in the wave.
Gold just jumped up to an after hours high of 1,297.15 at 9:10 pm, hopefully it stays under the market hours high of 1,297.28 at 11:44 am and still drops down to the 1,273 target if that is possible.
“If my labelling on this hourly chart is wrong, it would be a premature labelling of minuette wave (b) within the correction of minute wave ii as over. Minuette wave (b) may move higher, and may make a new high above the start of minuette wave (a) at 1,303.51. This is entirely possible because minuette wave (a) fits as a zigzag, a three wave structure, on the five minute chart. It can also be seen as an impulse, so both possibilities must be considered. Minute wave ii may be unfolding as a flat or double zigzag. The structure may be relabelled minuette waves (w) – (x) – (y) for a double zigzag.”
So far it looks corrective on the hourly chart. From the low of Monday it looks like a three.
And so far it’s just 0.875 of the prior wave down. So not deep enough yet for a flat correction.
Lara: is this an option? Thanks.
Technically, yes.
But then the fourth wave would be enormous, 34 days compared to the second wave of 9 days.
That gives the wave count a pretty horrible look. So I wouldn’t consider it very seriously.
It is the proportion between a second wave and a fourth wave correction within an impulse that give it the “right look”. They have to be somewhat even.