
The first target for upwards movement at 1,277 was met and exceeded by only 0.77.
Summary: A downwards correction looks like it is more likely now to start on Monday and last at least one week. This would be confirmed by a breach of the channel on the hourly chart, and the target would then be about 1,230. If upwards movement continues though, the next target is at 1,289. If price keeps rising through this target, then the next (less likely) target would be 1,297.
Trading advice: It is possible that the expected correction may not materialise soon (this has happened before), so a buy the dips approach may be used for more adventurous traders. Each time price touches the lower edge of the channel a long position may be entered with a stop close by just below the lower edge of the channel. If the trend continues for some time, such a long position should become profitable quickly; as soon as the position is profitable and price moves up and away from the channel, move the stop to break even to limit risk. If the channel is breached and the position is negative, the loss should be cut quickly short. As always, invest no more than 3-5% of equity on any one trade and always use a stop loss. Any members who used this approach during Friday’s session are advised to either take profits or at least move stops to at or just above break even.
New updates to this analysis are in bold.
To see last weekly charts click here.
DAILY ELLIOTT WAVE COUNT
Click chart to enlarge.
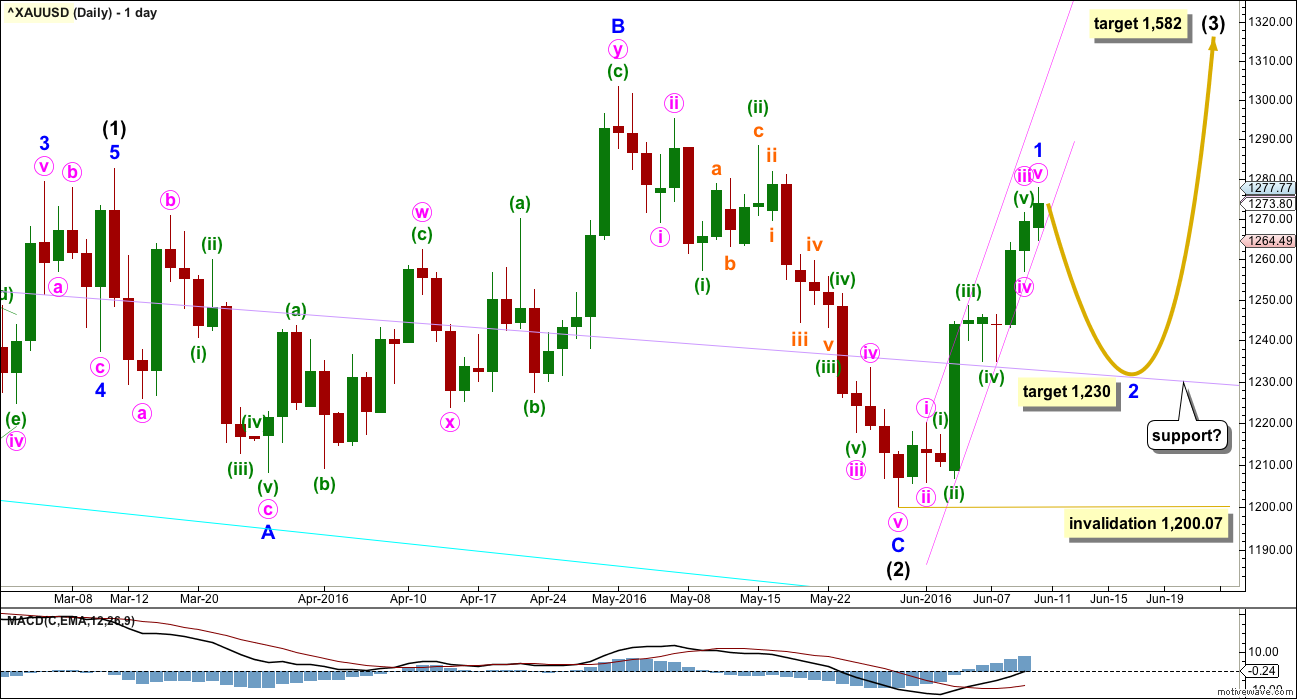
Intermediate wave (2) may be a complete expanded flat correction. It would be a shallow 0.350 correction of intermediate wave (1) lasting 56 days, just one more than a Fibonacci 55. There is no Fibonacci ratio between minor waves A and C. Minor wave C is a complete impulse.
Within intermediate wave (3), no second wave correction may move beyond the start of its first wave below 1,200.07.
When minor wave 1 is complete, then a following second wave correction should unfold and last about one to two weeks. If this wave count is correct, then the upcoming second wave correction may offer an opportunity to join the upwards trend at a good price. If minor wave 2 is deep, then it may find support at the lilac trend line (copied over from the weekly chart). Weekly and daily charts are always on a semi-log scale.
The main hourly wave count below expects that minor wave 2 may begin on Monday. If this is confirmed by a breach of the channel on the hourly chart, then the target for it to end would be the 0.618 Fibonacci ratio of minor wave 1 at 1,230, which is where price would find support at the lilac trend line.
At 1,582 intermediate wave (3) would reach 1.618 the length of intermediate wave (1).
The pink channel today is drawn on the daily chart to show exactly how it is drawn. Draw the first trend line from the highs labelled minute waves i to minuette wave (iii), then pull a parallel copy down to sit along all the lows of the last few days. Copy this over carefully to the hourly chart which should be on an arithmetic scale. The lower edge of the channel is perfectly showing where price is finding support for a few days now, so a breach would be a good indication of a trend change for a pullback. This channel is steep, so it should not be expected to hold for much longer.
MAIN HOURLY ELLIOTT WAVE COUNT
Click chart to enlarge.
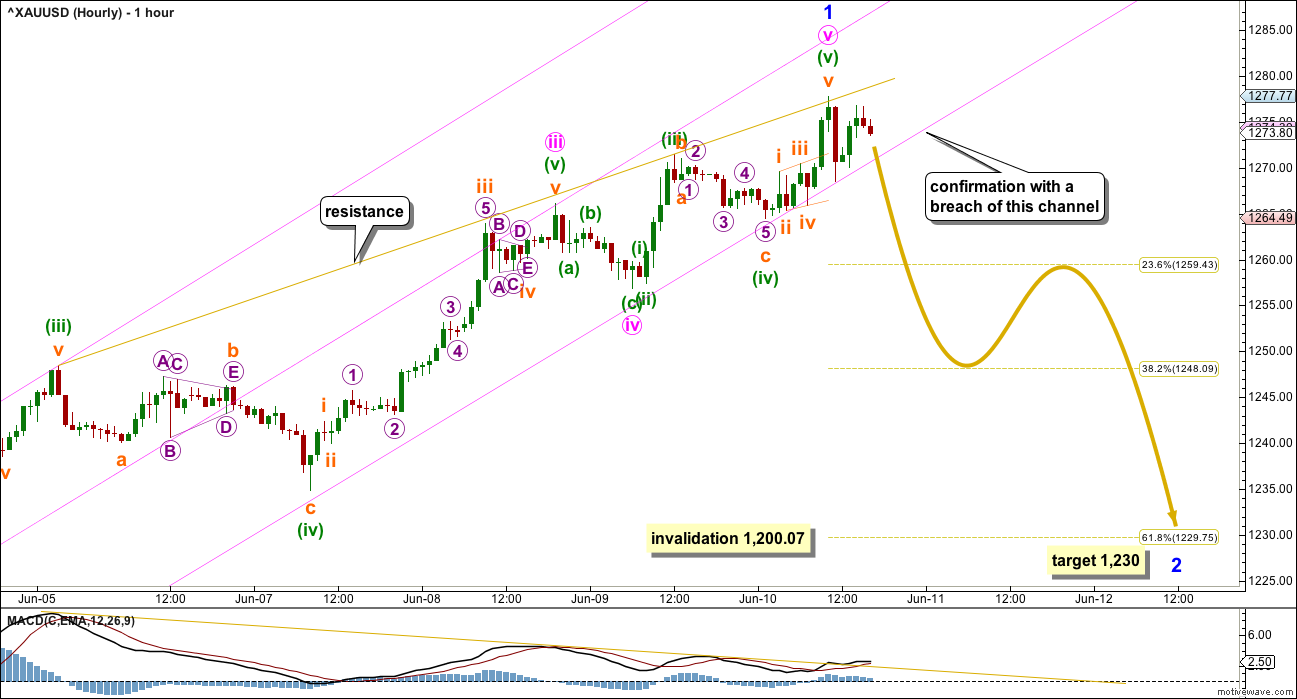
The middle of minute wave iii so far has strongest momentum. This wave count still fits with MACD.
There is no Fibonacci ratio between minute waves i and iii. It is still more likely that minute wave v will exhibit a Fibonacci ratio to either of minute waves i or iii.
If minute wave v was over at the high for Friday, then it would be just 0.81 longer than equality in length with minute wave i. This is the most common ratio for a fifth wave, so this wave count has a reasonable probability. Minuette wave (v) fits as an ending expanding diagonal meeting all Elliott wave rules.
A gold trend line is added today to show where price is finding resistance. If price breaks above this line, then a long position would be advisable as it would indicate strengthening upwards movement and a possible surprise to the upside.
So far within minor wave 1 the strongest extension is the third wave. There is triple bearish divergence today at the hourly chart level with price and MACD (gold lines on price and MACD). The fifth wave so far does not look like it will be a swift strong extension.
Gold, like all commodities, has a tendency to exhibit strong fifth waves. This tendency commonly turns up at the end of its third wave impulses, not so often at the end of its first wave impulses. It is when price is nearing the end of minor wave 3 within intermediate wave (3) that we may see a blowoff top in Gold, and possibly also the end of intermediate wave (3). For now price is early on in this upwards trend. Gold often will exhibit one to a few more time consuming corrections early on, so that the whole movement has a curved look.
Although it is possible that members may miss out on joining a good upwards trend at this stage, it would still be more likely that minor wave 2 will turn up sooner rather than later and will offer a good entry point. This statement is based upon my experience, and today it is supported by light volume, declining momentum, declining ATR, price sitting within the lower half of the pink channel and a stalled candlestick pattern on the daily chart. This does not mean that minor wave 2 must turn up on Monday, only that on balance of probability it is my judgement that it is more likely to turn up..
When the channel is breached by a full hourly candlestick below and not touching the lower edge, preferably by clear downwards (not sideways) movement, then the channel shall be indicating a short term trend change for Gold. At that stage, the 0.618 Fibonacci ratio at 1,230 would be a reasonable target for minor wave 2.
So far minor wave 1 has lasted ten days. It may not exhibit a Fibonacci ratio or it may continue a further three days to total a Fibonacci thirteen. Minor wave 2 may be expected to last about a Fibonacci five or eight days, or possibly longer.
ALTERNATE HOURLY ELLIOTT WAVE COUNT
Click chart to enlarge.
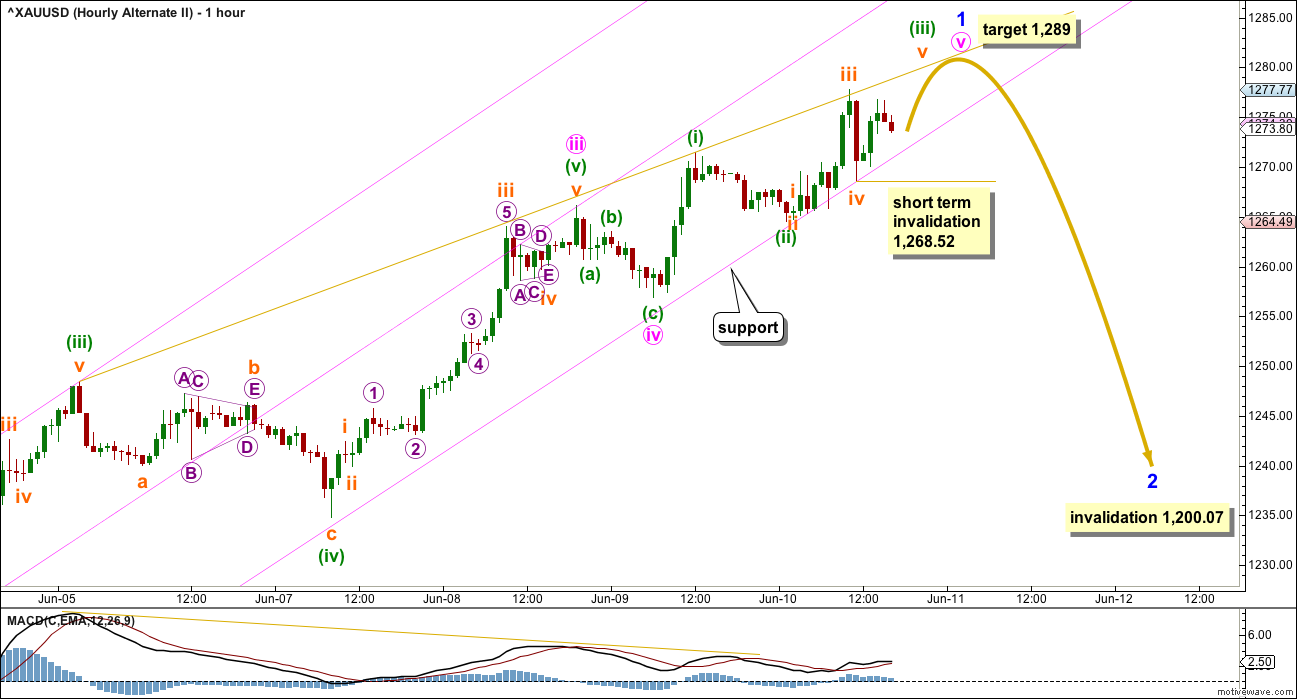
What if price keeps rising on Monday? A new high above 1,277.77 would confirm this wave count short term. At that stage, the next target for minute wave v would be at 1,289 where it would reach 1.618 the length of minute wave i.
If price keeps going up through this target, then the next target would be about 1,297 where minute wave v would reach 0.618 the length of minute wave i. This target has a lower probability though because a ratio between minute waves v and i is more likely than a ratio between minute waves v and iii.
If price breaks above the gold trend line on Monday, then the first target may be inadequate. If that happens, then momentum may also increase to the upside.
In the short term, within subminuette wave v, no second wave correction may move beyond the start of its first wave below 1,268.52. A new low below this price point would also mean a breach of the pink channel and confirmation of the main wave count.
TECHNICAL ANALYSIS
DAILY CHART
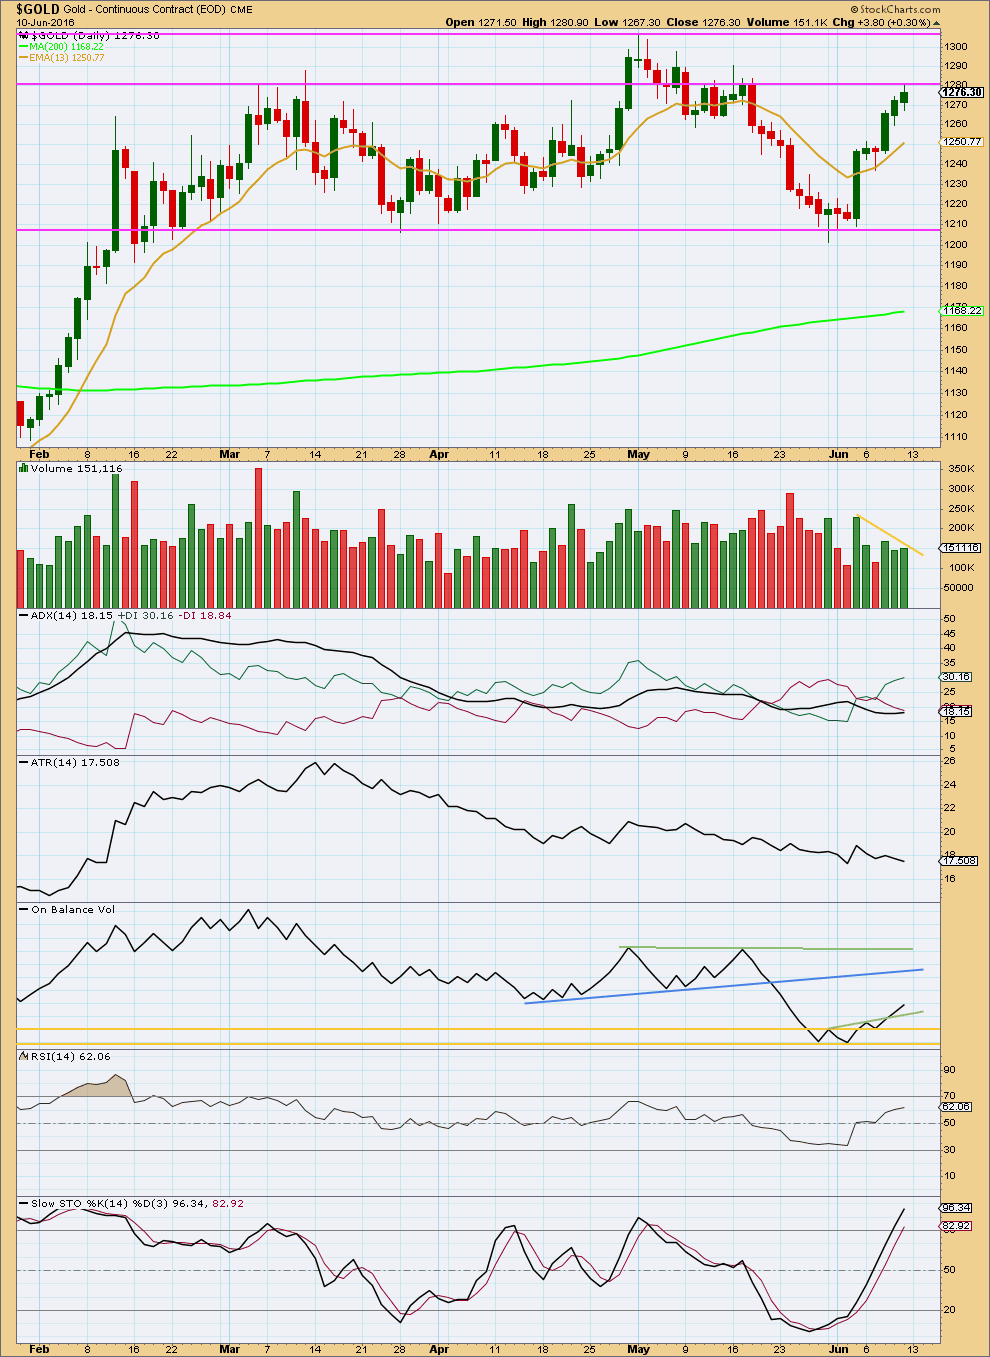
Click chart to enlarge. Chart courtesy of StockCharts.com.
Another upwards day comes with a slight increase in volume, so there was some small support for the rise in price today. However, volume remained light for Friday’s session and has been overall declining since the start of this small upwards wave (gold line on volume). This indicates some weakness at the end of this small trend.
Friday’s green candlestick completes a stalled pattern. This indicates exhaustion from bulls and a potential pullback about here. There is some reasonable resistance about 1,280 to support the idea of a pullback here.
ADX is now slightly increasing indicating an upwards trend is in the very early stages. ATR is still declining though. Some disagreement at the start of a new trend between these two indicators is common. However, these are both based on 14 day averages. There has now been overall nine days of upwards movement, so declining ATR at this stage indicates some weakness at the end of this small trend.
On Balance Volume continues to agree with price and is bullish.
There is no divergence between price and RSI to indicate weakness. RSI is not yet extreme. There is still room for price to rise further yet.
There is no divergence between price and Stochastics to indicate weakness. Stochastics is only just entering overbought. There is room for price to rise a little further yet.
This analysis is published @ 04:00 a.m. EST on 11 June, 2016.
At this point I can’t see the structure of minute wave v complete. I think it now needs at least one more high. The target will remain at 1,289 or 1,297.
For the question of profits for long positions: either 1,289 or wait until the trend line is breached.
That means you won’t get the high, but TBH trying to pick highs and lows is a fools game. Aim to get the bulk of the movement, don’t try to exit right at the high.
Get in after confirmation, get out after confirmation. That’s a pretty good general rule.
Alternatively for scalpers draw a trend line for resistance and take profits each time price touches that. Enter long each time price touches support.
Price just keeps on going up, and keeps on showing further weakness.
While it will turn at some stage for a correction we must assume the trend remains the same until proven otherwise; that is, we should assume it is up until price breaks below that lower edge of the channel.
If any members have entered long at any point where Gold touched the lower pink trend line, if your position is positive then move the stop to at least break even. If the position is comfortably positive now then move stops up to just below the trend line. I would calculate this to be about 1,278 at this point. That would allow for a small overshoot, but would close the position if the channel is breached.
On hourly wave count these are three V’s at unfolding.
What is the target of v (pink)?
Gold is at 1286. May be another $3???
Then corrective wave 2 to unfold here.
1,289 where minute v = 1.618 X minute i
Alternate hourly II wave count has been confirmed as gold just hit high of 1,278.47 at 8:19 pm Sunday.
” A new high above 1,277.77 would confirm this wave count short term. At that stage, the next target for minute wave v would be at 1,289 where it would reach 1.618 the length of minute wave i.”
Gold has broken above that yellow trend line on the hourly chart too. Look out for a surprise to the upside possibly!
More likely downwards Monday.
When below 1268.52 minor 2 down started 1 – 2 weeks to 1,230 (favoured) and hourly alternate II invalidated.
When above 1,277.77 then the next target is 1,289.
If price keeps going up through this target, then the next target would be about 1,297
FED FOMC this Wednesday 2:00 pm would be a Fibonacci 13th day of minor wave 1.
So far minor wave 1 has lasted ten days. It may not exhibit a Fibonacci ratio or it may continue a further three days to total a Fibonacci thirteen.
GUNNER24 June 12
Gold reaching, overshooting the 1272 – which way is it going to proceed
http://www.gunner24.com/newsletter/nl-061216/
Lara: Ron Rosen still calling the move up here is a wave c of a running flat.
Your wave count calling a cycle wave b up.
I am long for the ride in miners.
http://www.321gold.com/editorials/rosen/rosen061216.pdf
No… just… that makes no sense. None at all.
Wave C of that possible running flat not only is truncated, it doesn’t even take price back into wave A territory.
Wave A has it’s range from 1,032.80 in March 2008 to 682.75 in October 2008.
Wave B is 3.53 X the length of wave A.
Wave C has it’s low in December 2015 at 1,046.27.
That is a ridiculous wave count, I would hesitate to even call it Elliott wave.
This is IMO an excellent example of you can make anything pretty much you like fit if you ignore guidelines and the right look.
It doesn’t technically break any rules… only because there is no rule for a running flat that says wave C has to end somewhere within wave A price territory. But there should be.
At its end this possible running flat does not retrace any of the prior impulse. It ends above the end of the impulse.
Now again, there isn’t an EW rule in Frost and Prechter that says this is wrong, but there should be. Reading what the waves are supposed to do.. this is just ridiculous.
I wouldn’t be reading this persons work. It may well be that price keeps going in the expected direction for some time and it looks like he’s right, but with a wave count like that eventually it won’t work.
Because this is at a monthly chart level it could still look right for a long time.
Lara, I love reading your critique of other peoples EW charts.
I think they would go berserk if they read it, LOL.
Here’s some interesting charts on the miners from Fullgoldcrown. If the miners were to consolidate longer as shown on the weekly charts here, there would likely need to be some other EW option for gold. This could allow GDX the opportunity for gap fills down to around 20ish. Something to watch as a possibility.
https://goldtadise.com/?p=373168