
Yesterday’s analysis expected one more high to 1,289. Price moved up to a high at 1,289.59 for the session.
Summary: The trend is tired but may still not be over even though the channel is breached. Another high to 1,300 may still unfold.
Trading advice: This trend is very tired, so risk in any long positions is increased today. The trend could now change more quickly. Long positions for the last piece of movement should be attempted only by experienced traders; if less experienced, then it would be wisest to step aside now.
If trying to scalp this final upwards movement, reduce risk by waiting first for a new high above 1,289.59. Stops may be set just below the last swing low. Take profit if price reaches 1,300. The trend is still up (not enough confirmation of a trend change can be seen today), so no short positions should be entered.
New updates to this analysis are in bold.
To see last weekly charts click here.
DAILY ELLIOTT WAVE COUNT
Click chart to enlarge.
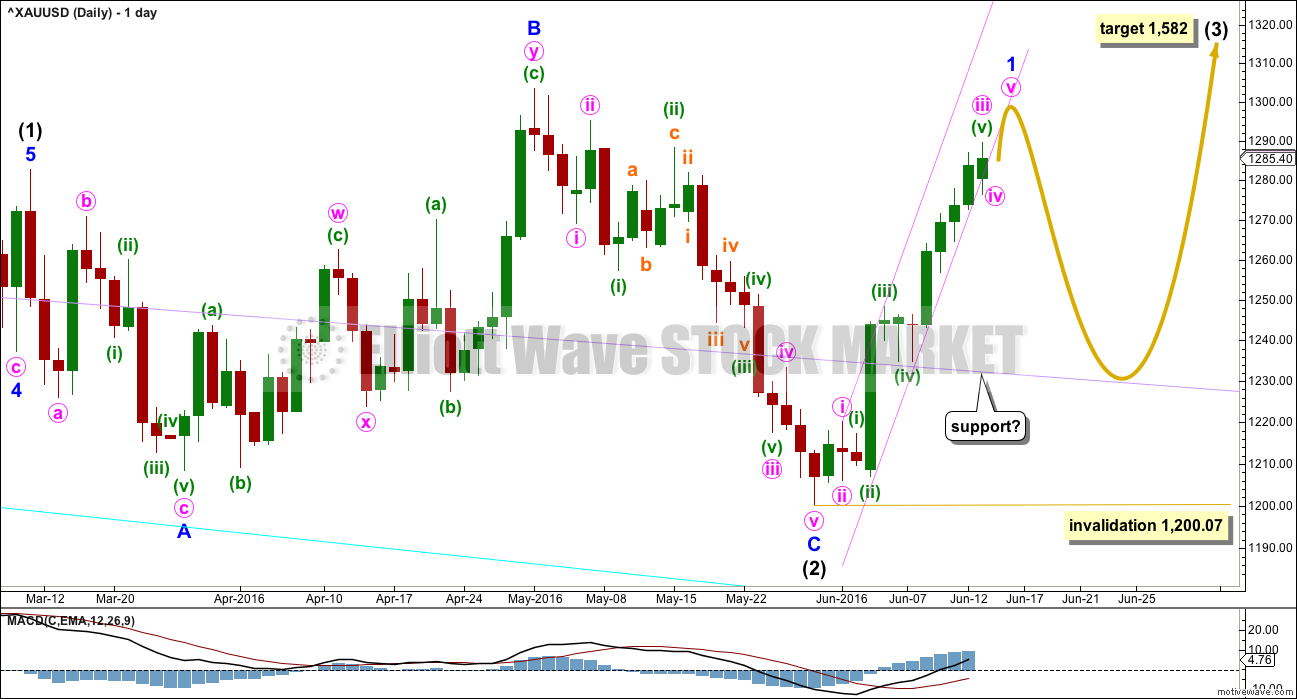
Intermediate wave (2) may be a complete expanded flat correction. It would be a shallow 0.350 correction of intermediate wave (1) lasting 56 days, just one more than a Fibonacci 55. There is no Fibonacci ratio between minor waves A and C. Minor wave C is a complete impulse.
Within intermediate wave (3), no second wave correction may move beyond the start of its first wave below 1,200.07.
When minor wave 1 is complete, then a following second wave correction should unfold and last about one to two weeks. If this wave count is correct, then the upcoming second wave correction may offer an opportunity to join the upwards trend at a good price. If minor wave 2 is deep, then it may find support at the lilac trend line (copied over from the weekly chart). Weekly and daily charts are always on a semi-log scale.
At 1,582 intermediate wave (3) would reach 1.618 the length of intermediate wave (1).
The pink channel is drawn on the daily chart to show exactly how it is drawn. Draw the first trend line from the highs labelled minute waves i to minuette wave (iii), then pull a parallel copy down to sit along all the lows of the last few days. Copy this over carefully to the hourly chart which should be on an arithmetic scale. The lower edge of this channel was breached in the last 24 hours, yet price then turned up to make a new high. This is unusual behaviour from Gold and indicates further weakness in the upwards trend.
Sometimes fourth waves are not always contained within channels, so that may be what is happening here.
MAIN HOURLY ELLIOTT WAVE COUNT
Click chart to enlarge.
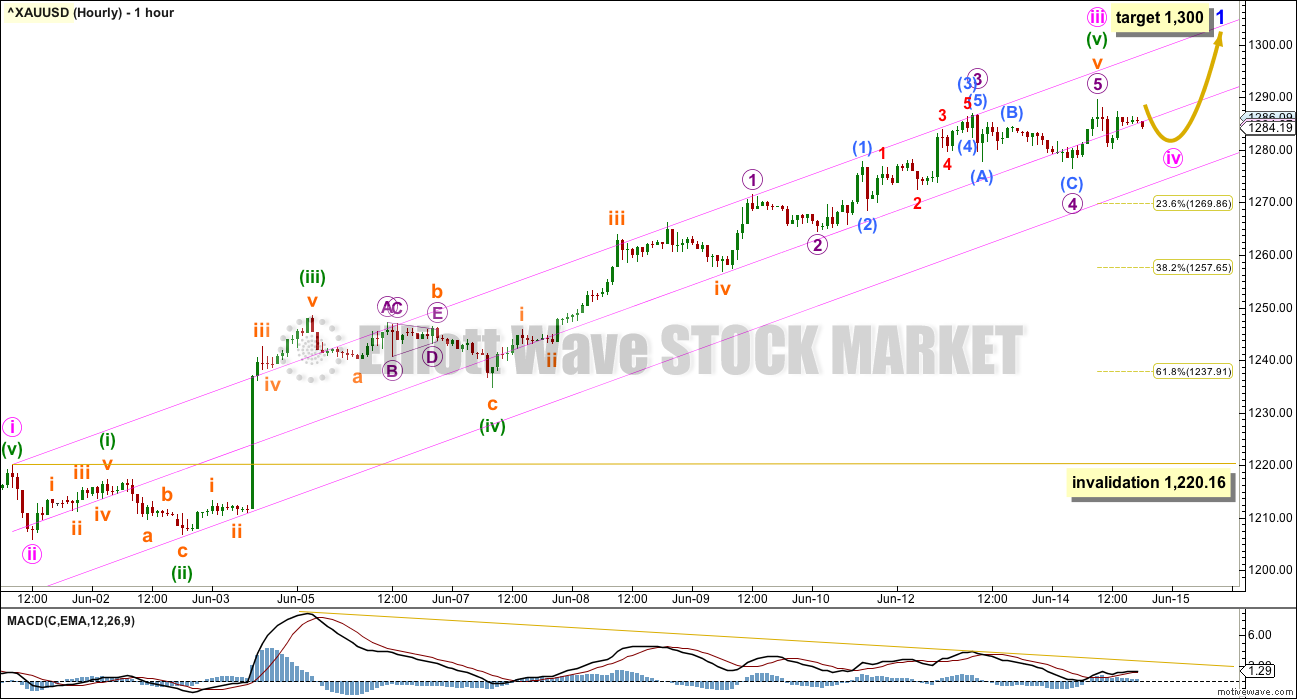
The channel is slightly redrawn on this hourly chart. Draw the channel from the end of minute wave i to the last high, then place a parallel copy on the end of minuette wave (ii). This channel shows mostly were upwards movement found resistance and contains all downwards movement.
Minute wave iv, if it continues sideways, may find support at the lower edge of this redrawn channel.
At about 1,300 minute wave v would reach equality in length with minute wave i. If minute wave iv moves substantially lower, then this target must be recalculated. It assumes minute wave iv will be a shallow sideways correction. This is a reasonable assumption, but it must be understood this is not necessarily how minute wave iv may unfold.
Minute wave iii is here 1.48 short of 4.236 the length of minute wave i.
Minute wave ii was a deep quick zigzag. Minute wave iv may exhibit alternation as a shallow sideways combination, flat or triangle. At this stage, it looks like it may be unfolding as a small triangle.
On the five minute chart, the first wave down from the last high subdivides best as a zigzag. This is a strong reason for the probability today being judged as higher for this wave count.
Minute wave iv may not move into minute wave i price territory below 1,220.16.
ALTERNATE HOURLY ELLIOTT WAVE COUNT
Click chart to enlarge.
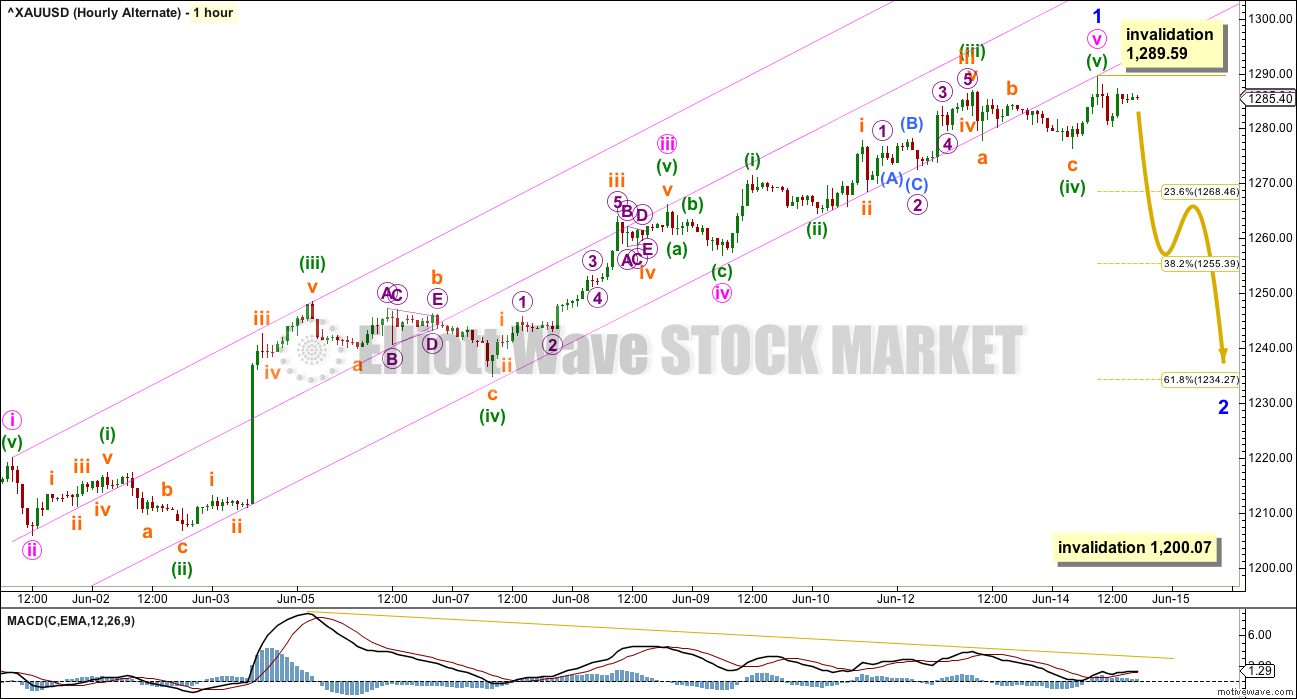
Alternatively, upwards movement may be over.
Minute wave iii here has no Fibonacci ratio to minute wave i, and minute wave v is just 0.22 longer than 1.618 the length of minute wave i.
Within minor wave 2, no second wave correction may move beyond the start of its first wave above 1,289.59.
Minor wave 2 may last about one to two weeks. The most likely target would be the 0.618 Fibonacci ratio at 1,234.
Minor wave 2 may not move beyond the start of minor wave 1 below 1,200.07.
Unfortunately, at this stage, there is no lower price point which is close enough to differentiate the two wave counts. The main wave count would only be invalidated with a new low below 1,220.16, but that point is below the target for this alternate wave count.
The best approach may be to use the cyan trend line which is exactly the same as the lower edge of the redrawn channel on the main hourly chart. When price breaks below this trend line, then it will be taken as confirmation that a high is in place and minor wave 2 is underway.
TECHNICAL ANALYSIS
DAILY CHART
Click chart to enlarge. Chart courtesy of StockCharts.com.
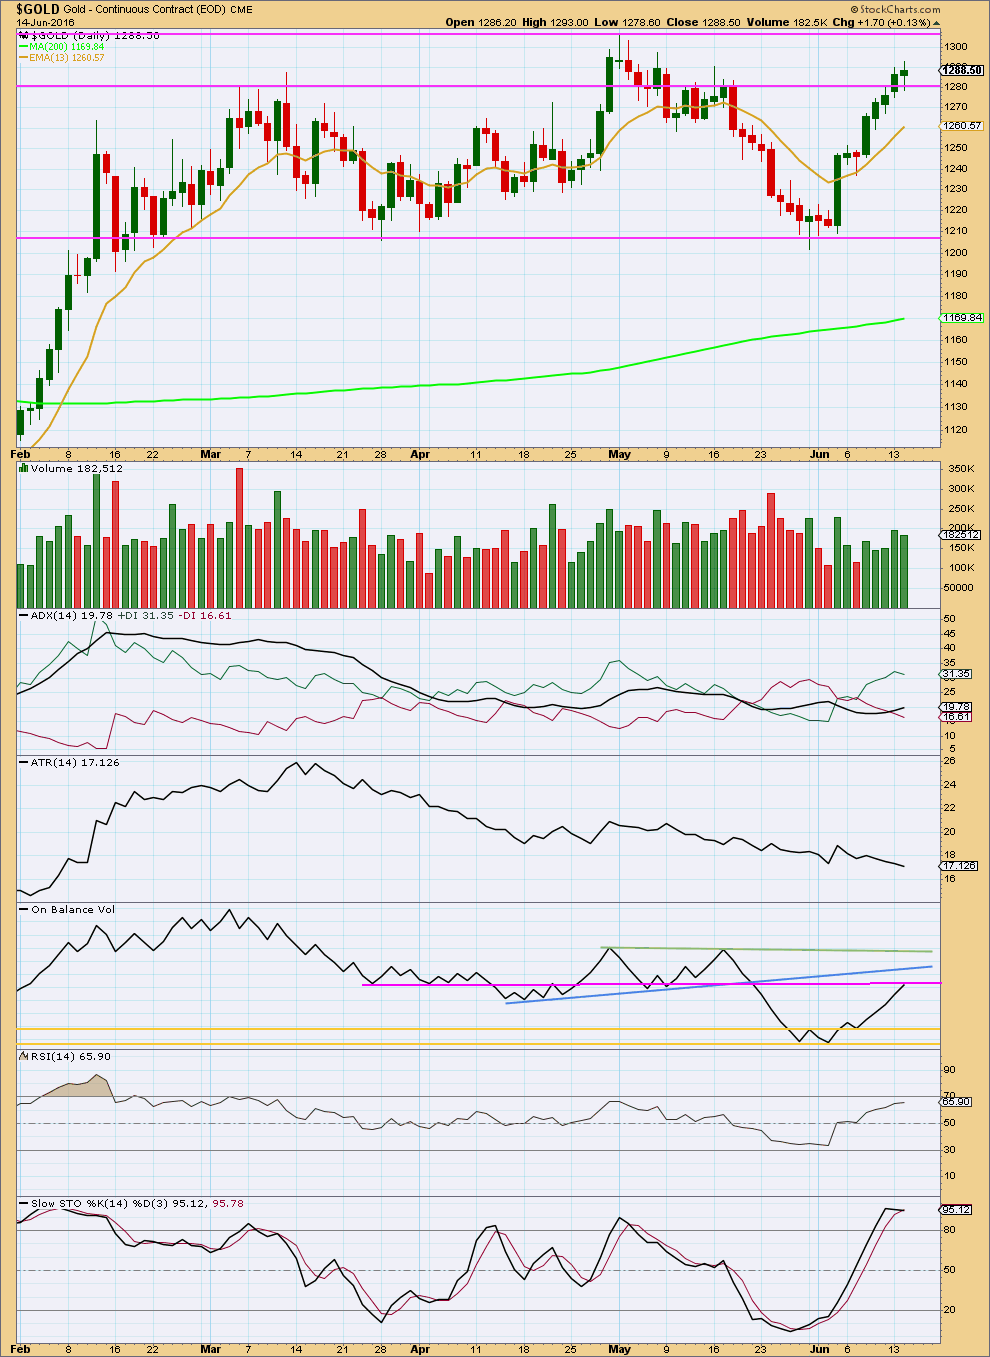
Overall, volume is rising as price moves higher. Volume today is slightly reduced. There is not as much support for the rise in price today. The real body of today’s candlestick is smaller with long upper and lower shadows. Bulls and bears were more balanced today, with the bulls still winning. Price found support about the horizontal trend line at 1,280 for the session.
ADX still indicates an upwards trend is in place. ATR continues to disagree. With declining range, this trend looks tired as price moves higher.
On Balance Volume has today come up to touch a new pink trend line. This may offer some resistance. This trend line supports the alternate hourly Elliott wave count over the main hourly wave count.
RSI is not yet overbought for this session. There is still room for price to rise further.
Stochastics is today showing slight divergence with price: Stochastics slightly turned down as price made a new high today. This divergence indicates further weakness to upwards movement, but it cannot pin point exactly where and when price may turn.
At this stage, the short term picture is unclear. This trend is tired and may be expected to end soon, but it is not clear that it has ended now.
This analysis is published @ 07:10 p.m. EST.
Hi Richard. I’m always happy to read your excellent comments.
May I ask you where I can find the NUGT(free?) charts with the indicators you mention:
MACD,minute time frames …
Thanks a lot.
Jacques I will give it the website and PRO trading platform and Live and real time all free in the comments section on Lara’s analysis tonight.
Hi all.
As many traders trade nugt, gdx and gold stocks, where are we on wave count with GDX? Any ideas?
Harder to figure out the GDX count than the gold count. Lara sill thinks the gold target is at $1,300 so that would be the GDX target.
If I have the time today I’ll post a GDX chart, probably chart only as I expect I may be surfing this afternoon until my finger tips are numb and my toes are frozen 🙂 And I have a happy stoked grin from ear to ear
A new GDX chart is wonderful.
Lara as always, you’re the best!
Enjoy your “BLISS” surfing that compensates for the frozen fingers and toes.
And the main hourly count is correct…. Target still 1,300. It’s reasonable to expect price to find resistance at that round number pivot.
With continuing divergence, now quadruple, between price and MACD on the hourly chart this still looks weak.
Thanks Lara for that affirmation. Good timing.
The fastest news on the FED FOMC here some are just headlines others articles
http://www.marketwatch.com/newsviewer
looks like nugt is about to go, don’t have a buy signal yet but getting close, may buy some, but only a tiny fraction
I think that gold is poised to go up or down now and will coast sideways until 2:00 pm EST FED FOMC news then go up if no interest rated timing given or down if they do sound like they are about to raise the interest rates and do mention July or September.
Shahab, you were right about NUGT. Right at 1:35 pm NUGT got a MACD Buy and a fired Buy and a EMA/SMA Buy for the 1 minute and 5 minute time frames.
Then at 2:00 pm got Buys at the 15 minute time frame for NUGT and 15 and 39 minute time frames for Gold.
I got in 2 small and profitable trades for NUGT after FOMC released.
Excellent! Got in at 102.20 and out at 111.50. Did not want to stay to long. Looks like we are about to end minor 1.
Nugt hourly chart looks ugly now!
Awesome trade for you!
Good trade. I got in at 99.88 at 11 am and relinquished at 112.75 around 3 pm. That was the end of minuette 3. I got out because I didn’t want to risk a possible prolonged minuette 4. Anyway, my gamble on no rate hike paid off. I surmised the Fed wanted to err on the side of caution.
It’s quite a pity. Price closed in the middle of subminuette 3 of minuette 5. A little more movement and we could have hit 1300.
Anybody willing to short at 1300 for a $60 drop? Should begin tomorrow.
Good trades Richard. That was nearly $10 gain on NUGT. Scalping is the only way to profit in this type of volatile market conditions.
Alan thanks. Yes scalping is the way in much of this volatile gold market.
I’ve been studying more and more as plenty of scalping opportunities.
Your NUGT trade was superb! I’m working on getting those trades, learnt a lot and still lots more to learn.
Rambus on HUI, GLD, SLV.
Large inverted H&S bottom forming. A break to the upside should be powerful, although more consolidation may be needed first.
https://rambus1.com/2016/06/14/hui-update-277/
WEDNESDAY, JUNE 15 – US economic news
8:30 am Producer price index
8:30 am Empire state index
2:00 pm Federal funds announcement
2:30 pm Janet Yellen press conference
Advisors don’t see much upside to the market in the near term unless the Fed on Wednesday commits to keeping rates low for an extended period. Otherwise, the market will remain stuck in a persistent state of uncertainty until the Brexit vote on June 23.
Gold went up the last time Janet spoke June 3rd because she didn’t mention a date for interest rate hikes. Then gold headed up to 1,300 instead of down to 1,183.
Yellen may try to sound like a hawk in her press conference
June 14, 2016 9:44 a.m. ET
Fed may want market to still think there’s chance of two hikes this year
http://www.marketwatch.com/story/yellen-may-try-to-sound-like-a-hawk-in-her-press-conference-2016-06-13