
Targets for downwards movement were 1,271 and 1,244. Downwards / corrective movement continues as expected.
Summary: Minor wave 2 down has begun and should be expected to last a Fibonacci 8, 13 or 21 days in total. The most likely target will be the 0.618 Fibonacci ratio at 1,244. At this stage, this target may not be low enough. Patience is required while this correction unfolds. The trend is up, so this is a counter trend movement.
New updates to this analysis are in bold.
To see last weekly charts click here.
DAILY ELLIOTT WAVE COUNT
Click chart to enlarge.
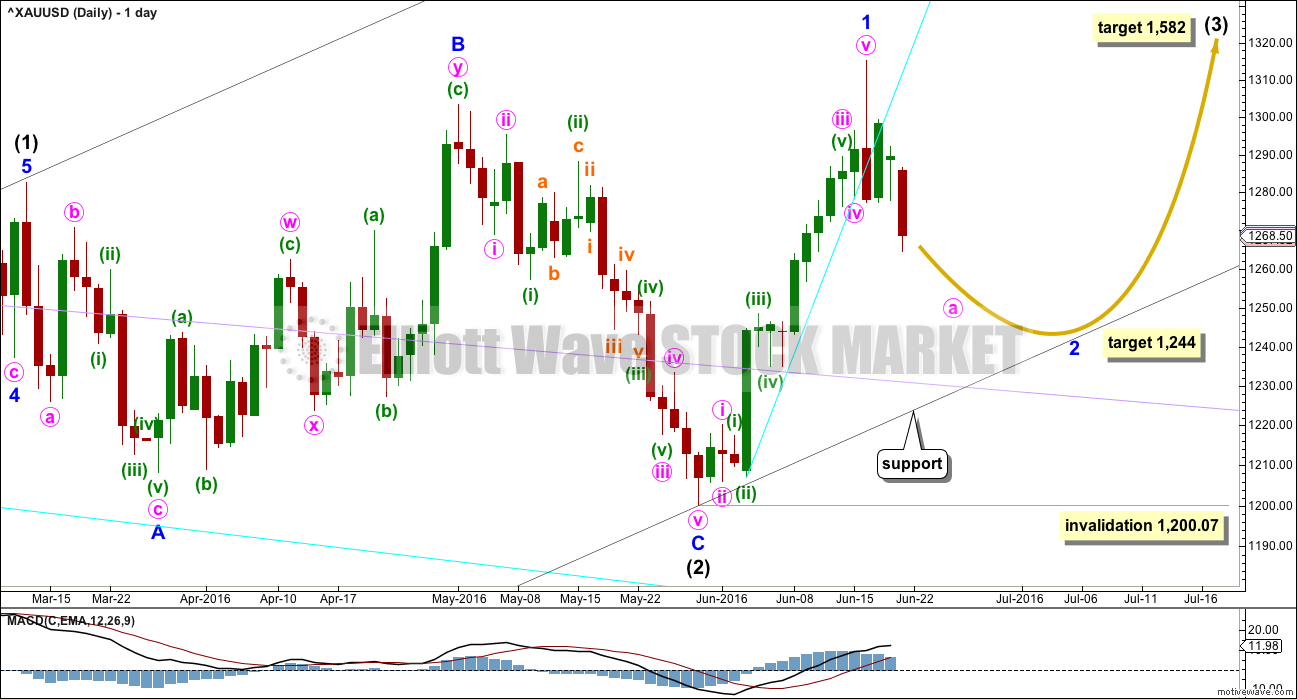
Intermediate wave (2) is a complete expanded flat correction. It is shallow 0.350 correction of intermediate wave (1) lasting 56 days, just one more than a Fibonacci 55. There is no Fibonacci ratio between minor waves A and C. Minor wave C is a complete impulse.
I have looked back at the last two big cycle degree up movements within the last bull market: the first move from the low at 255.05 in April 2001, and the next move from the low at 682.75 in October 2008. Within the first move, the beginning series of corrections were 0.76, 0.6 and 0.96 in depth. Within the second move, the beginning series of corrections were 0.82, 0.68, 0.57 and 0.45. My conclusion is this current correction expected to have begun 16th of June is more likely to be deep than shallow, even though intermediate wave (2) was shallow. Early corrections within a new trend are most often deep.
So far minor wave 2 has reached to just below the 0.382 Fibonacci ratio of minor wave 1 at 1,271 and the structure looks to be incomplete. The 0.618 Fibonacci ratio at 1,244 will now be the target. If this first target is wrong, it may now not be low enough. If price comes down to touch the lower edge of the base channel, then it may end there.
Add a base channel (black lines) to intermediate waves (1) and (2). Draw the first trend line from the low at 1,046.27 on 3rd December, 2015, to the low labelled intermediate wave (2), then place a parallel copy on the high of intermediate wave (1). If price comes down to touch the lower edge of this base channel, then long positions should be entered there. The lower edge of a base channel should provide support for lower degree second wave corrections. Base channels almost always work to show where lower degree corrections are contained, but almost always is not the same as always. Sometimes they are overshot or breached by small amounts, particularly for Gold early on in a new trend. If price breaks below the black channel, then the lilac trend line should offer final support (copy it from the weekly chart).
Minor wave 1 was over in 14 days, one more than a Fibonacci 13. The blowoff top, strong red daily candlestick, breach of the cyan trend line on the hourly chart, and divergence with price and MACD at the daily chart level all indicate that minor wave 1 is over.
To reduce clutter on charts the pink channel is removed and a cyan trend line is drawn where the lower edge was. Copy this over to hourly charts; this line is now providing resistance.
Minor wave 2 may be expected to last a Fibonacci 8, 13 or 21 days. This would give these waves good proportion which adds to the right look. So far it has only lasted three days and looks too brief and shallow at this stage to be over.
Minor wave 2 may not move beyond the start of minor wave 1 below 1,200.07.
At 1,582 intermediate wave (3) would reach 1.618 the length of intermediate wave (1).
HOURLY ELLIOTT WAVE COUNT
Click chart to enlarge.
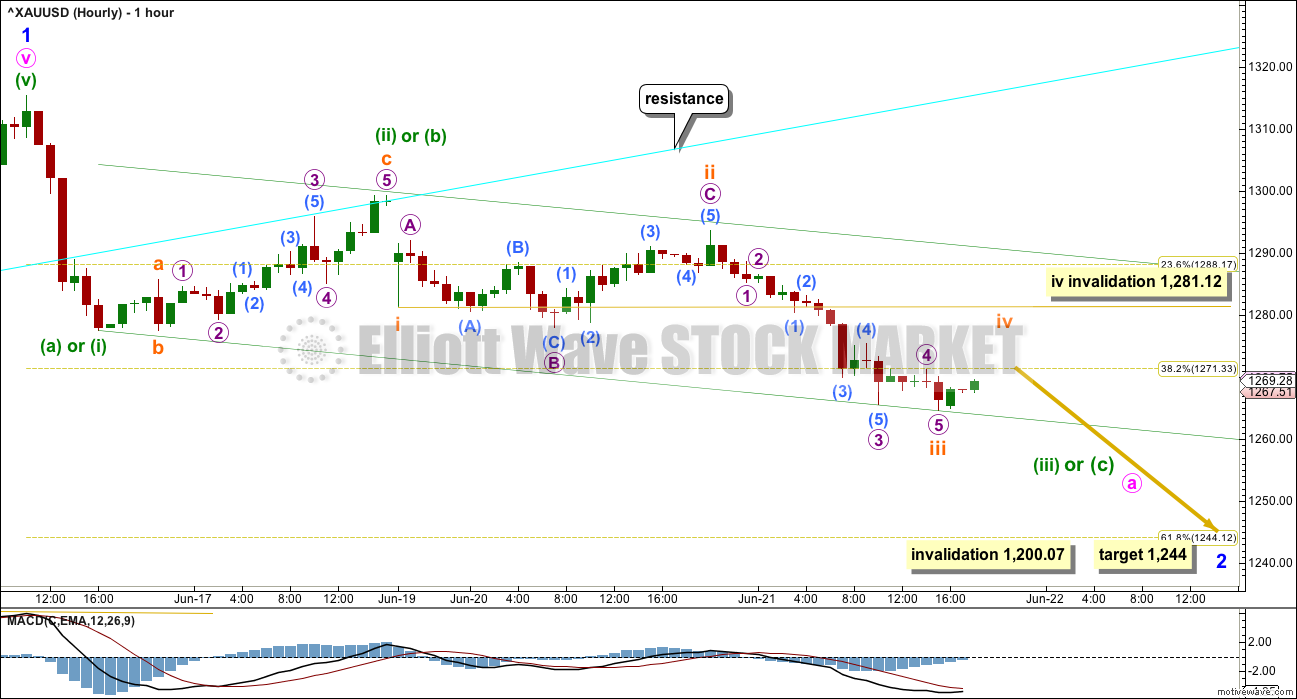
This degree of labelling expects a more time consuming correction for minor wave 2 which would have a better proportion on the daily chart, so this main wave count has a higher probability.
There are still several possible structures which may be unfolding for minor wave 2. It is most likely to be a single or multiple zigzag. It may also still be a flat or combination.
If minor wave 2 is a zigzag, then within it minute wave a would be subdividing as a five wave impulse. Minuette waves (i) and (ii) would be complete. Subminuette waves i, ii and now iii would be complete within minuette wave (iii). Subminuette wave iii is just 0.23 short of 1.618 the length of subminuette wave i. Subminuette wave ii was a deep 0.69 expanded flat correction. Subminuette wave iv may be a shallow flat, zigzag, combination or triangle, and may not move into subminuette wave i price territory above 1,281.12.
When sideways movement for subminuette wave iv is complete, then more downwards movement would be expected.
When minute wave a is a complete structure, then a deep correction upwards for minute wave b would be expected. This would be likely to show up on the daily chart and last a few days. It should be expected to be a very choppy overlapping sideways movement within a relatively large range.
If minor wave 2 is a flat correction, then within it minute wave a may be unfolding downwards as a zigzag. When minute wave a is complete, then minute wave b upwards should be very deep and may make a new high above the start of minute wave a at 1,315.38. A new high as part of minor wave 2 is still possible.
If minor wave 2 is unfolding as a double zigzag, then the first zigzag down would be close to completion. It would be followed by a quick shallow three up for an X wave, then another zigzag downwards to complete the double.
The conclusion must still be that it is impossible to tell what structure minor wave 2 is unfolding as, so it is impossible to provide an accurate road map for how price will move during the correction. Minor wave 2 is incomplete.
Minor wave 2 may not move beyond the start of minor wave 1 below 1,200.07.
ALTERNATE HOURLY ELLIOTT WAVE COUNT
Click chart to enlarge.
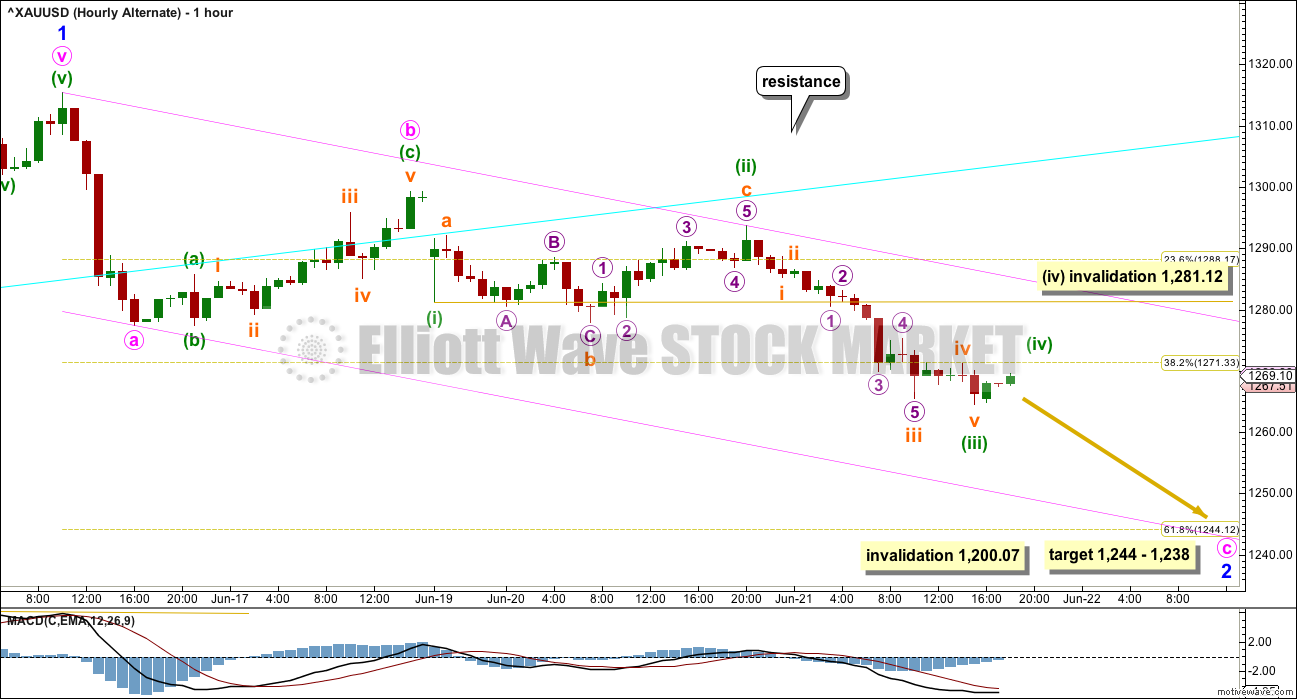
Alternatively, the degree of labelling within the last downwards wave may be moved up one degree. This may be minute wave a complete already.
This alternate wave count is judged to have a lower probability due to the brevity of minor wave 2. It sees minor wave 2 as almost complete, which would be remarkably quick given that minor wave 1 lasted 14 sessions. This is possible but fairly unlikely. More patience should be taken while this correction unfolds.
When minute wave c is a complete five wave structure, then it would be possible that minor wave 2 is over. At that stage, classic technical analysis will be used to judge the probability of this idea. If any one or more of these conditions are met, then downwards movement may be over: On Balance Volume is at support, Stochastics is oversold, price shows a volume spike (small but increased relative to days immediately prior) and price is at support.
TECHNICAL ANALYSIS
DAILY CHART
Click chart to enlarge. Chart courtesy of StockCharts.com.
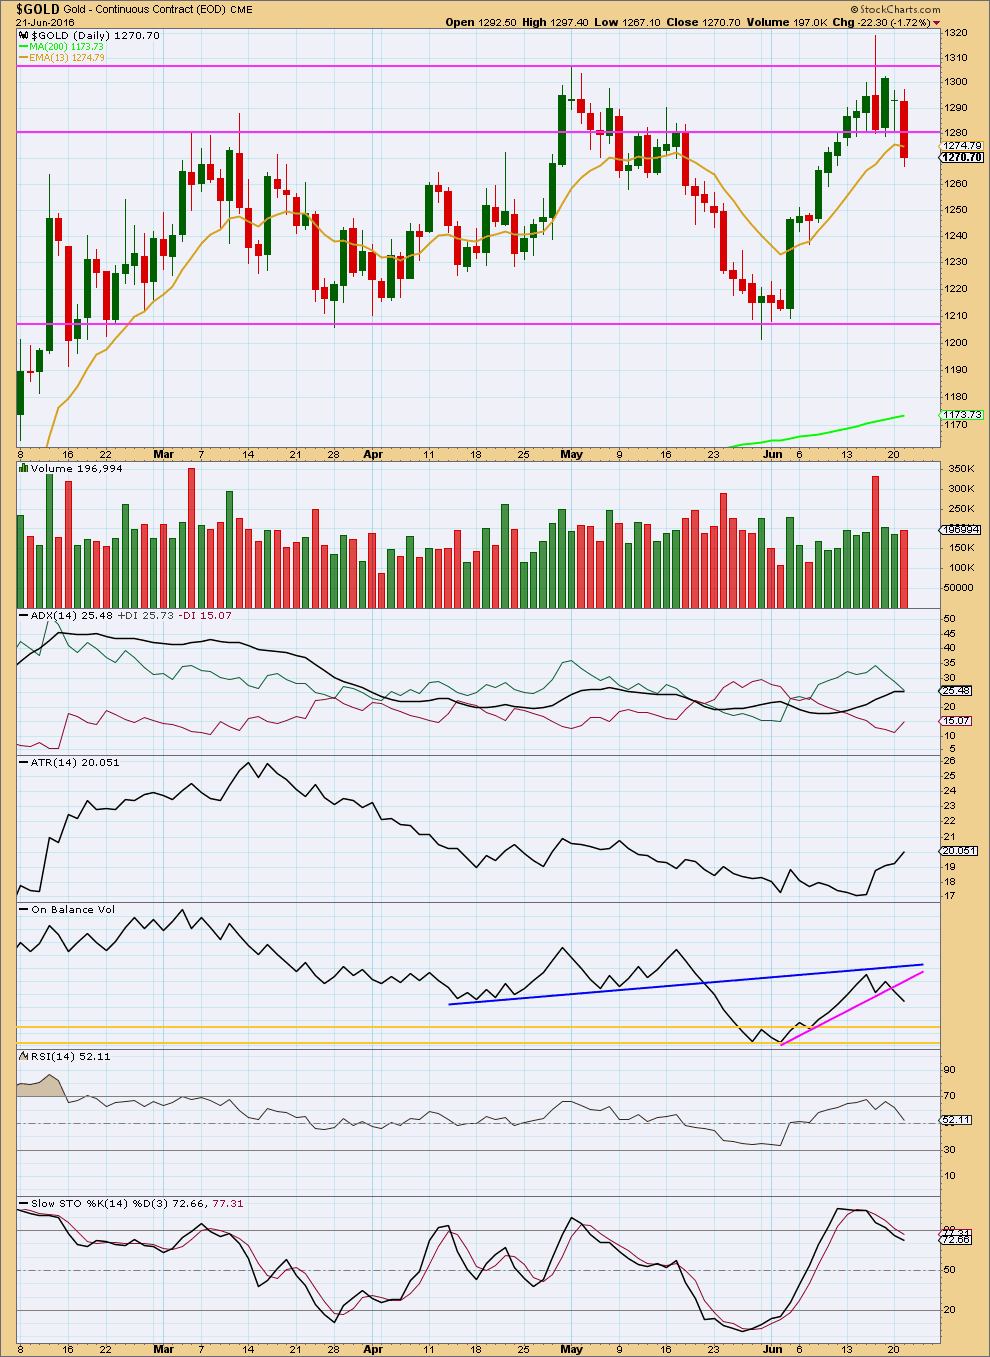
The red daily candlestick at the high completes a bearish engulfing candlestick pattern after an upwards trend. This is a strong bearish reversal pattern. The strength of this reversal signal is increased by strong volume for the downwards session and the long upper wick on the candlestick. More downwards movement from here is very likely. This strongly supports the Elliott wave count.
Price has broken through support at the horizontal trend line about 1,280. This line may now provide resistance, and this fits neatly with the invalidation point on the hourly Elliott wave counts.
There is a little support for downwards movement during Tuesday’s session with some increase in volume, but volume remains lower than the first day of this correction. The slight support for downwards movement indicates that more is likely to come. This supports the Elliott wave count.
ADX today is flat indicating the market is no longer trending.
ATR declined during the last upwards wave and is now increasing as price moves into a correction. This behaviour is opposite to what is normally expected. It indicates there was some weakness through the middle and at the end of the last wave up to the high. It also indicates that there is most likely more downwards / corrective movement to come. If ATR begins to decline as price moves sideways, then the correction would be closer to an end. For now it looks immature.
On Balance Volume today has given a weak bearish signal with a break below the pink trend line. When OBV comes down to find support at the first yellow line, then if the structure on the Elliott wave count is complete it may end there. If not there, then it may end when OBV comes down to find support at the lower yellow line.
RSI is returning to neutral. There is plenty of room for price to rise or fall. If RSI exhibits any divergence with price at a low, then it would be a very strong indicator of an end to this downwards correction.
Stochastics should be expected to continue lower until it reaches support. If when Stochastics reaches support and then the Elliott wave structure is complete, it may end there.
This analysis is published @ 08:12 p.m. EST.
This is the first idea I’ll have today. More to come.
I think we now have two fourth waves over. It looks like subminuette may have been relatively quick and shallow, followed by a short subminuette v to the low for the last 24 hours, then more sideways movement for minuette (iv).
This is what I have so far, but I’m going to have to publish more than one alternate I think to show how expected direction for different ideas could be.
It is at this point in the correction that the alternate possibilities start to diverge. With price now maybe moving into a B wave it is my strong advice to avoid this consolidating market at this time. Any members trying to trade it should take profits quickly and manage risk very strongly. I would recommend avoiding it, but if you absolutely must trade then risk no more than 2% of equity on any one trade.
Gold already topped for the day at $1,269.45 at 1:10 pm but as gold slowly averages down NUGT is even more bullish from 2 small corrections up in subminuette wave v heading down.
Gold drops $ NUGT goes up $3.
I think that subminuette 4 may have topped at $1,269.45 at 1:10 pm.
Yes. The drop following that was the first of 5 waves down for subminuette 5.
would that wave 5 complete A?
No it would just complete Minuette wave (iii) or (c) of minute a, then minuette wave (iv) up then minuette wave (v) down to complete minute a.
When minute wave a is a complete structure, then a correction upwards for minute wave b would be expected. Then minute wave c down to complete minor 2. Then stock up on miners for a mega bullish rally up about $340 in intermediate wave (3) for weeks to months.
I surmise that the low of 1261.24 is subminuette 3 of minuette 3 of Minute A. The current rangebound movement constitutes subminuette 4 which is probably into its third wave of what looked like a triangle.
As I said yesterday, I would only enter a small position at the end of Minute A, to play the deep Minute B correction. It could happen tomorrow, so I’ll most likely call this an early night.
If that answer was for me…thanks!
I’m trying to learn this elliott wave theory and there are a lot of people on this site who know way more than I do about using it for trading…again thank you.
Thomas, my pleasure. My response was inspired by your query.
But right now, I have my doubts about the triangle. Lara did mention that triangles are difficult to be certain about. They could morph into something else. This fourth wave could be a simple ABC after all.
Absolutely. The triangle turned out to not be a triangle, it turned out to be a regular flat.
I think minuette (iii) or (c) is over now.
Now I’ll need more alternates…. the number of possibilities starts to open up…
Actually… on further analysis there could be a triangle in there.
A running contracting triangle.
Good morning, afternoon or evening! It seems with all the uncertainty about the exact wave count and form the current wave will take, this would be a good time to sit out, but being impatient is one of my strengths.
I saw that spot hit another low of 1261 at about 0145am EST. How does that affect the wave count from Lara’s analysis from last night?
Patience during a consolidating market is important. It’s the trades you don’t take which often make a difference to profit and loss.
This downwards move is setting us up for a long position.
If you want to trade this down then take profits quickly when they appear.
There is no upper invalidation point so the risk to any short positions here is very hard to judge, but it is significant. Money management stops or a stop set above a prior swing high are two possibilities.
BREXIT – results 2 am Friday E.S.T. All votes are likely to have been counted.
Final result expected around breakfast time on Friday EST
http://www.marketwatch.com/story/when-will-we-know-the-result-of-the-brexit-vote-2016-06-21