
Sideways movement fits the second Elliott wave count better than the first, but both remain valid while price remains range bound.
Summary: At this stage, I would judge the two wave counts to now have an even probability (although volume and On Balance Volume do favour the second wave count over the first). Price will tell us which one is correct. In the short term, a new high above 1,248.46 would shift probability to the second wave count. At that stage, the target for upwards movement short term would be 1,264 with a long term target at 1,582. A new low below 1,220.16 would shift probability to the first wave count, with the target still at 1,183.
New updates to this analysis are in bold.
To see last weekly charts click here.
FIRST DAILY ELLIOTT WAVE COUNT
Click chart to enlarge.
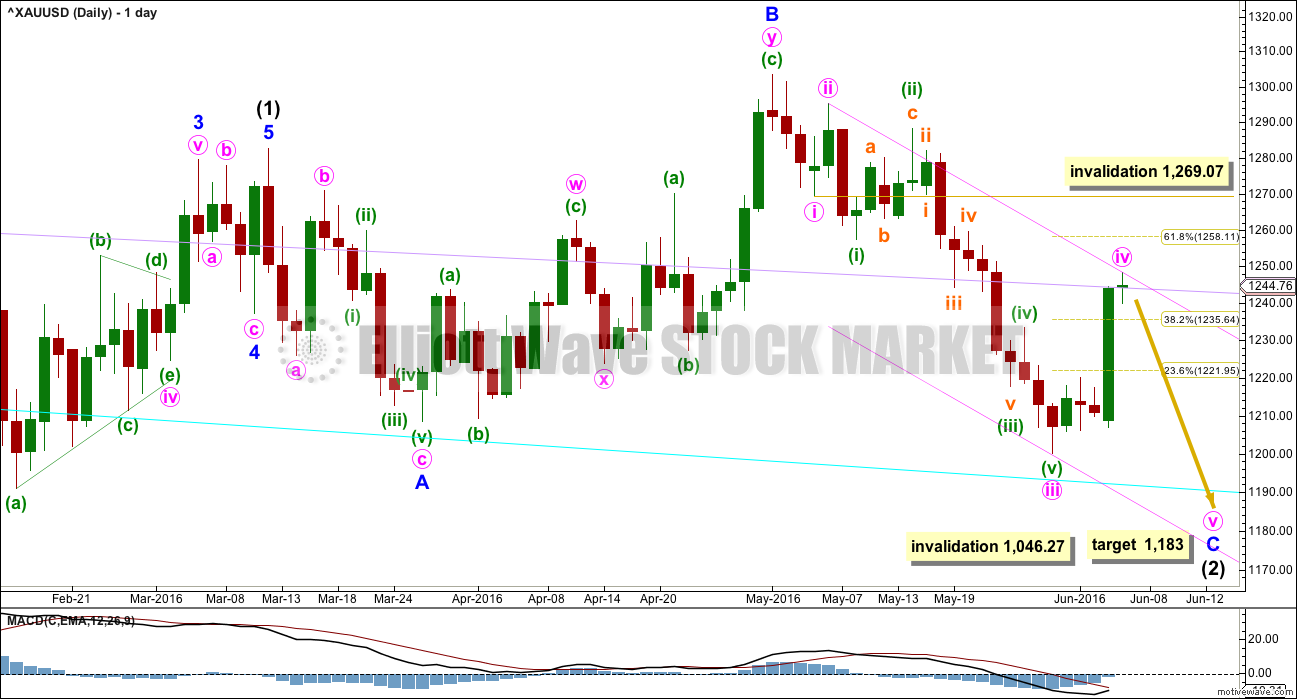
Intermediate wave (2) may not be over.
Normally, the first large second wave correction within a new trend is very deep, often deeper than the 0.618 Fibonacci ratio.
Intermediate wave (2) may be an expanded flat correction. Minor wave A is a three, minor wave B is a three and a 1.28 length of minor wave A. This is within the normal range of 1 to 1.38.
At 1,183 minor wave C would reach 1.618 the length of minor wave A. This would be the most likely target. If price keeps falling through this first target, then the second target would be at 1,108 where minor wave C would reach 2.618 the length of minor wave A.
Intermediate wave (2) may not move beyond the start of intermediate wave (1) below 1,046.27.
Minute wave iv may not move into minute wave i price territory above 1,269.07.
Redraw the channel about minor wave C using Elliott’s second technique: the first trend line from the ends of minute waves ii to iv, then a parallel copy on the end of minute wave iii. Minute wave v may end at support at the lower edge of this channel.
For this main wave count, minute wave iii is 5.05 short of 2.618 the length of minute wave i.
There are no adequate Fibonacci ratios between minuette waves (i), (iii), and (v) within minute wave iii.
Ratios within minuette wave (iii) are: there is no Fibonacci ratio between subminuette waves i and iii, and subminuette wave v is 2.64 short of 2.618 the length of subminuette wave i. Subminuette wave ii is an expanded flat and subminuette wave iv is a zigzag.
FIRST HOURLY ELLIOTT WAVE COUNT
Click chart to enlarge.
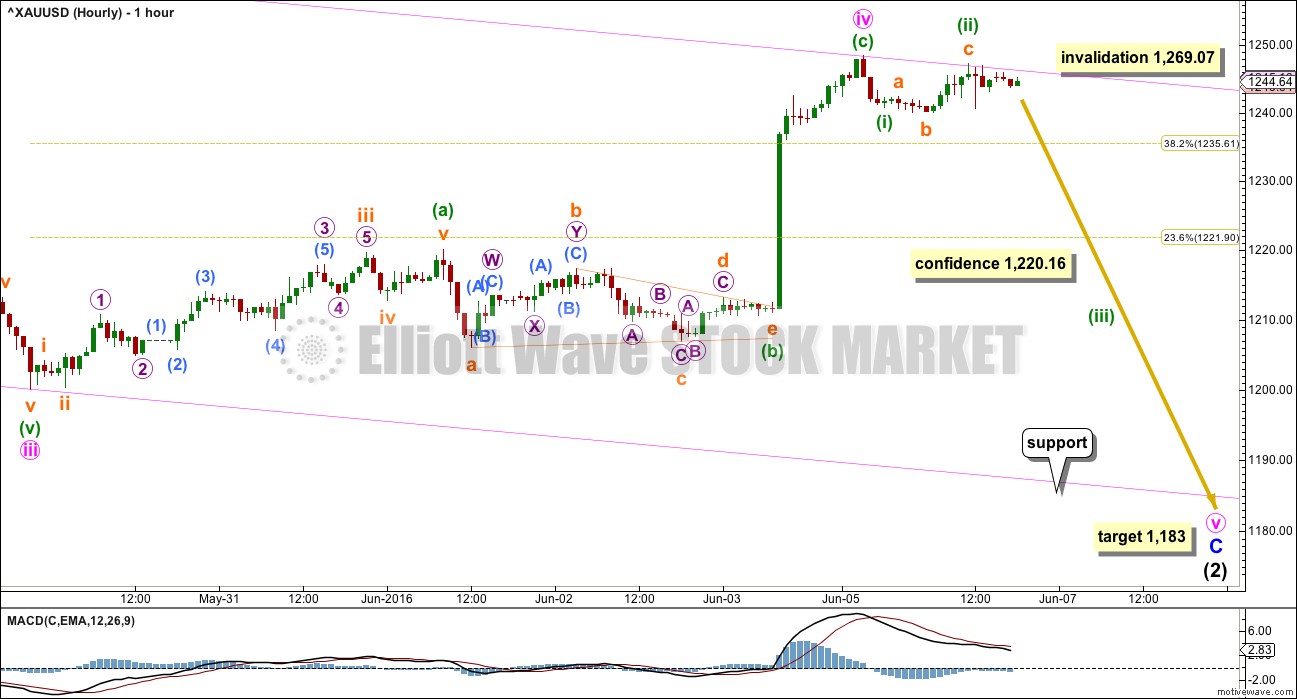
Minute wave ii was a quick deep 0.76 zigzag lasting 23 hours. If minute wave iv is over now as labelled, then it exhibits no alternation in structure with minute wave ii: both are zigzags. Minute wave iv no longer exhibits good alternation in depth because it is now relatively deep at 0.51 of minute wave iii.
The lack of alternation in structure reduces the probability of this wave count. The reduction in alternation in terms of depth reduces probability further today.
Sideways movement labelled minuette wave (b) fits perfectly as a triangle. There is no Fibonacci ratio between minuette waves (a) and (c).
A new low below 1,220.16 would invalidate the alternate below at the hourly chart level and provide some confidence in this main wave count. A new low below 1,200.07 would provide final price confirmation of this wave count.
In the short term, a new high above the start of minuette wave (i) at 1,248.46 would substantially reduce the probability of this wave count. At that stage, the structure of minuette wave (c) would be seen as continuing higher which becomes problematic. It is possible that minute wave iv could yet continue higher, and the invalidation point must remain at 1,269.07.
SECOND DAILY ELLIOTT WAVE COUNT
Click chart to enlarge.
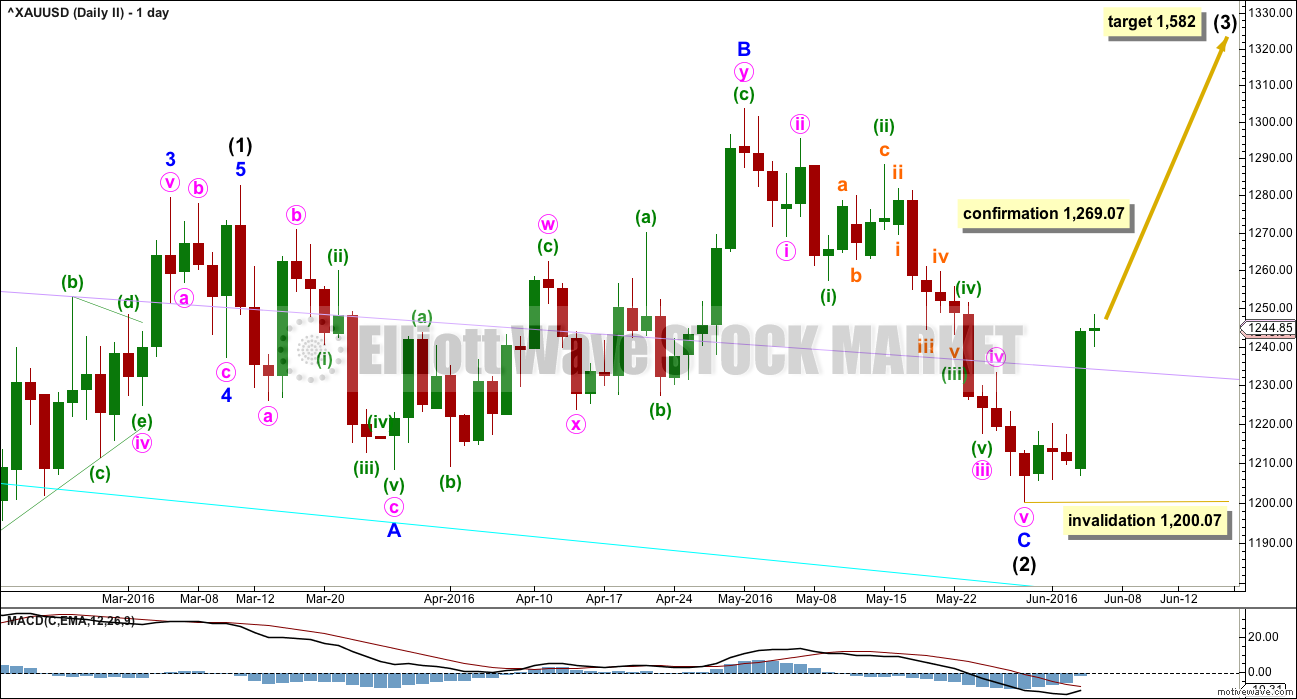
It is possible that intermediate wave (2) is over as a completed expanded flat. It would be a shallow 0.350 correction of intermediate wave (1) lasting 56 days, just one more than a Fibonacci 55. There would be no Fibonacci ratio between minor waves A and C.
For this wave count, ratios within minor wave C are: there is no Fibonacci ratio between minute waves i and iii, and minute wave v is just 1.13 short of equality in length with minute wave i.
Within minute wave iii, there are no adequate Fibonacci ratios between minuette waves (i), (iii) and (v).
Ratios within minuette wave (iii) are: there is no Fibonacci ratio between subminuette waves i and iii, and subminuette wave v is 0.70 short of 0.618 the length of subminuett wave i. Subminuette wave ii is an expanded flat and subminuette wave iv is a regular contracting triangle.
On balance, there is no advantage for either wave count in terms of Fibonacci ratios or alternation which would indicate one is more likely than the other.
What is problematic for this second wave count is the structure of minuette wave (v): the fit on the hourly chart is not as neat for this second wave count as it is for the first wave count. At this stage, it is my judgement that with both wave counts having advantages and disadvantages the probability is now about even.
At 1,582 intermediate wave (3) would reach 1.618 the length of intermediate wave (1). No second wave correction may move beyond the start of its first wave below 1,200.07 within intermediate wave (3).
SECOND HOURLY ELLIOTT WAVE COUNT
Click chart to enlarge.
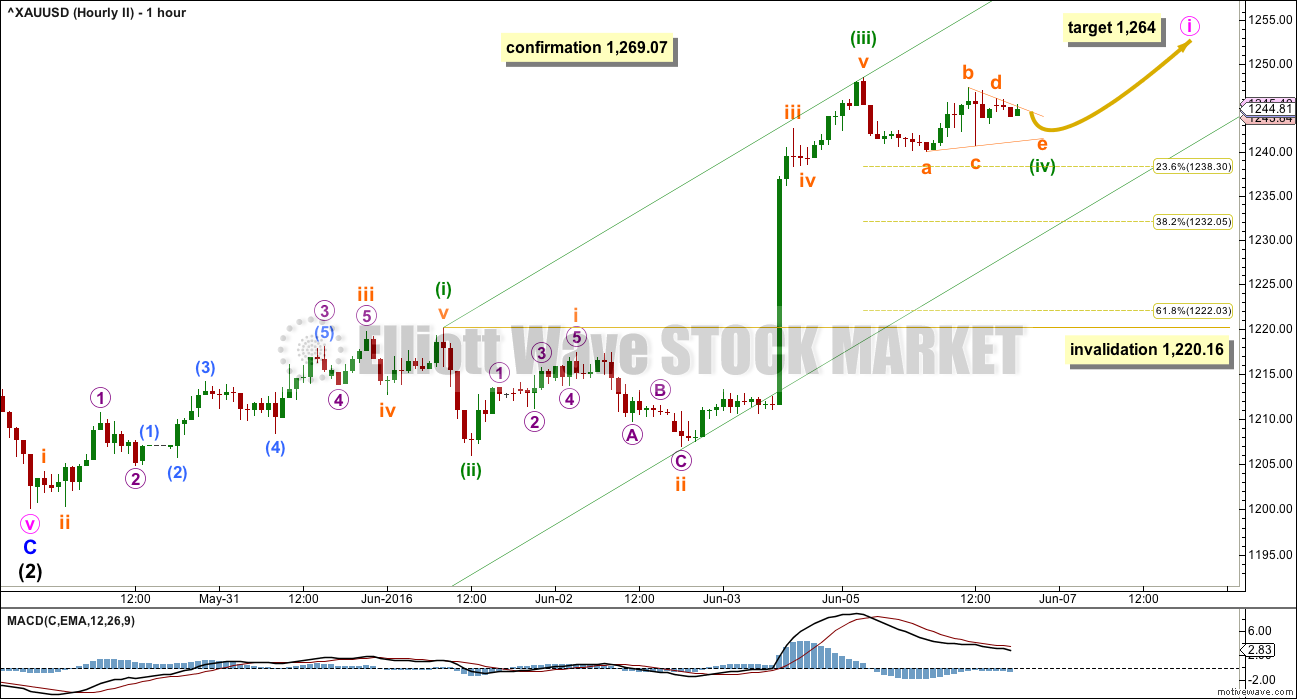
The subdivisions are slightly different at the hourly chart level. Although A-B-C of a zigzag and 1-2-3 of an impulse both subdivide 5-3-5, a second wave correction may not be a triangle for its sole structure within an impulse. This wave count cannot see a triangle for minuette wave (ii).
It is possible that this sideways movement was a series of small first and second waves. The key is in the structure of the upwards wave labelled subminuette wave i. This wave count must see it as a five wave structure.
A new high above 1,269.07 would invalidate the first wave count and confirm this second wave count.
Within minute wave i, only minuette waves (i), (ii) and (iii) would be most likely complete. Minuette wave (iv) may not move into minuette wave (i) price territory below 1,220.16.
Minuette wave (iv) may be unfolding as a regular contracting triangle, which would provide alternation with the zigzag of minuette wave (ii). The triangle may not complete as expected though. It may morph into a combination. The invalidation point must remain the same while minuette wave (iv) is completing.
If minuette wave (iv) ends about this level, then at 1,264 minuette wave (v) would reach equality in length with minuette wave (i). If this target is wrong, it may be too high; fifth waves out of fourth wave triangles for Gold are sometimes surprisingly short and brief. Be warned: if the triangle continues and completes, then it may be followed by a short sharp upwards thrust. Minute wave i may end below the confirmation point of 1,269.07 which would not give clarity to the situation. Only structure would then guide as to which wave count would be most likely, but they would both remain valid.
Draw a channel about this impulse unfolding upwards: draw the first trend line from the ends of minuette waves (i) to (iii), then place a parallel copy on the end of subminuette wave ii, so that almost all movement is contained. The upper trend line may provide resistance and the lower trend line may provide support.
Minuette wave (iv) may end within the price territory of the fourth wave of one lesser degree; subminuette wave iv has its range from 1,242.62 to 1,238.31. Minuette wave (iv) may be very shallow.
When minute wave i is complete, then minute wave ii should unfold and it may be deep.
TECHNICAL ANALYSIS
WEEKLY CHART
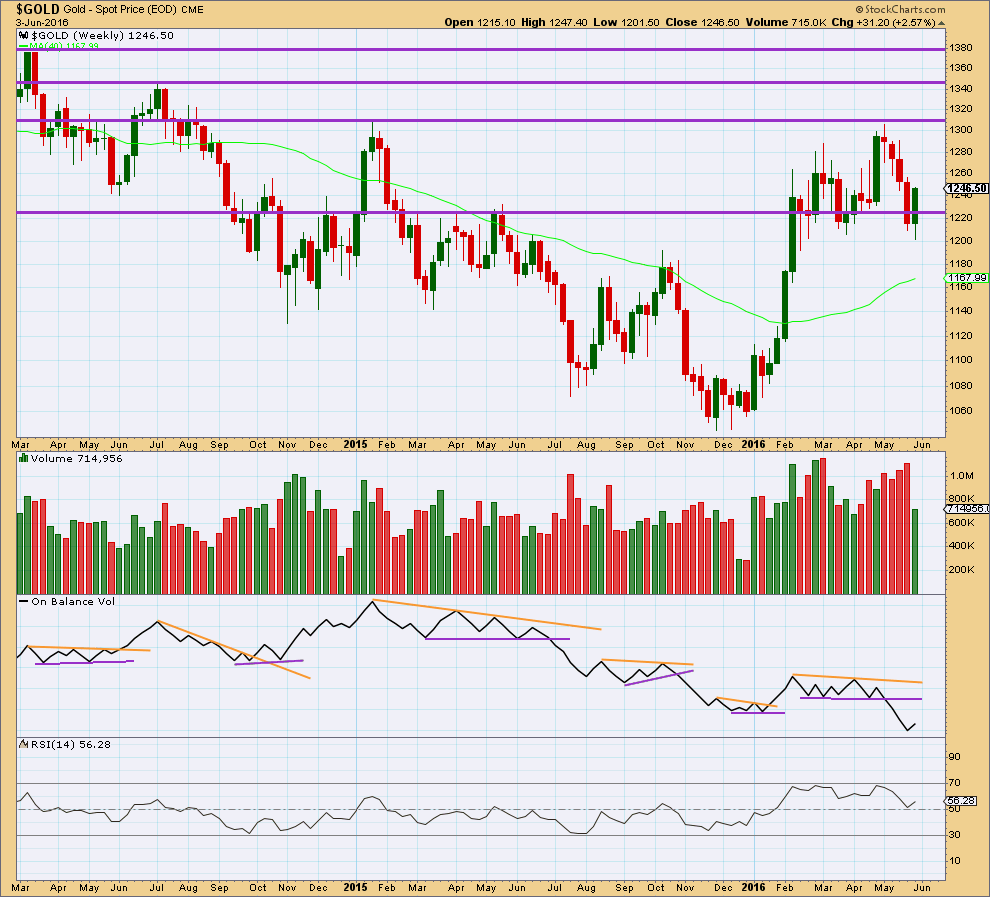
Click chart to enlarge. Chart courtesy of StockCharts.com.
At the end of last week, a strong upwards week has considerably lower volume than prior downwards weeks. This volume profile looks bearish at the weekly chart level.
On Balance Volume is turning up at the end of the week. There is not enough sideways movement from OBV yet to draw trend lines about its current range, so it will not be useful to help indicate the next direction from price at the weekly chart level.
DAILY CHART
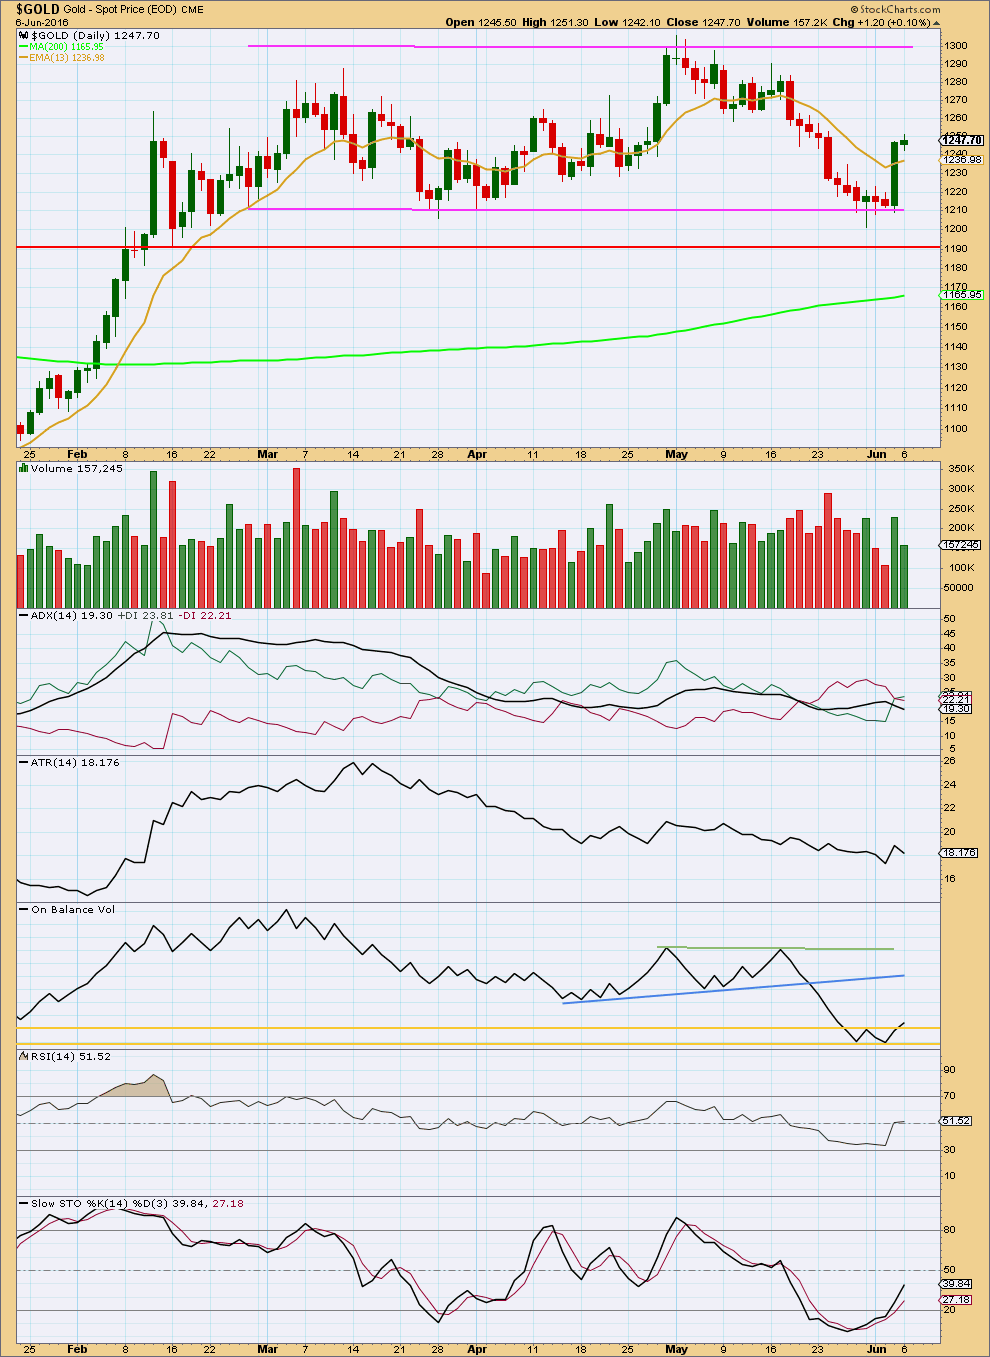
Click chart to enlarge. Chart courtesy of StockCharts.com.
The strongest days in the last eight days are two upwards days. The volume profile at the daily chart level is bullish, in contradiction to the weekly chart level.
The daily chart “looks inside” the weekly chart to show more detail. At this juncture, it would be more reasonable to consider signals from the daily chart as more accurate in terms of volume at least.
Volume for Monday’s small range day is lighter and the real body of this candlestick is very small. This looks like a small consolidation which may be part of an upwards trend.
ADX today indicates a potential trend change with the +DX line crossing above the -DX line. If the black ADX line turns up from here, then an upwards trend would be indicated. For now only a potential trend change is indicated, not a new upwards trend.
ATR is not yet convincingly turning upwards; it looks mostly sideways. It is not indicating a new trend.
On Balance Volume is often a leading indicator of price direction. OBV today has broken above a short held horizontal line and this may be followed by upwards movement from price. However, this trend line is short held and only once tested, so it does not offer strong technical significance. It is a bullish signal but only a weak one. This is today the main reason for judging the two wave counts to have about an even probability. OBV favours the second Elliott wave count.
RSI is neutral. There is plenty of room for price to rise or fall.
Stochastics is returning from oversold. If the market is not yet trending, then more upwards movement may be expected to continue until price reaches resistance and Stochastics reaches overbought at the same time.
This analysis is published @ 07:25 p.m. EST.
Updated second hourly chart. This has the better fit in terms of EW structure so far.
But both counts remain valid.
The invalidation point can be moved up short term for this count now; prior to a new high no new low below 1,234.82 for this wave count now, within minuette (v) no second wave correction may move beyond the start of its first wave.
As soon as price makes a new high above the end of minuette (iii) at 1,248.46 this invalidation point no longer applies. Then we’d be looking for the end of minuette (v) to complete an impulse for minute i, and be followed by a second wave correction for minute ii.
I hope that all makes sense!
The channel looks like it’s working well on the second hourly chart. That’s exactly where downwards movement found support today.
This price action looks more like the second wave count than the first. But no confirmation of either yet.
Upwards movement is finding resistance at the upper trend line on the first hourly chart.
Price is being squeezed…. it’ll break out. It’s looking a bit more likely to be up than down at this stage based on EW structure.
The longer time frames MACD and SMA/EMA for both gold and GDX got a lot weaker today since yesterday. The main count is still valid as gold heading down today instead of a any new high and second day of a lower gold high.
Perhaps Wednesday luckily gold hits Alan’s target subminuette 3 Fib 4.236 of 1214.04 for the main count.
NUGT day high at 101.30 at 10:58 am then dropped to 98.80 in 9 minutes now down to 98.09 at 11:20 am at 1,140.41 many technical analysis sell signals for gold and NUGT began at 10:45 am.
When might the subminuette 3 target of $1,214.04 be reached if gold isn’t going higher first?
Price movement down has proved the triangle idea to be wrong, as Papudi pointed out.
The drop from the high at 1248.85 has shown three distinctive waves as of now, down to 1234.89. So, that could be minuette 4 of Minute 1 for the alternate (unless it drops a bit more).
Similarly, for the main count, the first two waves down, namely 1240.93 and 1247.59, constitute subminuette 1 & 2 as in Lara’s chart. The bigger drop to 1234.89 from 1247.59 will be micro 1 of subminuette 3. I reckon subminuette 3 will be Fib 4.236, targeting 1214.04.
I will take an attempt on EW count???
Gold at 1236 makes the triangle invalided in daily alt hourly count. Wave e longer than wave a and wave c of alt hourly count.
This does not mean alt daily is invalidated.
Rambus on the HUI. Critical point. Breakout or reversal.
https://rambus1.com/2016/06/06/hui-update-273/
Interesting analysis. I’m not convinced that the HUI is going to gap up on opening today but a move down to 183 would certainly not be a surprise. That level of movement would close the gap in the HUI and likely both gaps on the GDX which makes a lot of sense to me. Then a strong move to the upside likely.
I know it’s not EW approved, however if it’s likely oil may drop for weeks.
I think that may help gold drop.
“Downwards movement looks most likely from here for several weeks.” June 7th update.
Its interesting to see GDX bounce between channels of resistance and support. Even though there is a large gap from Friday, it looks like GDX is near an upside breakout. A break above the purple channel, followed by a back test, would likely be an excellent entry.
Another perspective would be that GDX broke down from blue channel back in May and is back testing that channel now. What are your reasons for being bullish might I ask?
I’m on the sidelines, but a breakout would make me bullish. Actually I don’t like the large gap and would prefer that it filled and even went down to fill the lower gap near 20.5. I think seasonality also supports a longer correction. That would be my preference, but we have to go with what the market gives us.
I tend to think that you will get your wish. If there is one thing that I have noticed over the years it is that charts hate gaps! I suspect 20 or thereabouts on the GDX will be a good entry/re-entry point. The next move up after that could be pretty impressive.
Agreed. ? That would be a great entry!
Has The Jobs Number Put A Permanent Floor Under Gold?
Jun. 6, 2016 10:20 AM ET
http://seekingalpha.com/article/3980117-jobs-number-put-permanent-floor-gold#alt2
This writer said before open today if gold breaks above 1,250 on stockcharts he would buy GDXJ and it hit 1,251.30 high today.