
The main Elliott wave count expected downwards movement, which is what has happened over the last week for Oil.
Summary: In the short term, Oil should be expected to continue overall lower. Downwards movement is overall likely to be relatively deep and may continue for a few weeks. It may be choppy and overlapping.
New updates to this analysis are in bold
MONTHLY ELLIOTT WAVE COUNT
Click chart to enlarge.
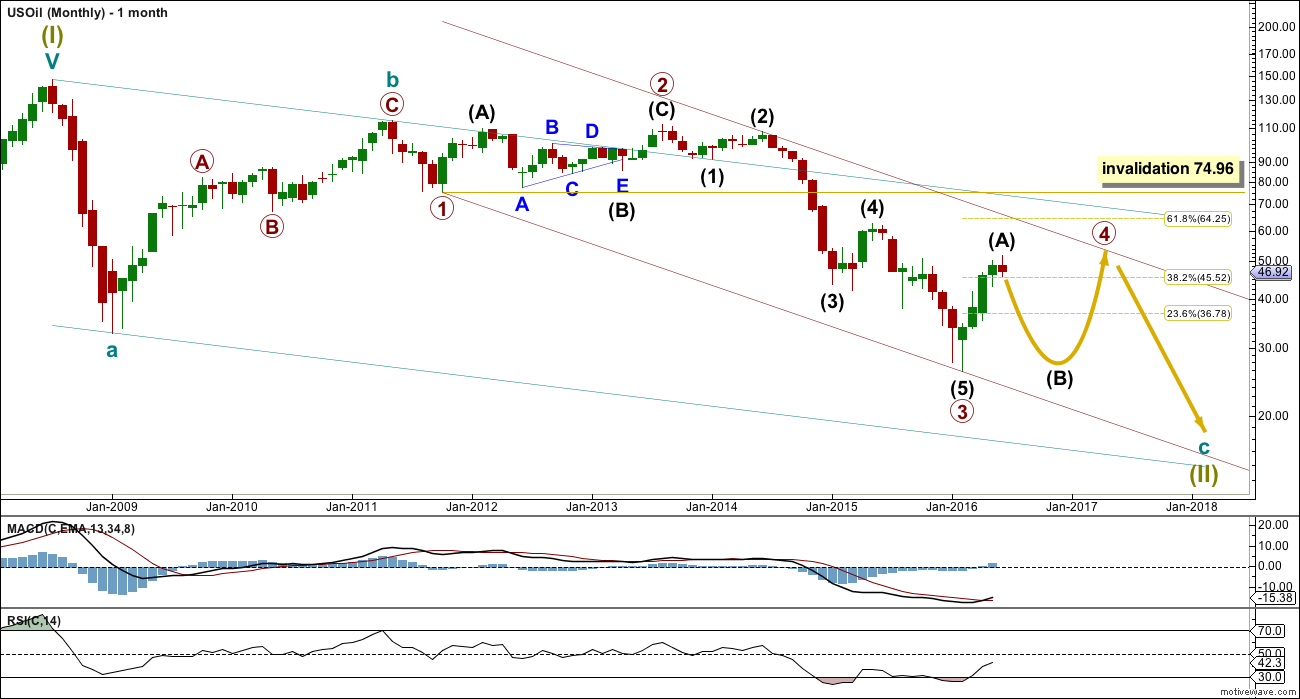
Within the bear market, cycle wave b is seen as ending in May 2011. Thereafter, a five wave structure downwards for cycle wave c begins.
Primary wave 1 is a short impulse lasting five months. Primary wave 2 is a very deep 0.94 zigzag lasting 22 months. Primary wave 3 is a complete impulse with no Fibonacci ratio to primary wave 1. It lasted 30 months.
Primary wave 4 is likely to exhibit alternation with primary wave 2. Primary wave 4 is most likely to be a flat, combination or triangle. Within all of these types of structures, the first movement subdivides as a three.
Primary wave 4 is likely to end within the price territory of the fourth wave of one lesser degree; intermediate wave (4) has its range from 42.03 to 62.58.
Primary wave 4 may end if price comes up to touch the upper edge of the maroon channel. The upper edge of this channel has been pushed up to sit on the end of intermediate wave (2) within primary wave 3.
Primary wave 4 is most likely to be shallow to exhibit alternation in depth with primary wave 2. So far it has passed the 0.382 Fibonacci ratio at 45.52. It may now move mostly sideways in a large range.
Primary wave 4 may not move into primary wave 1 price territory above 74.96.
DAILY ELLIOTT WAVE COUNT
Click chart to enlarge.
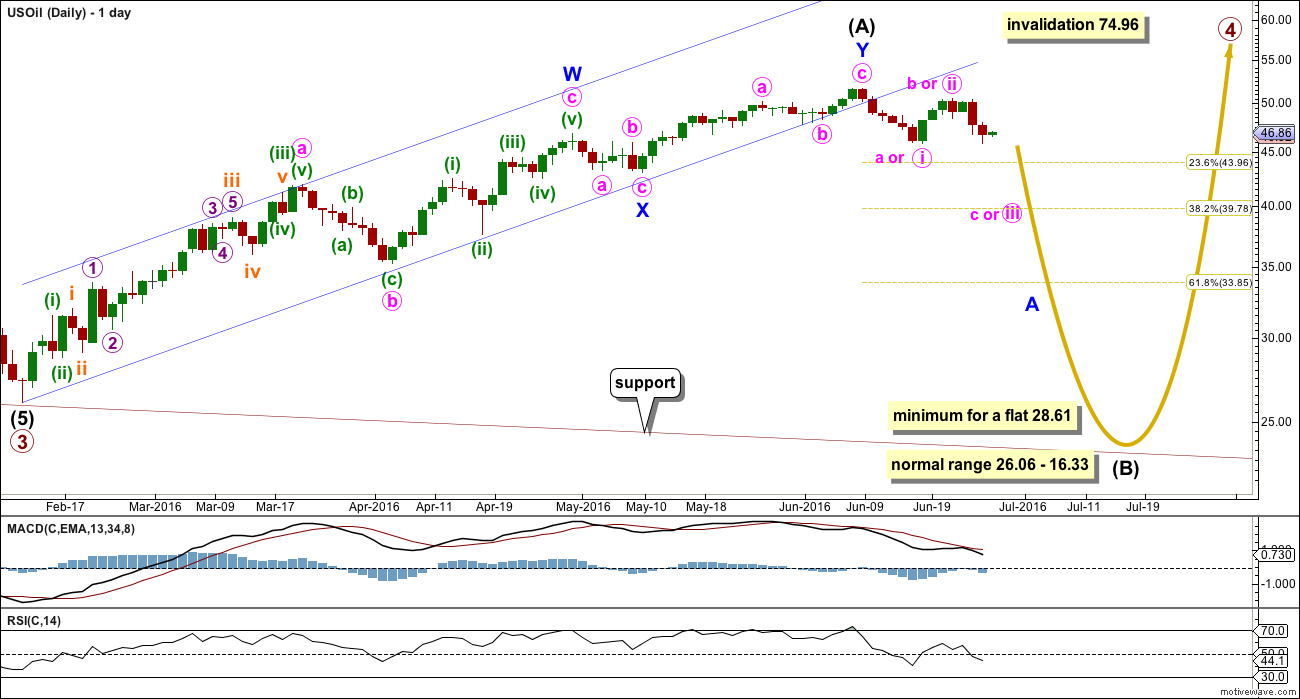
Intermediate wave (A) may be complete as a double zigzag. The best fit channel about intermediate wave (A) has now been breached by downwards movement. This may indicate a trend change.
If intermediate wave (A) is a three, then intermediate wave (B) is most likely to be a very deep correction. It may make a new low below the start of intermediate wave (A) at 26.06.
If primary wave 4 is to be a flat correction, then intermediate wave (B) must be a minimum 0.9 length of intermediate wave (A) at 28.61. The normal range for intermediate wave (B) would be 1 to 1.38 the length of intermediate wave (A) at 26.06 to 16.33.
If primary wave 4 is to be an expanded flat correction, then intermediate wave (B) should be 1.05 the length of intermediate wave (A) or longer, at 24.78.
If primary wave 4 is to be a triangle, then intermediate wave (B) has no minimum nor maximum. It must only subdivide as a three wave structure. It may make a new low below the start of intermediate wave (A) at 26.06 as in a running triangle.
Primary wave 4 may not move into primary wave 1 price territory above 74.96.
Intermediate wave (B) may be any of more than 23 possible corrective structures. It would most likely be a single or multiple zigzag in order to be a deep correction. It may also be an expanded flat to be deep. It may find support at the lower edge of the maroon channel.
Minor wave A would most likely subdivide as a five but may also be a three. If it is a three, then minute wave b may still make a new high above the start of minute wave a as in an expanded flat correction. There is still no upper invalidation point for this wave count this week for this reason.
ALTERNATE DAILY ELLIOTT WAVE COUNT
Click chart to enlarge.
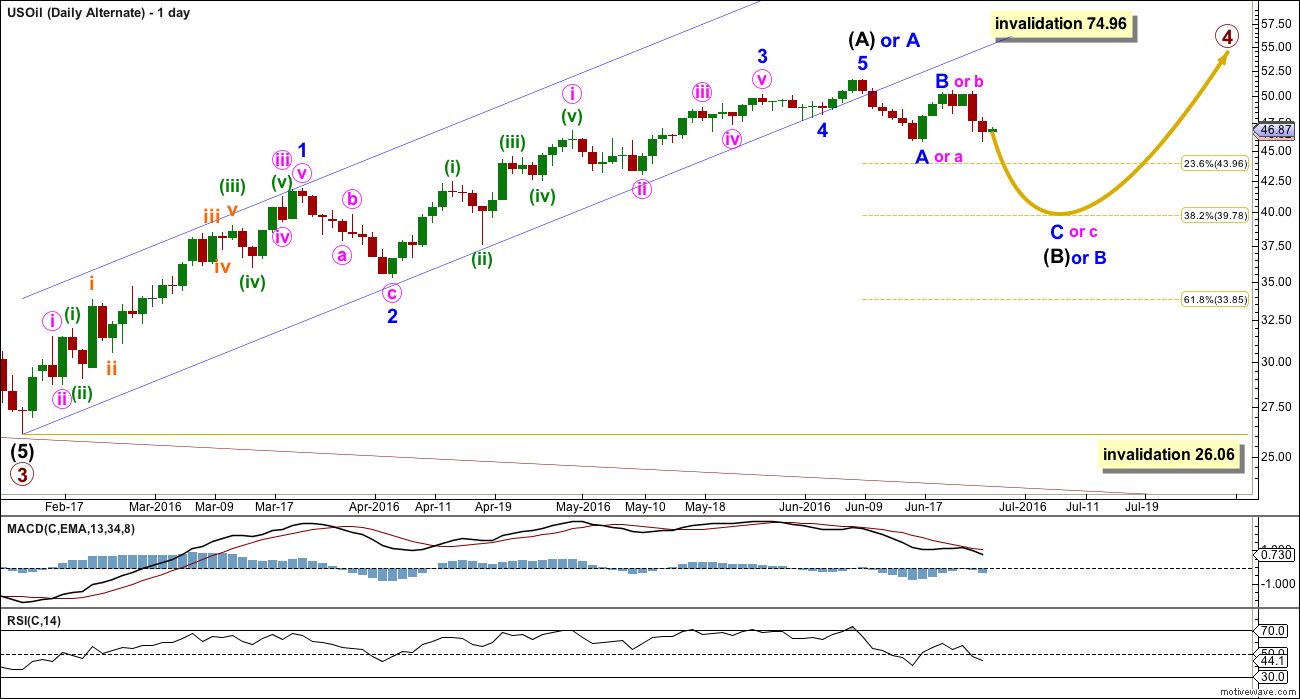
Primary wave 4 may be unfolding as a zigzag, or a zigzag upwards may be almost complete for intermediate wave (A) (as per alternate labelling on this chart).
It is possible that only minor wave A is a five wave structure complete upwards and minor wave B down is unfolding. If minor wave B is a flat correction or running triangle, then within it minute wave b may make a new high. There is no upper invalidation point for this wave count this week for this reason.
TECHNICAL ANALYSIS
MONTHLY CHART
Click chart to enlarge. Chart courtesy of StockCharts.com.
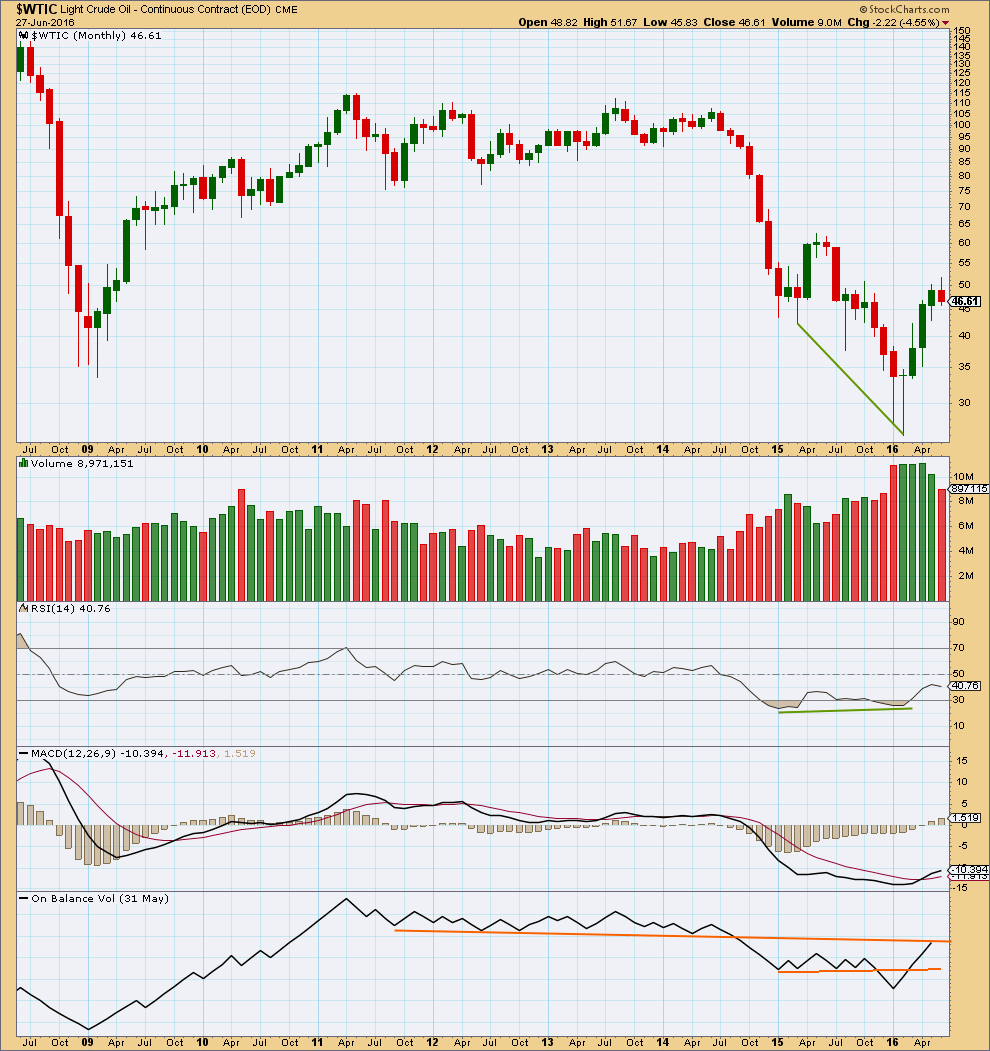
The month of May shows a decline in range and volume. This supports the idea of a mid term high in place. A pullback from here seems reasonable.
On Balance Volume may assist to hold price about here. It has come up to find resistance at the upper line.
DAILY CHART
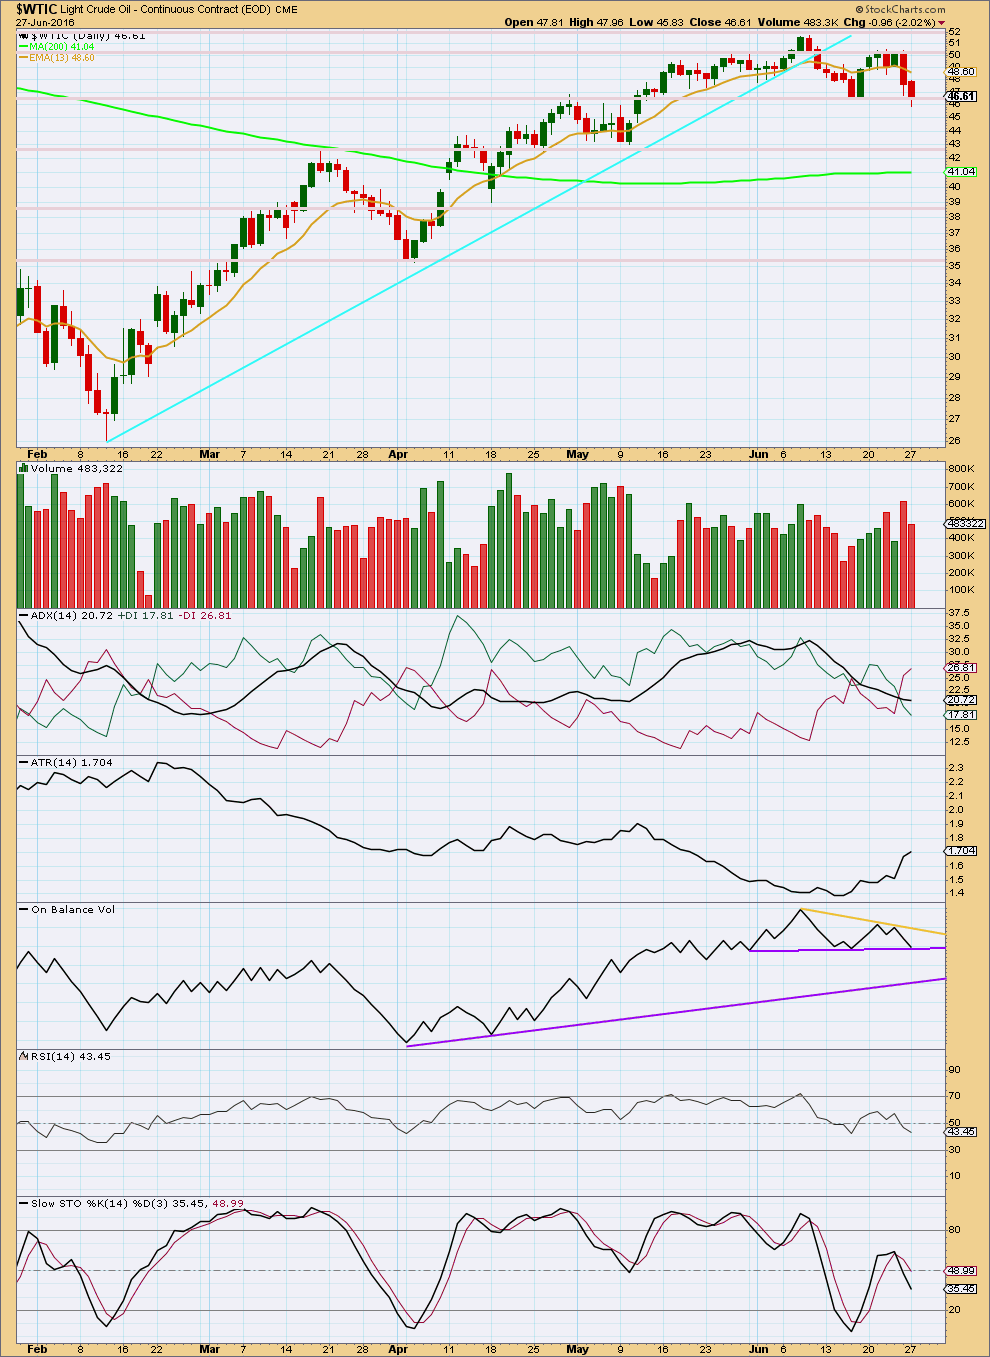
Click chart to enlarge. Chart courtesy of StockCharts.com.
From the last high, there is more support for downwards movement from volume than for upwards. The fall in price for the last three downwards days has stronger volume than the last four upwards days. Overall, more downwards movement should be expected.
ADX is still flat to declining indicating the market is not trending. If the ADX line turns upwards, then a downwards trend would be indicated.
ATR is increasing indicating this market is trending. If ADX begins to agree, then some confidence may be had that the market is trending downwards.
On Balance Volume trend lines are redrawn this week. OBV has come down to find support at the first purple line. This may initiate a short term bounce. A bounce may be short lived and shallow as OBV may find resistance at the yellow line. If OBV breaks through the first purple line, that would be a reasonable bearish indicator. The next line is some distance away; OBV may find support at the next purple line.
RSI is close to neutral. There is room for price to rise or fall. There is very slight divergence between the low today and the last swing low of 16th of June. Price today has made a new low but RSI has not made a new low. This indicates some weakness to downwards movement from price, indicating a small bounce for a day or so may move price higher to resolve the divergence.
Divergence between price and Stochastics is stronger. A small bounce for a day or so may resolve it.
This analysis is published @ 01:28 a.m. EST on 28th June, 2016.
Lara, downward movement stopped, and looks like some kind of triangle is developing. Daily chart doesn’t look like any of the presented cases in your analysis.
Aleksandar,
Here is wave count which I believe to be compatible with Lara’s daily wave count from last Monday.
thanks for this, so you think upwards move is still not finished yet?