
EURUSD has a good trade set up today.
Click chart to enlarge.
Click chart to enlarge.
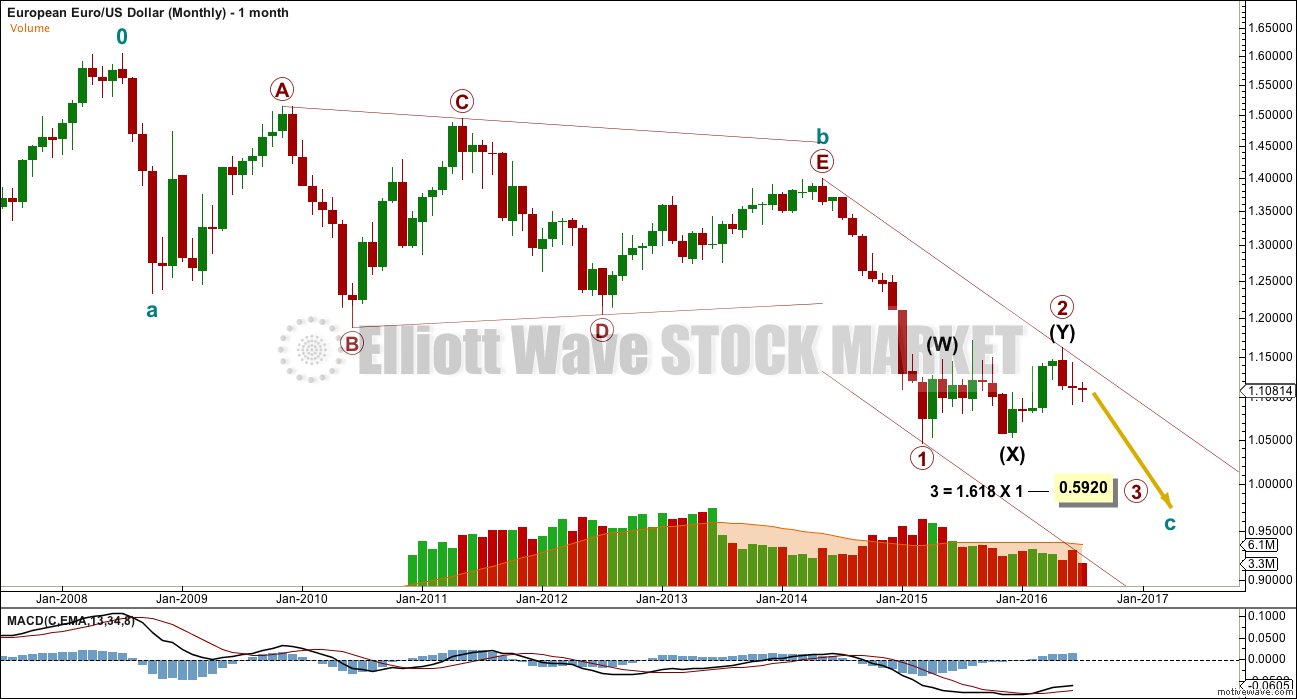
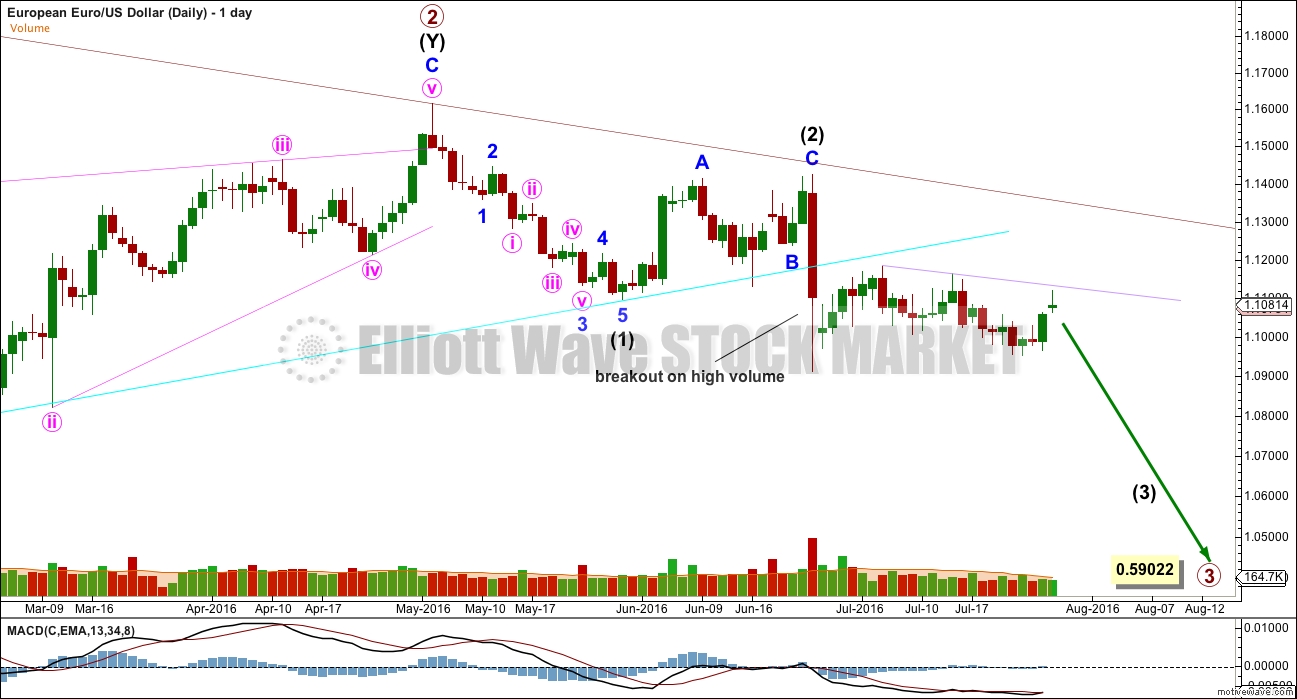
Price has come up to find resistance at the short term lilac trend line. It looks fairly likely that this line will hold. If the Elliott wave count is correct, then EURUSD should move strongly lower from here.
Stops may be set just above the last swing high at 1.11645. The risk / reward ratio here is very good if the target for primary wave 3 at 0.59022 is used.
As always, nothing in technical analysis is certain. If taking a short position here on EURUSD, it is essential to use a stop loss to cut losses short if this analysis proves to be wrong. Invest no more than 3-5% of equity on any one trade and ALWAYS use a stop loss.
Click chart to enlarge.
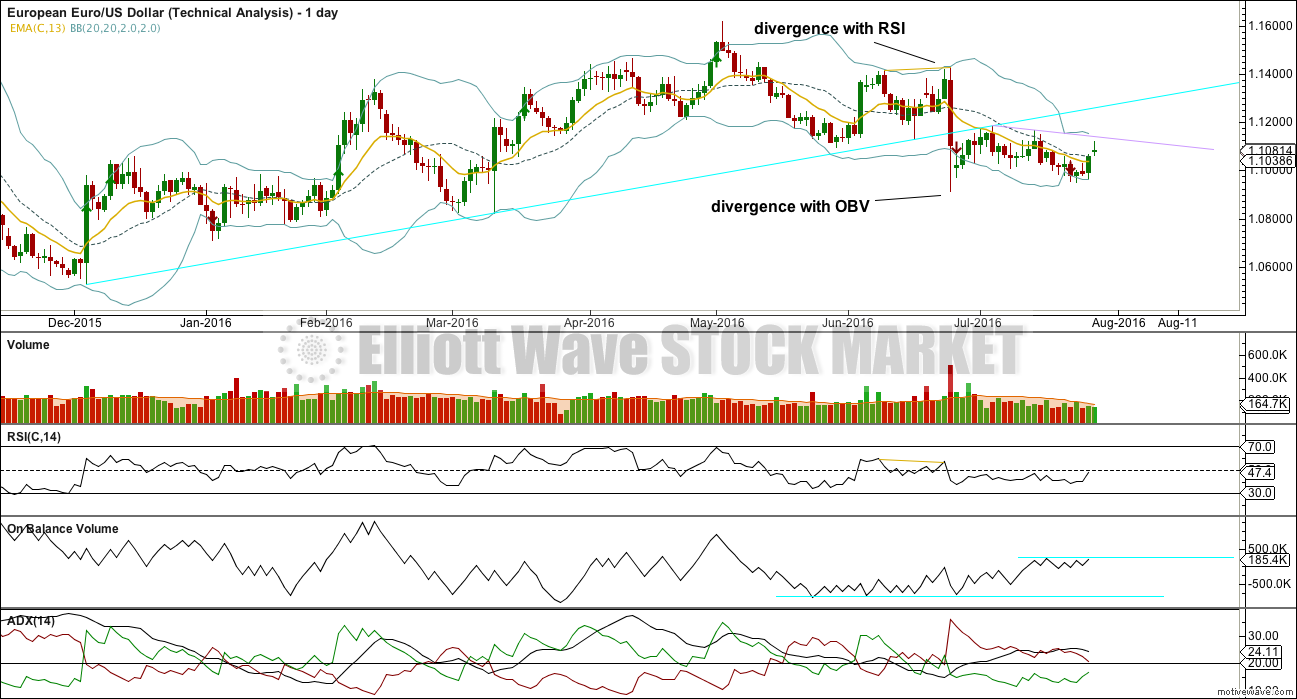
Two days with the second day on lighter volume gives a very short term bearish volume profile. However, some caution is advised. Downwards days have lighter volume. This market may be falling of its own weight. Selling pressure would be required to push price strongly lower.
ADX indicates a consolidation currently.
Bollinger Bands are constricting; this consolidation should end soon. Volume indicates an upwards breakout is more likely.
With price almost touching the upper Bollinger Band and the lilac trend line, a short position here may become quickly profitable. My strategy here will be to move a stop to breakeven as soon as the trade is profitable, and then wait to see if it “sticks”.
This analysis is published @ 11:14 p.m. EST.
Well that didn’t work out this time.
Will wait for the next possible set up. Maybe a test of the cyan line, extended out.
Looks like MMs decided to run stops set at the previous swing high. Move above upper BB should provide a better set-up hopefully…