
Yesterday’s analysis expected downwards movement.
Summary: The trend is still up. A multi day correction against the trend is unfolding and still looks incomplete. A target for it to end is either 1,291 or just below 1,249.94. Volume supports a short term bearish view.
New updates to this analysis are in bold.
Last weekly chart can be found here.
Grand SuperCycle analysis is here.
DAILY ELLIOTT WAVE COUNT I
Click chart to enlarge.
There are two wave counts today presented in order of probability.
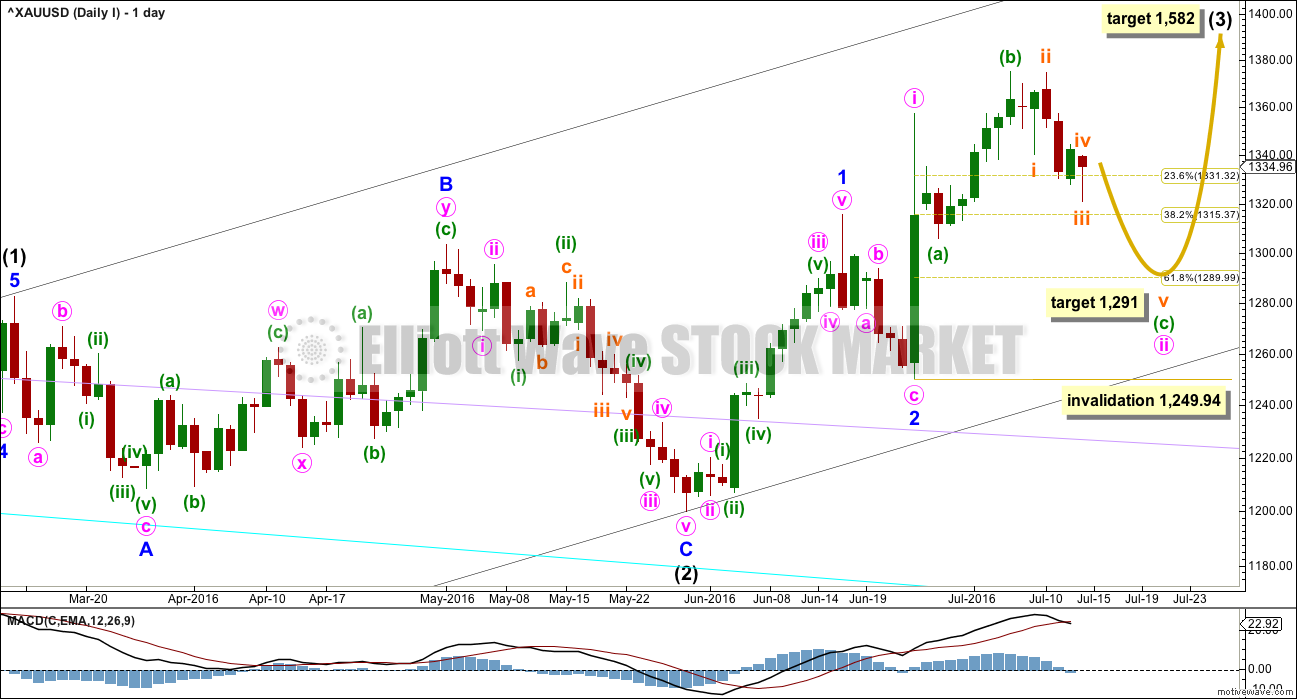
Intermediate wave (2) is a complete expanded flat correction. Price from the low labelled intermediate wave (2) has now moved too far upwards to be reasonably considered a continuation of intermediate wave (2). Intermediate wave (3) is very likely to have begun and would reach 1.618 the length of intermediate wave (1) at 1,582.
Intermediate wave (3) may only subdivide as an impulse.
So far minor waves 1 and 2 may be complete within intermediate wave (3). The middle of intermediate wave (3) may have begun and may also only subdivide as an impulse.
Within minor wave 3, minute wave i is complete. Minute wave ii may be continuing as an expanded flat correction. Expanded flats are very common structures.
Within minute wave ii, minuette wave (a) subdivides as a quick three wave structure. Minuette wave (b) subdivides perfectly as a zigzag and is a 1.34 length of minuette wave (a), within the normal range of 1 to 1.38.
It would be highly likely for minuette wave (c) to make at least a slight new low below the end of minuette wave (a) at 1,305.59 to avoid a truncation and a very rare running flat.
At 1,291 minuette wave (c) would reach 1.618 the length of minuette wave (a). This is close to the 0.618 Fibonacci ratio of minute wave i at 1,290, so this is a reasonable target.
Minuette wave (c) may only subdivide as a five wave structure, either an impulse or ending diagonal. So far it looks like the more common impulse.
Minute wave ii may not move beyond the start of minute wave i below 1,249.94.
HOURLY ELLIOTT WAVE COUNT I
Click chart to enlarge.
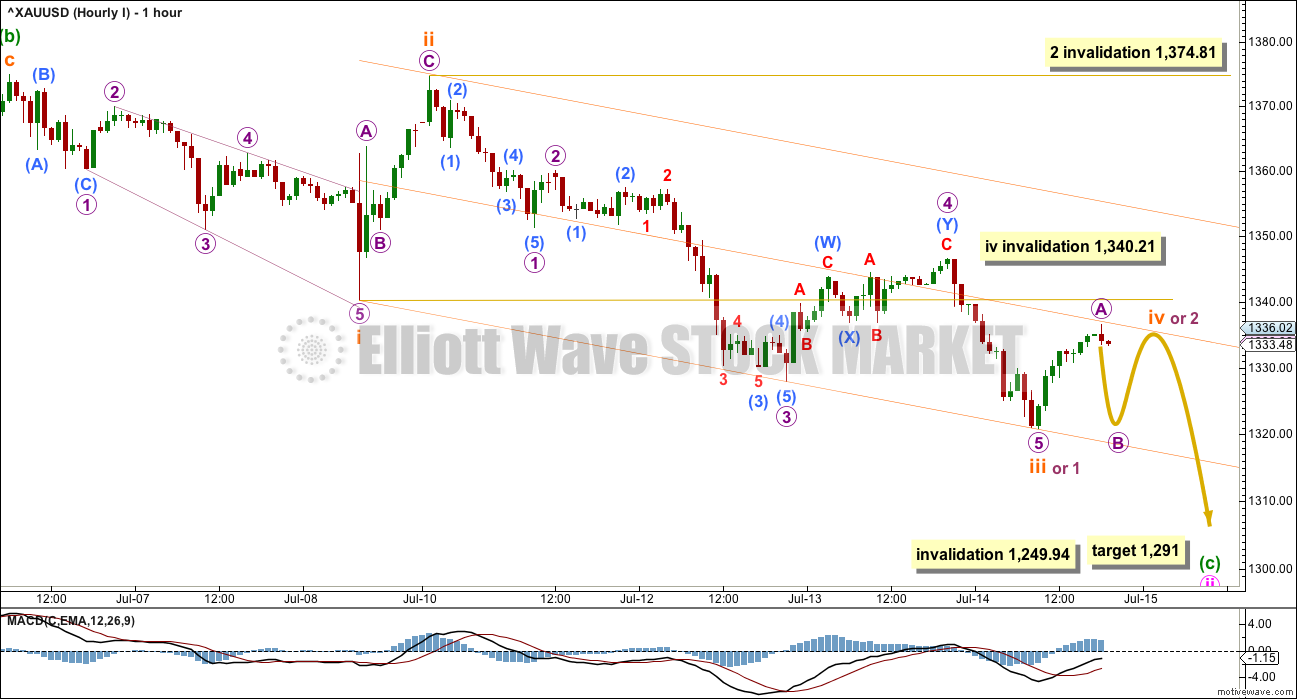
The current upwards movement should be expected to be subminuette wave iv while price remains below 1,340.21. If price moves above 1,340.21, then upwards movement should be expected to be micro wave 2. This idea is better shown in the second hourly chart below.
From the high labelled subminuette wave ii to the low labelled subminuete wave iii, a five wave impulse now looks to be complete. This may be subminuette wave iii in its entirety, or the degree of labelling within this impulse may be all moved down one degree and it could be only micro wave 1 within the impulse of subminuette wave iii.
If subminuette wave iii is over at the last low, then it was just 2.14 short of 1.618 the length of subminuette wave i. Subminuette wave iii exhibits stronger momentum than subminuette wave i, and the strongest portion is the middle of the third wave. This labelling is preferred while price remains below 1,340.21 because it has the right look.
Ratios within subminuette wave iii are: there is no Fibonacci ratio between micro waves 3 and 1, and micro wave 5 is 2.32 longer than equality in length with micro wave 1.
If subminuette wave iv is unfolding, then it is likely to exhibit alternation with subminuette wave ii. Subminuette wave ii was a quick very deep 0.99 zigzag. Subminuette wave iv may be a more time consuming and very shallow sideways flat, combination or triangle.
Draw a channel about this downwards impulse using Elliott’s first technique: draw the first trend line from the ends of subminuette waves i to iii, then place a parallel copy on the end of subminuette wave ii. At this time, subminuette wave iv is finding some resistance at the mid line of the channel. It may continue to find resistance here as it moves sideways.
Subminuette wave iv may not move into subminuette wave i price territory above 1,340.21.
Gold often exhibits swift strong fifth waves, typical of commodities. This is particularly true for Gold’s third wave impulses, but also sometimes its C wave impulses. Look out for a potentially strong fifth wave down for subminuette wave v in the next day or so.
DAILY ELLIOTT WAVE COUNT II
Click chart to enlarge.
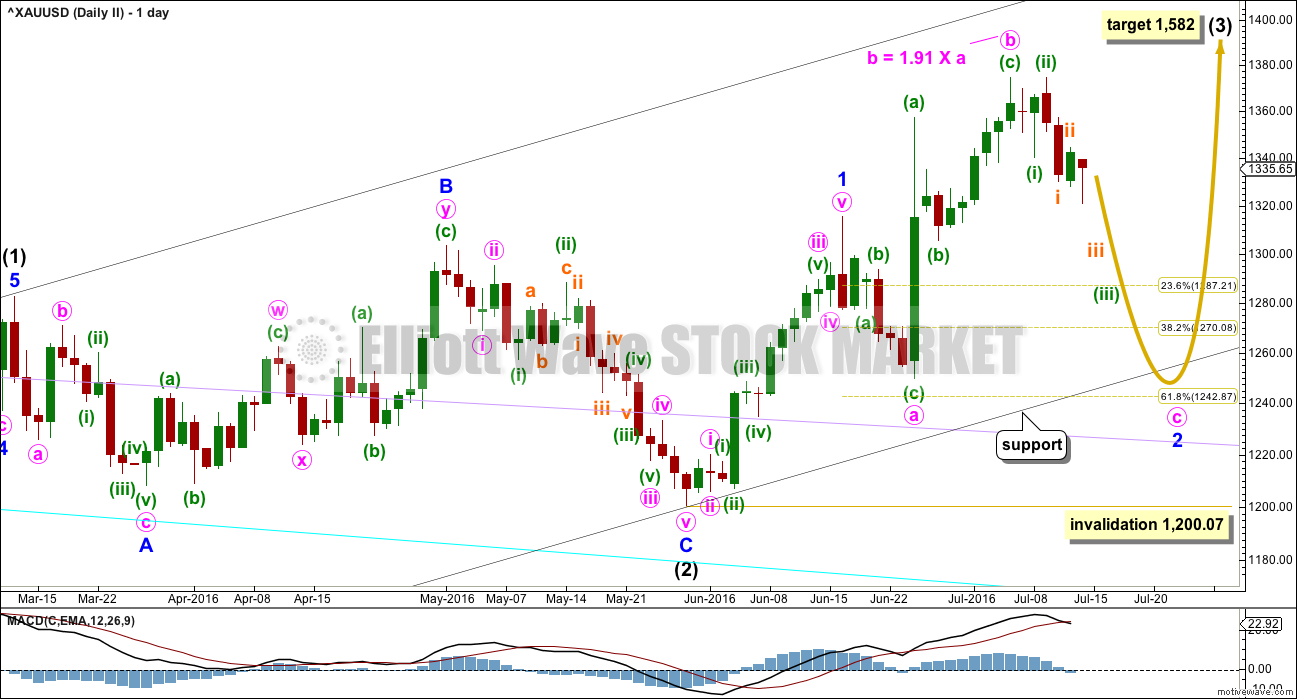
My bottom line is that intermediate wave (2) is highly likely to be over, so I must consider all possibilities for how intermediate wave (3) is starting from the low labelled intermediate wave (2).
What if minor wave 2 is not over? It may be continuing as an expanded flat correction. Again, these are very common structures.
The target for intermediate wave (3) is still the same at 1,582.
Minute wave b is a 1.91 length of minute wave a within the expanded flat of minor wave 2. This is longer than the common range for a B wave within a flat of 1 to 1.38, but still within the allowable convention of up to 2 times the length of wave A. However, it is close to the maximum, so this must reduce the probability of this wave count.
Minute wave c of the flat would be very likely to make at least a slight new low below the end of minute wave a at 1,249.94 to avoid a truncation and a very rare running flat. The 0.618 Fibonacci ratio of minor wave 1 at 1,243 would be a reasonable expectation to achieve this.
Minute wave c must subdivide as a five wave structure, either an impulse or an ending diagonal. So far an impulse looks more likely, and it is more common, so it should be expected in the first instance.
Within the impulse of minute wave c, the third wave of minuette wave (iii) looks like it may be extending. Again, this is a very common tendency for third waves, so this should be expected.
The target expects that minor wave 2 may overshoot the lower edge of the base channel about intermediate waves (1) and (2). This is possible, but it does reduce the probability of the target. The base channel is fairly likely to be respected and should offer strong support.
Minor wave 2 may not move beyond the stat of minor wave 1 below 1,200.07.
HOURLY ELLIOTT WAVE COUNT II
Click chart to enlarge.
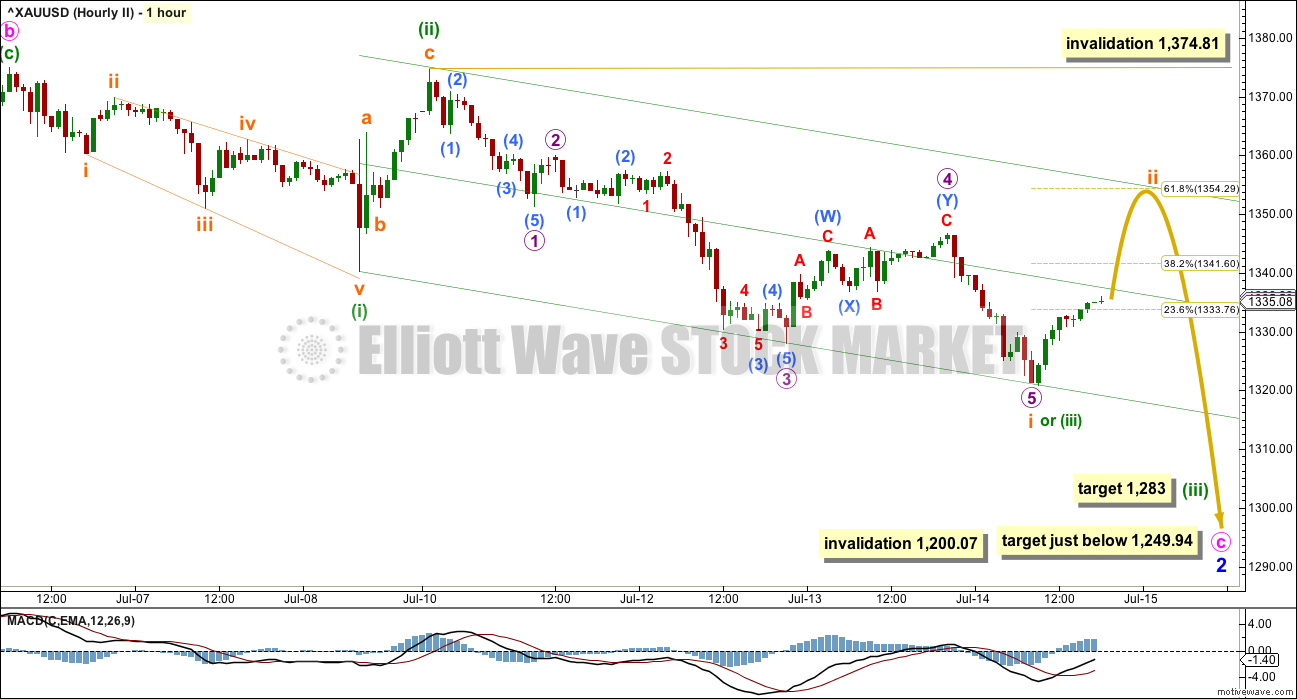
Structure and subdivisions at the hourly chart level for wave counts I and II are essentially the same.
This second wave count has different degrees of labelling, but the idea is the same.
So far from the high labelled here minute wave b, there is a 5-3-5 down complete. This may be minuette waves (i), (ii), (iii) with price now in minuette wave (iv). Or it may be minuette waves (i), (ii), and within minuette wave (iii) only subminuette wave i is complete.
If only subminuette wave i is complete, then the current upwards movement may be another second wave correction for subminuette wave ii. It may end about the 0.618 Fibonacci ratio at 1,354.
At 1,283 minuette wave (iii) would reach 2.618 the length of minuette wave (i).
Subminuette wave ii may not move beyond the start of subminuette wave i above 1,374.81.
If price moves sideways and remains below 1,340.21, then the degree of labelling within the impulse labelled subminuette wave i would be moved up one degree. It would be labelled minuette wave (iii). A final fifth wave down would then be expected in the same way as the first hourly chart is labelled.
The third wave count in yesterday’s analysis could be revived, but today it no longer has the right look in terms of proportion on the daily chart, so it is now discarded.
TECHNICAL ANALYSIS
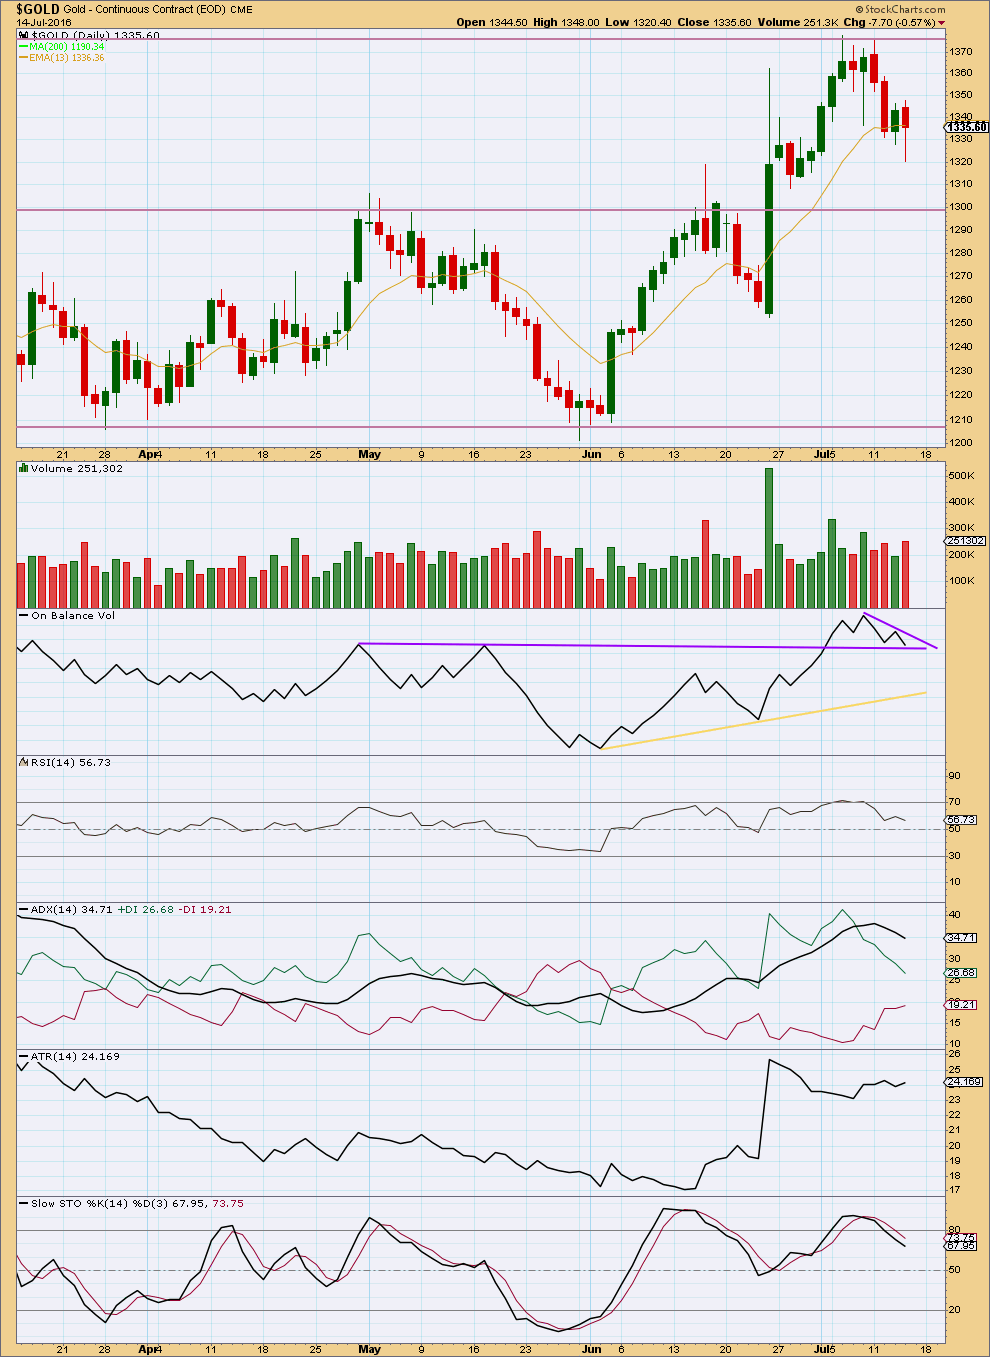
DAILY CHART
Click chart to enlarge.
There was some support for downwards movement in the last session. The fall in price was supported by volume, which was stronger than the prior upwards day. This supports both wave counts. The short term volume profile is still bearish.
Overall, volume is declining as price is falling from the last swing high on 6th of July. The mid term volume profile is still bullish, so this downwards movement still looks like a counter trend movement.
ADX is declining indicating the market is not currently trending. ATR is overall flat, mostly in agreement. Downwards movement may be expected to continue until price finds support and Stochastics is oversold at the same time. Price may find support about 1,300. Stochastics is returning from overbought. This approach expects to see several more days of overall downwards movement to about 1,300.
This downwards movement is resolving overbought conditions for RSI and extreme conditions for ADX. If it continues for a further few days, those indicators will again be able to see price rise.
On Balance Volume has come down to the purple trend line. If OBV moves up and away from that line, it would be a small bullish indicator. A new line is added to show very short term resistance. A break above this short steep purple line would be another short term bullish indicator. A break below the purple line that OBV sits on today would be a reasonably strong bearish indicator; reasonably strong because this line is horizontal, long held and tested twice before. A break below this purple line would offer strong support for both Elliott wave counts.
This analysis is published @ 07:19 p.m. EST.
Gold is shooting up after the news of “Turkey’s Army Says It Seized Power as Premier Vows to Resist”. http://www.bloomberg.com/news/articles/2016-07-15/turkish-premier-says-elements-of-army-attempt-to-seize-power
Gold jumped from 1327 at 4:01 am to 1339 at 4:54 pm EST.
Dollar surges against Turkish lira on reports of military activity
Published: July 15, 2016 4:02 p.m. ET
The dollar USDTRY, +4.9161% soared 2% against the lira to its strongest level in a week, buying 2.92 lira, compared with 2.88 late Thursday.
Attempted coup under way in Turkey
Published: July 15, 2016 5:07 p.m. ET
http://www.marketwatch.com/story/attempted-coup-under-way-in-turkey-2016-07-15
A triangle may be forming, so that price continues to find resistance at the mid line of the channel. It that’s the case then the mid line is going to have to give way so the triangle can complete.
MACD is hovering about zero, this supports a triangle.
I wouldn’t consider a zigzag with a truncated C wave, the probability is very low. That would also not give adequate alternation with subminuette ii zigzag.
A triangle is much more likely.
Gold’s fifth waves out of its fourth wave triangles are often surprisingly short and brief. The target may now be too low
Wave A of triangle is exceeded now? Also in GCQs
Yes. The triangle is now invalidated 🙁
It can’t be a flat, B is < 0.9 X A
So it’s either a zigzag, now complete and ready for subminuette v down
OR
It’s going to continue further sideways as a flat (with A as a zigzag) or combination. To exhibit alternation with subminuette ii
Nope. I think I have a better solution.
It could now be a complete combination.
Now ready for subminuette v down
Lara, surfs up, enjoy the weekend :o)
Surf Forecast & Surf Reports for NEW ZEALAND
http://www.surf-forecast.com/countries/New-Zealand/breaks
Thanks Richard! I’m looking out my window and I see some waves still… it’s been big this week but howling winds and cold stormy winter conditions. Brrr!
I may get some waves today…. heading further north tomorrow for something a bit bigger….
This is where I live: http://www.surf-forecast.com/breaks/Mangawhai-Heads
At 2:58 pm at $156.37 got multiple selling signals for NUGT at 5 minute time frame the last such signals were at 10:30 am after the morning high then NUGT drifted down until 1:35 pm NUGT mid day low at 152.32. Most longer time frames were in a decline today for NUGT.
The bottom at 1:35 pm of a big 5-3- 5 down maybe NUGT moves up from here? Gold temporary bottom at 1:52 now up?
Hi Richard,
Does this mean that the lower target of $1,291 per the Hourly Wave Count I no longer applies? I was thinking that when gold touched $1332 on the way back up from this morning that we were heading down from this point? As always, thank you for the guidance!
Of course Lara’s lower targets still apply.
I’m speaking in regards just to a day trade before the close.
Alan did mention earlier “price is rising in micro c, targeting just below 1340.21 invalidation point.”
Hopefully the gold target before the close is in between 1336.85 and 1340.21 to end micro c of subminuette iv or is it possible it ended at 12:39 pm
at 1332.33 or was that just the top of the 3rd wave up and were in the 4th wave now ended at 1:15 pm and then the 5th heads up to just under 1340.21?
Likely sub-micro c of micro 2 of sub-minuette v of (c) is near ending
Sub-minuette iv peak (a rare running flat, quite bearish) at 8:13 Am GCQ high of 1336.70, Micro 1 down at 1322.60 at 9:25 and now in Micro 2 up?
Basis Lara’s 60 MIn. Count I chart above.
My opinion is that micro a of subminuette 4 ended at 1366.85 at 0600 ET. The low at 1322.59 at 2120 was micro b, and now price is rising in micro c, targeting just below 1340.21 invalidation point. This count has a classical 5-3-(yet 5) look.
Thx. Alan
I dont think alan thats the case…it might actually be a truncated c wave…of micro c…i can see the chart posted by lara in which she draws a curved line ending at the upper edge of hourly channel…and its below the high of micro a…
Yaa i know i may be assuming it wrong…
Is it possible that 1322.59 at 9:25 am was just the 3rd wave in micro b and 4th wave ended at 9:57 and now in 5th wave down at 1323.50 at 10:50 am or is that a 2nd wave in Micro c up?
I still think my count as given above is correct.
After that, micro c has so far shown submicro 1 at 1332.33 at 0030 hours and submicro 2 at 1325.86 at 0330 hours. There is not enough movement beyond that to conclude whether micro c is an impulse or any other structure.
To be continued … next week.
Folks, have a great weekend.
Price after hours has shown a strong rise beyond submicro 1. Currently, it is at 1333.62. This greatly reduces the possibility of a triangle structure.
With the release of Retail Sales and CPI this morning at 8:30 ET, gold dropped quickly from $1334 to $1326. Since then, it’s been recovering and now at around $1330.
I’m just wondering if gold is expected to drop further throughout the day and if the wave count is still in line with expectations.
Thanks!
This is my attempt to be like Richard and answer my own question… hahahahaha.
Based on the price of gold NOW, it’s falling just as Lara predicted. So interesting!
Funny LOL.
You’re doing great!
Perhaps Micro 1 ended at 12:33Am and Micro 2 ended at 6:25 AM, if you have a 5 min. chart, pl do post.Thx.
Excitement fills the air around your analysis Lara.
Concur — thanks for the great analysis 🙂
Thanks Richard!
I’ve taken a long in Silver yesterday, expecting it to break out upwards. Will see if that turns out to be a winner…. or not.
Lara I am surprised that silver will breakout while gold is going to 1291-1249-???
This relation will make Silver to gold ratio go higher. With that miners will go higher.
I have been reading the analysis for a while. Just a quick question to see if anyone looked at the YEN and bonds in relation to PMs? It is expected that these three will move in tandem. The bullish sentiment in Silver is unhealthy considering that GOLD is not reflecting the same. The divergence could mean that GOLD just put in a significant top and now silver should follow the trend down.
IKR.
Silver has been moving up much more strongly than Gold.
I think Silver is finishing a sideways triangle while Gold finishes a deeper expanded flat.
I expect both will break out upwards, but Gold will move lower than Silver first.
They just don’t always move perfectly together. The trade I made for Silver was supposed to be short term anyway.
GDX