
The small pennant pattern noted in yesterday’s analysis continues to move price sideways in a narrow range. The breakout direction is expected to be the same.
Summary: The trend is still up. A multi day correction against the trend is unfolding and still looks incomplete. A target for it to end is either 1,297 or just below 1,249.94. In the short term, the volume profile is still more bearish than bullish. A small pennant pattern suggests more downwards movement is likely.
New updates to this analysis are in bold.
Last weekly chart can be found here.
Grand SuperCycle analysis is here.
DAILY ELLIOTT WAVE COUNT I
Click chart to enlarge.
There are two wave counts today presented in order of probability.
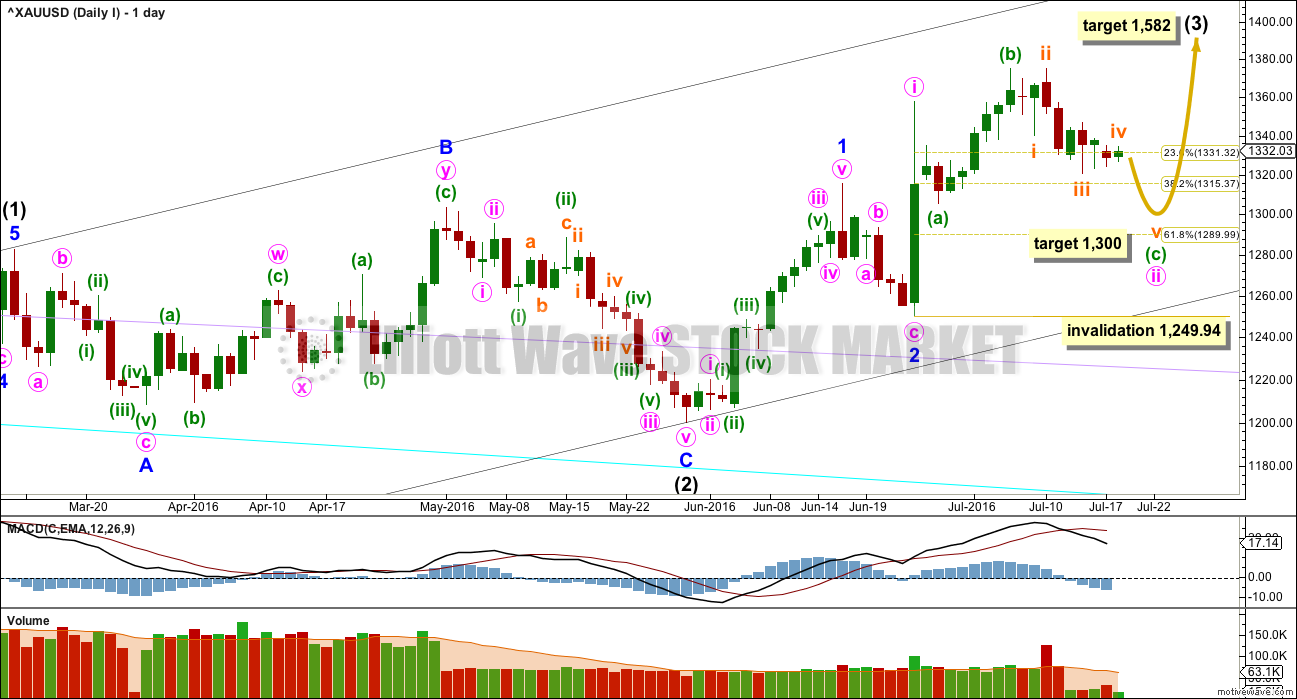
Intermediate wave (2) is a complete expanded flat correction. Price from the low labelled intermediate wave (2) has now moved too far upwards to be reasonably considered a continuation of intermediate wave (2). Intermediate wave (3) is very likely to have begun and would reach 1.618 the length of intermediate wave (1) at 1,582.
Intermediate wave (3) may only subdivide as an impulse.
So far minor waves 1 and 2 may be complete within intermediate wave (3). The middle of intermediate wave (3) may have begun and may also only subdivide as an impulse.
Within minor wave 3, minute wave i is complete. Minute wave ii may be continuing as an expanded flat correction. Expanded flats are very common structures.
Within minute wave ii, minuette wave (a) subdivides as a quick three wave structure. Minuette wave (b) subdivides perfectly as a zigzag and is a 1.34 length of minuette wave (a), within the normal range of 1 to 1.38.
It would be highly likely for minuette wave (c) to make at least a slight new low below the end of minuette wave (a) at 1,305.59 to avoid a truncation and a very rare running flat.
The target is now recalculated at subminuette degree at the hourly chart level. If this target is wrong, it may be a little too high. If price drops through 1,300, then the next target would be at 1,291 – 1,290 where minuette wave (c) would reach 1.618 the length of minuette wave (a), and minute wave ii would end at the 0.618 Fibonacci ratio of minute wave i.
Minuette wave (c) may only subdivide as a five wave structure, either an impulse or ending diagonal. So far it looks like the more common impulse.
Minute wave ii may not move beyond the start of minute wave i below 1,249.94.
HOURLY ELLIOTT WAVE COUNT I
Click chart to enlarge.
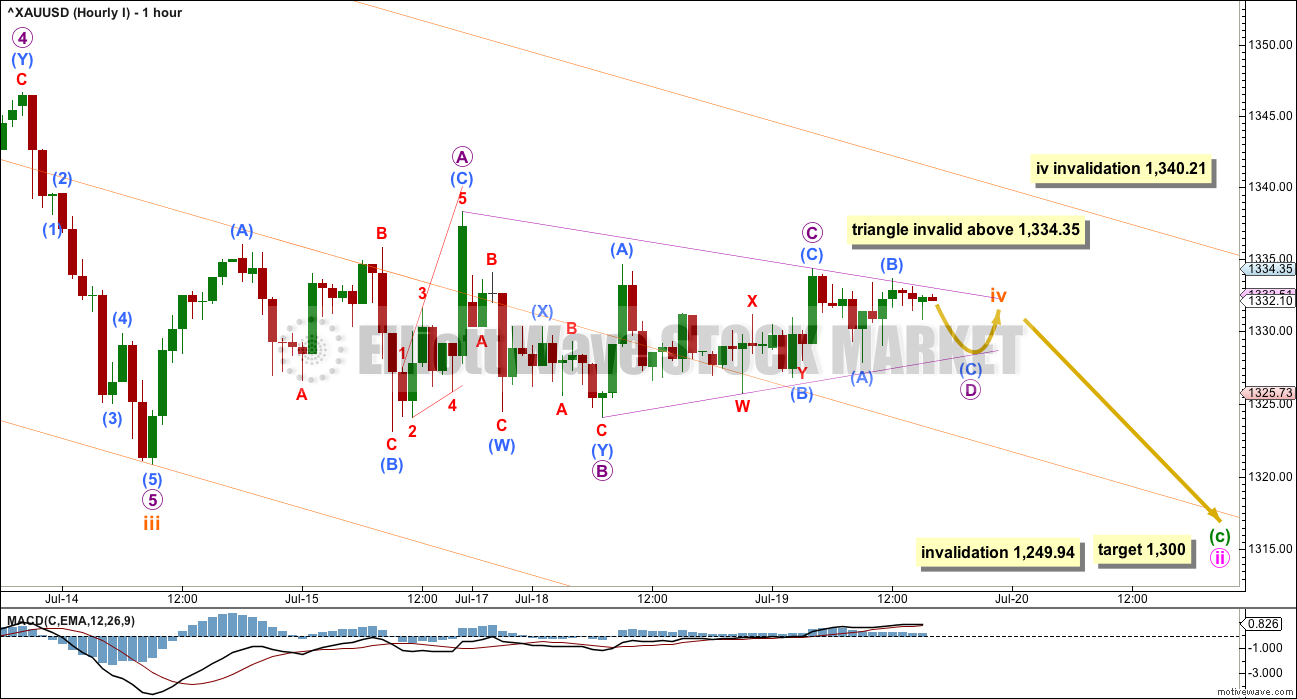
The current upwards movement should be expected to be subminuette wave iv while price remains below 1,340.21. If price moves above 1,340.21, then upwards movement should be expected to be micro wave 2. If price moves above 1,340.21 before new lows are made, then the degree of labelling of subminuette wave iii would be moved down one degree. I would not consider the possibility that the whole structure of minute wave ii is over because minuette wave (c) would be truncated by 41.04. The truncation would be way to large for any serious consideration.
From the high labelled subminuette wave ii to the low labelled subminuete wave iii, a five wave impulse now looks to be complete. This may be subminuette wave iii in its entirety, or the degree of labelling within this impulse may be all moved down one degree and it could be only micro wave 1 within the impulse of subminuette wave iii.
If subminuette wave iii is over at the last low, then it was just 2.14 short of 1.618 the length of subminuette wave i. Subminuette wave iii exhibits stronger momentum than subminuette wave i, and the strongest portion is the middle of the third wave. This labelling is preferred while price remains below 1,340.21 because it has the right look.
Ratios within subminuette wave iii are: there is no Fibonacci ratio between micro waves 3 and 1, and micro wave 5 is 2.32 longer than equality in length with micro wave 1.
Further sideways movement over the last 24 hours has continued the triangle structure which now looks clearer. MACD is hovering close to the zero line supporting the triangle. Within the triangle, so far micro waves A, B and C look to be complete. Micro wave D looks like it will probably move lower and may end at the B-D trend line as it is drawn across the last two lows. Micro wave D may not move below the end of micro wave B at 1,324.09. Thereafter, micro wave E may not move above the end of micro wave C at 1,334.35. The triangle will remain valid while price remains below this point.
The target is again recalculated today. Subminuette wave v downwards out of the triangle may end about the round number pivot of 1,300.
If the triangle is invalidated with a new high above 1,334.35, then subminuette wave iv may be morphing into a combination. Subminuette wave iv will remain valid as long as price does not move above 1,340.21.
Gold’s fifth waves to follow its fourth wave triangles are often surprisingly short and brief. If the triangle remains valid, then a short quick fifth wave down may complete in about one session. The minimum expectation for it to end would be at least slightly below 1,305.59, so that minuette wave (c) avoids a truncation. At 1,297 subminuette wave v would reach equality in length with subminuette wave i.
Draw a channel about this downwards impulse using Elliott’s first technique: draw the first trend line from the ends of subminuette waves i to iii, then place a parallel copy on the end of subminuette wave ii. Subminuette wave v may end about the lower edge of this channel.
Although Gold has a tendency to strong swift fifth waves, typical of commodities, the tendency of Gold to exhibit short and brief fifth waves after a fourth wave triangle is stronger. At this stage, if the triangle remains valid and price breaks out downwards as expected, it would be most likely to be short, brief and maybe relatively weak.
Subminuette wave iv may not move into subminuette wave i price territory above 1,340.21.
DAILY ELLIOTT WAVE COUNT II
Click chart to enlarge.
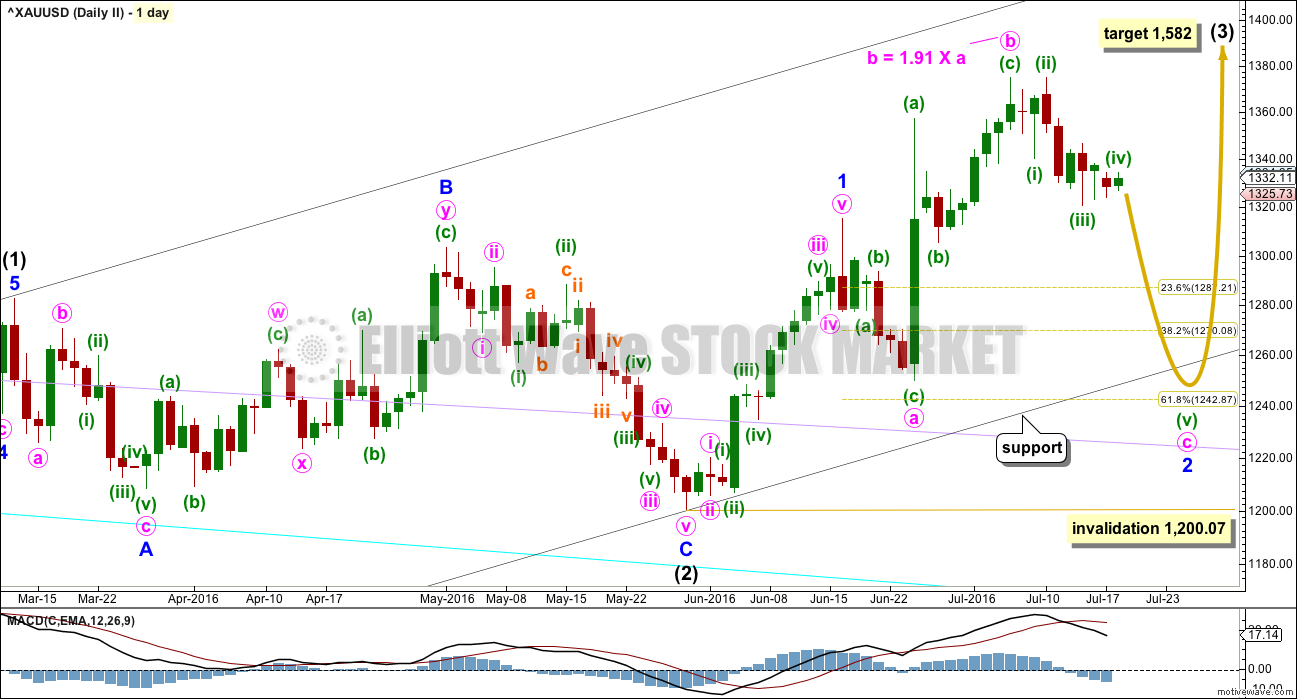
My bottom line is that intermediate wave (2) is highly likely to be over, so I must consider all possibilities for how intermediate wave (3) is starting from the low labelled intermediate wave (2).
What if minor wave 2 is not over? It may be continuing as an expanded flat correction. Again, these are very common structures.
The target for intermediate wave (3) is still the same at 1,582.
Minute wave b is a 1.91 length of minute wave a within the expanded flat of minor wave 2. This is longer than the common range for a B wave within a flat of 1 to 1.38, but still within the allowable convention of up to 2 times the length of wave A. However, it is close to the maximum, so this must reduce the probability of this wave count.
Minute wave c of the flat would be very likely to make at least a slight new low below the end of minute wave a at 1,249.94 to avoid a truncation and a very rare running flat. The 0.618 Fibonacci ratio of minor wave 1 at 1,243 would be a reasonable expectation to achieve this.
Minute wave c must subdivide as a five wave structure, either an impulse or an ending diagonal. So far an impulse looks more likely, and it is more common, so it should be expected in the first instance.
Within the impulse of minute wave c, the third wave of minuette wave (iii) looks like it may be extending. Again, this is a very common tendency for third waves, so this should be expected.
The target expects that minor wave 2 may overshoot the lower edge of the base channel about intermediate waves (1) and (2). This is possible, but it does reduce the probability of the target. The base channel is fairly likely to be respected and should offer strong support.
Minor wave 2 may not move beyond the stat of minor wave 1 below 1,200.07.
HOURLY ELLIOTT WAVE COUNT II
Click chart to enlarge.
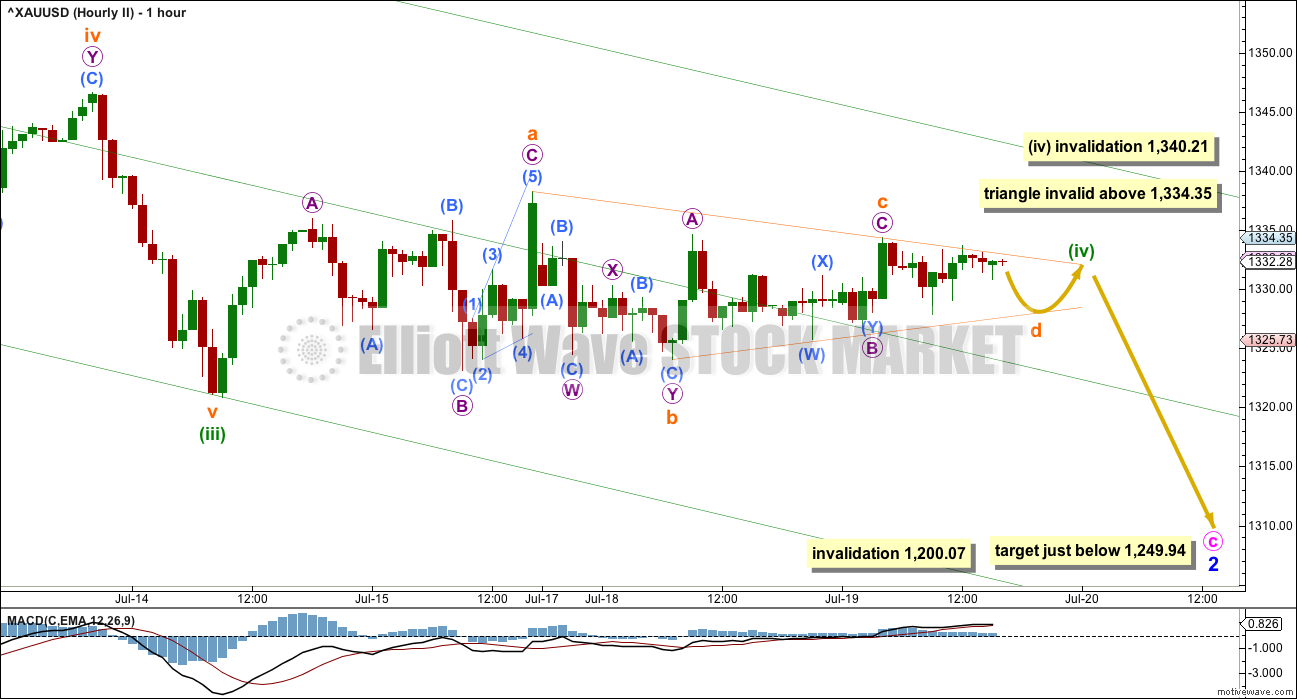
Structure and subdivisions at the hourly chart level for wave counts I and II are essentially the same.
This second wave count has different degrees of labelling, but the idea is the same.
So far from the high labelled here minute wave b, there is a 5-3-5 down complete. This may be minuette waves (i), (ii), (iii) with price now in minuette wave (iv). Or it may be minuette waves (i), (ii), and within minuette wave (iii) only subminuette wave i is complete (as per the labelling on yesterday’s second hourly chart).
At this stage, it looks like a triangle is completing, so this looks most likely to be minuette wave (iv). If this sideways movement is now to be considered one degree lower as subminuette wave ii within minuette wave (iii) extending further, then it is not grossly disproportionate to minuette wave (ii) one degree higher. Minuette wave (ii) lasted 10 hours, so this current correction so far has lasted 79 hours. For this reason the degree of labelling for the current correction has been moved up one degree; it is likely to be the fourth wave counterpart to the prior second wave.
Triangles are time consuming sideways structures. The breakout direction should be the same direction as entry, in this case down.
If the triangle is invalidated with a new high above 1,334.35, then minuette wave (iv) may be morphing into a combination. Minuette wave (iv) may not move into minuette wave (i) price territory above 1,340.21.
The target for this second wave count is for minute wave c to move at least slightly below the end of minute wave a at 1,249.94 to avoid a truncation and a very rare running flat.
TECHNICAL ANALYSIS
WEEKLY CHART
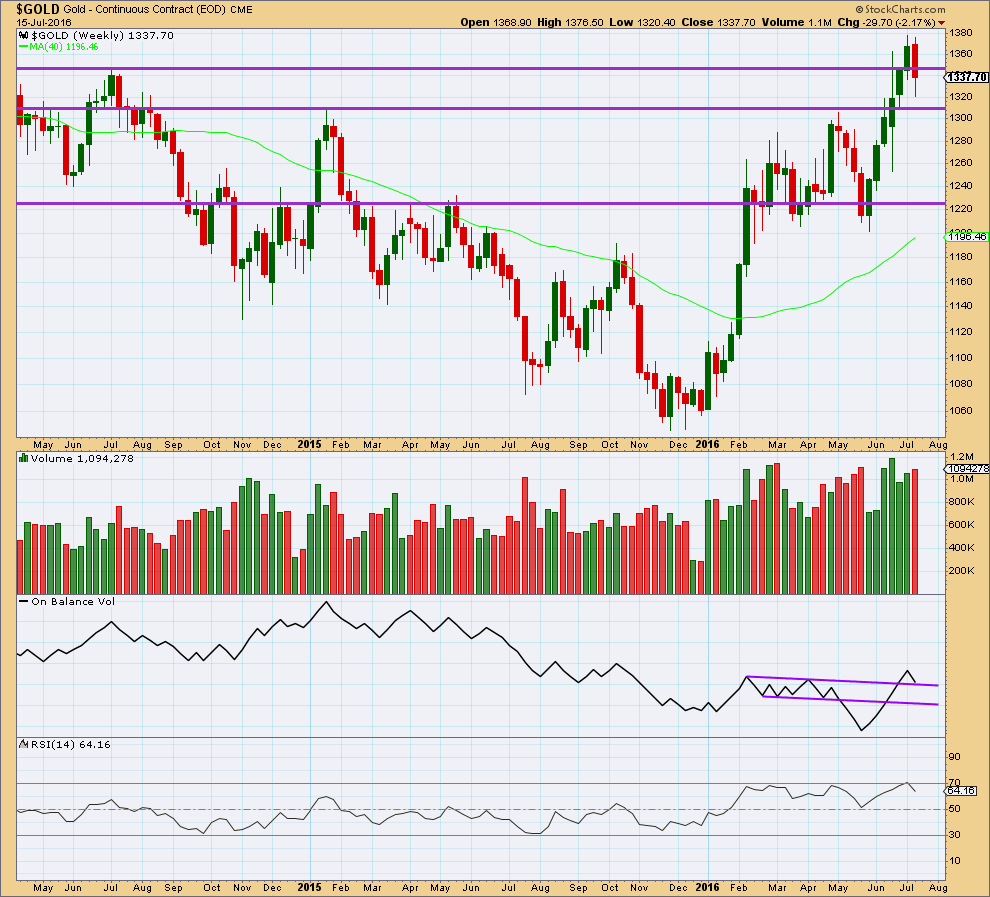
Click chart to enlarge.
Last weekly candlestick completes a bearish engulfing candlestick pattern with higher volume. This is a strong bearish signal and strongly supports the wave count in expecting more downwards movement. If targets are wrong, they may be too high.
On Balance Volume has come down to find support at the upper purple trend line. This may offer some support. If OBV moves up and away from this line this week, it would be a reasonable bullish signal. A break below this line would be a reasonable bearish signal. The next line to offer support is not too far away but would still allow for a reasonable fall in price.
DAILY CHART
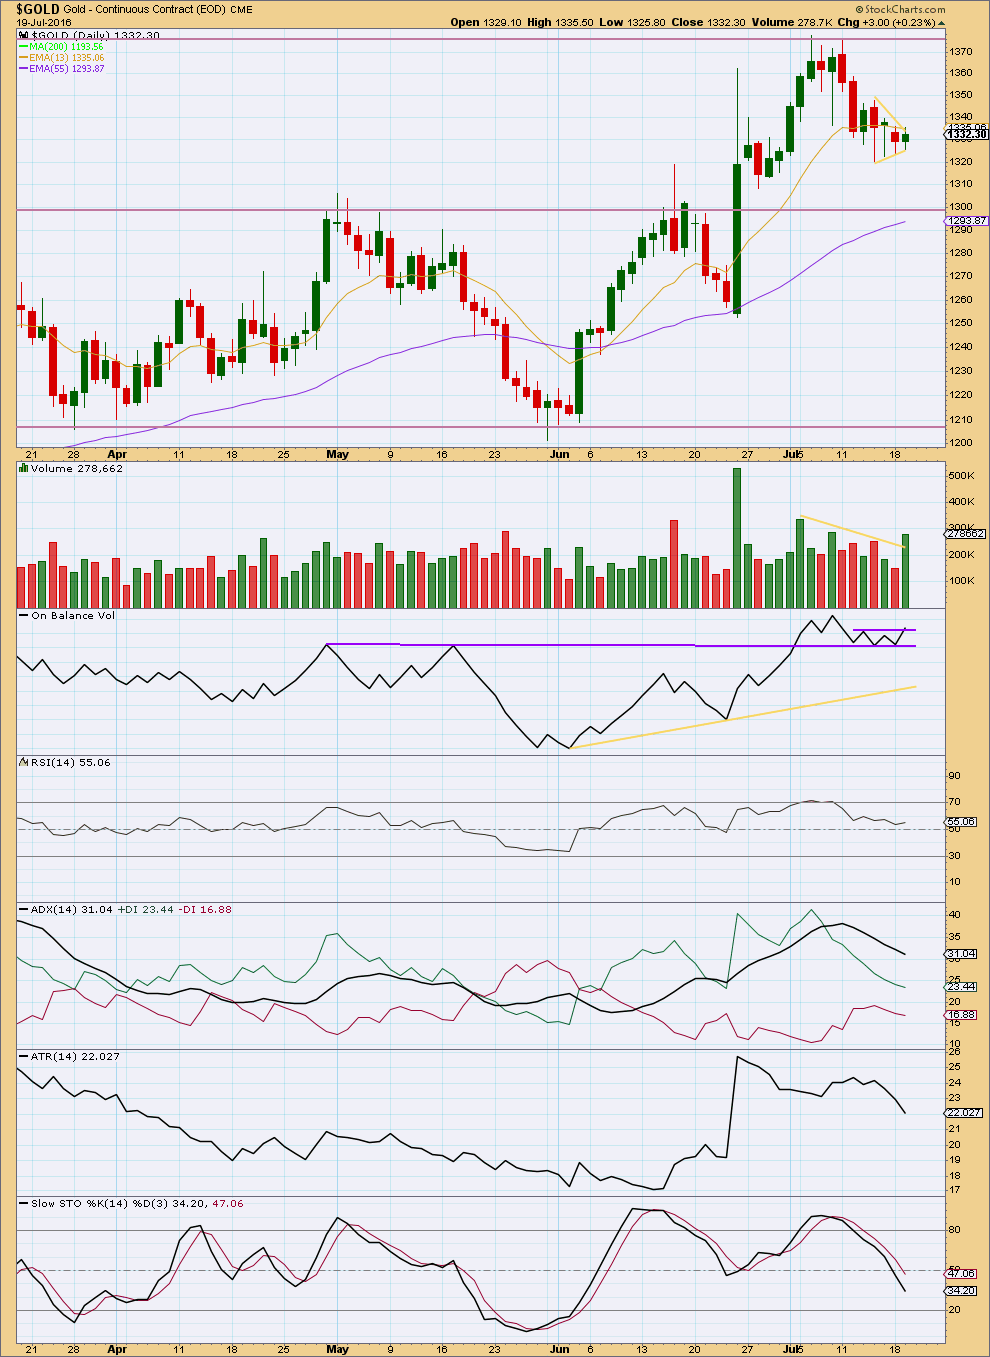
Click chart to enlarge.
There is today a large difference in volume data from StockCharts and COMEX (on the first daily Elliott wave chart above). Volume analysis today will be done on COMEX data, as this comes directly from the Chicago exchange and I expect it should be more reliable.
Volume is overall declining as price is moving sideways in a small pennant pattern for the last three days. Today’s small upwards day is an inside day on lighter volume (COMEX data). A target for the movement out of the small pennant pattern, using the measured rule, would be about $56 below the breakout price point.
On Balance Volume may find resistance at the short upper purple line. If tomorrow moves price higher, it would break above this line and provide a weak bullish signal. A break below the longer purple line would be a strong bearish signal.
RSI is close to neutral. There is plenty of room for price to rise or fall.
ADX is declining, returning from extreme. If a trend returns, it would still be up: the +DX line is still above the -DX line.
ATR is also clearly declining. This current downwards swing should be expected to be a counter trend movement. It should offer a good opportunity to join the longer upwards trend when it finds a low.
The longer Fibonacci 55 day moving average is approaching the support line about 1,300. It would be reasonable to expect downwards movement from price to stop about there. This fits neatly with the Elliott wave count.
Stochastics is not yet oversold. When Stochastics reaches oversold at the same time price finds support, then the downwards swing from price may be expected to end.
This analysis is published @ 07:58 p.m. EST.
I think this is what’s happening.
The triangle ended after the whipsaw. Micro wave C continued sideways, micro D and E were both quick. On the five minute chart the subdivisions look right, particularly micro D, that looks like a three.
Within minuette wave (c) I expect micro 1 is complete. Micro 2 may be complete, but it may also move higher as an expanded flat.
The targets for now are the same, I will see if I can refine them now I can calculate at a second wave degree.
Considering the magnitude of micro 1, with micro 3 and 5 to complete, wouldn’t it be reasonable to assume minute II will end much lower than 1300?
It would, except the fourth wave was a triangle.
In my experience with this market fifth waves out of fourth wave triangles are so often surprisingly short and brief.
Learning that lesson was valuable, it saw us expecting a trend change sooner rather than later back in March when Gold had a short fifth wave up out of a fourth wave triangle.
I could be wrong of course. Often is not the same as always. This fifth wave may be longer than my target at 1,300 expects.
The target may be entirely reasonable if micro 3 is shorter than micro 1, and micro 5 is shorter still.
Or the target may be too high.
As this fifth wave unfolds lower then I can see, is it going to be short? Or is the target too high?
Ah yes, you did mention the 5th waves out of triangles are usually short and brief. Thanx again for the reminder…
$XAU down 6% as of 3:46 pm
Gold 100.33 -6.46 -6.05
$HUI down 5.72%
Gold, silver settle at lowest levels in about three weeks
http://www.marketwatch.com/story/gold-falls-as-dollar-firms-on-renewed-fed-rate-hike-expectations-2016-07-20
Lara
Now a last leg of dropping wave is required to complete this correction…what would be the stops u feel for longs may be here for short term..??…i mean suppose alt daily count is in play though it is having less than 5%chance now as the charts having a perfect shape to prefer main count…
It depends on your risk appetite.
I won’t be entering long here, I’ll hold my short another day or two until 1,300. That’s my profit target.
To not get stopped out right before price rockets off upwards ideally stops should be just below 1,200.07. But in practice that’s just too far away isn’t it. So use the lilac support line on the daily charts. That would see a stop about 1,235. That long term line (see how its drawn from the weekly chart) should provide very strong support if Gold is now in a bull market.
Beware: if choosing to use a stop from the first daily wave count just below 1,249.94 so that you can get a larger position, then greed is a factor. If that’s a reason for putting a stop that high up then don’t do it. Beware of how greed affects trading and be honest with reasons for putting stops where you do.
Gold was in a 1 hour trend line slightly up from July 14th until 3:00 am this morning.
http://www.pmbull.com/gold-price/
Gold at 1,316.88 at 1:48 pm new day low.
GDX new day low at 28.30 NUGT 130.38 at 1:53 pm.
and dropping…
Lara
As we have it in Primary Daily count Minor 1=13 T Days, Minor 2 =6 days,
Minute[i]- 1 day and Minute [ii]= 9 days so far and still ongoing?
From a proper look and time wise Wave proportionality here is another option by placing 5 impulse Wave top of Minor 1 at 1377.50(SPQ), it does have [iv]/[I] O/L as needed and clean 5 waves as required. This has 27 TD for Minor 1 and 9 days for Minute [a] and MInute [b] for 4-5 days here 50% retrace of [a] and Minute [c] after towards 1289-1248
as you have for another 4-5+9 TD=14 more days? This provides a better symmetry?
Is this a viable option? (You have been tracking waves for a while now and are good at it, TIA)
I’ve considered and charted that idea. As you note, if 1 ended at the last high then it would have to be a leading diagonal.
The trend lines for a diagonal have to be drawn from 1-3 and 2-4. When you draw them like that neither fit the movement. The fit is so bad, I discarded the idea. It just looks completely wrong.
Thanks Alan, that’s a big help.
James, glad to help. Hope my estimates are correct.
Alan: ” before a strong Minute 3 ensues.”
I am waiting for the strong minute 3 and then the strong int wave 3 target a2 1582.
Would you alert us when M 3 begin????
Of course Lara will be all over when that happens. Am I glad to be here.
Papudi, does M 3 stand for minute 3 or minuette 3?
GDX volume 1.8 million shares was enough to make the ETF the most-active stock in the premarket session. Drops to 2 week lows.
http://www.marketwatch.com/story/gold-miners-etf-drops-in-heavy-volume-to-2-week-low-2016-07-20
I am playing for an impulse for subminuette 5 of minuette c of Minute 2 of Minor 3.
The triangle was invalidated and subminuette 4 ended at 1338.53.
SM5 = SM1 yields a target of 1303.83.
SM5 = 0.618 SM3 yields a target of 1304.84.
Minuette C = 1.382 Minuette A of the expanded flat Minute 2 yields 1301.63.
So, I’m plumbing for one of these targets before a strong Minute 3 ensues.
At the moment, my wave count sees submicro 1 of micro 3 of SM5 ended at 1313.63.
Submicro 2 is underway, may have ended at 1320.12.
I feel that the final low will not be reached today, maybe not even tomorrow. Most probably Friday. Unless of course some event shatters confidence in gold in the immediate future.
Thanks for sharing your estimations.
US Fed (FOMC) is next tue/wed 2pm. Wonder how that will fit into this 3rd wave structure. Beginning of the up?? (or 2nd wave down within the up) WHO KNOWS! lol
THURSDAY, JULY 21
8:30 am US Weekly jobless claims
FRIDAY, JULY 22
9:45 am US Market manufacturing PMI flash
Any thoughts on the low from here?
Gold hit 1313.63 at 9:32 am.
How soon could gold hit $1,300 area?
Micro 1 done a 8:15. On GCQ 22 points drop.
Think we have just seen completion of wave 1 of wave 5.
At 9:45 pm Tuesday gold spiked above 1,334.35 to $1,338.53 invalidating the triangle.
“If the triangle is invalidated with a new high above 1,334.35, then subminuette wave iv may be morphing into a combination. Subminuette wave iv will remain valid as long as price does not move above 1,340.21.”
9:45 pm high may be the Wave iv as a flat now, heading lower? Wiped out short STOPS.
Lara, I think there’s a jinx. Numerous times now one or more counts is invalidated shortly after publishing. However, subminuette iv may have just completed as a combination
🙁 Yes. there’s a jinx alright 🙁
I think I put my triangle invalidation point too close. It still doesn’t look like a flat… it could be a combination. But C could have moved further, it’s still below A.
Let’s see if this works for GDX
Thanks, Dreamer. I hope GDX breaks that flag soon. 🙂
Dreamer – GDX closed just 7 cents above the low of your target range as it closed at 27.96 -1.74 (-5.86%) with a day low of 27.80.
If gold drops to 1300 area than GDX drops more.
Yes, lower target worked well for today. Now the question is, does it go lower?
If gold drops fast enough than yes if it is a slow process down than in question.