
Upwards movement invalidated the main hourly Elliott wave count increasing the probability of the two alternates, both of which expected price to move higher.
Summary: Probability has shifted to a third wave up being underway. The mid term target remains at 1,437. Volume, momentum and RSI will be watched closely as price makes new highs above 1,357. If there is any weakness or divergence, then it may be possible another counter trend movement could unfold before the upwards trend begins in earnest. At the end of the week, any long positions opened below 1,357 may be held for greater profits next week.
New updates to this analysis are in bold.
Grand SuperCycle analysis is here.
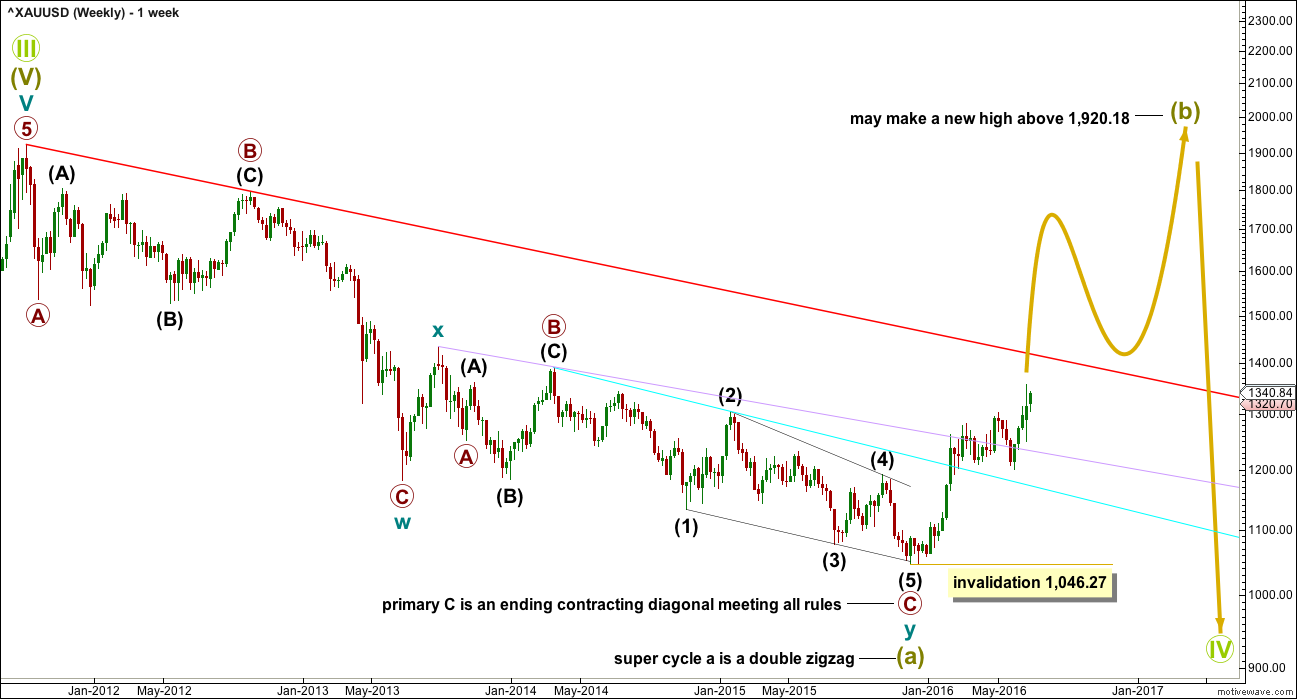
WEEKLY ELLIOTT WAVE COUNT
Click chart to enlarge.
The cyan trend line is breached. This gives substantial confidence that Gold has very likely changed from bear to bull.
This downwards movement subdivides as a double zigzag from the all time high.
Within the first zigzag labelled cycle wave w, primary wave C is 10.13 short of 1.618 the length of primary wave C.
Within the second zigzag labelled cycle wave y, there is no Fibonacci ratio between primary waves A and C. Primary wave C is an ending contracting diagonal which meets all Elliott wave rules.
For this downwards movement this is the only wave count that I have been able to see so far which meets all Elliott wave rules. I remain aware that Elliott Wave International and Danerics have this downwards movement as a five wave impulse which ends with a contracting diagonal for the fifth wave, but that wave count violates the rule for wave lengths within a contracting diagonal. I will keep that wave count in mind, but for now I do not want to publish a wave count which does not meet all Elliott wave rules as laid out in Frost and Prechter.
Grand Super Cycle wave IV may not be a combination because the first wave subdivides as a multiple, and the maximum number of corrective structures within a multiple is three. To label multiples within multiples increases the maximum beyond three, violating the rule.
It may not be a zigzag because Super Cycle wave (a) subdivides as a three and not a five.
This leaves two groups of corrective structures: flats or triangles.
Within an expanded flat or running triangle, Super Cycle wave (b) may make a new high above the start of Super Cycle wave (a) at 1,920.18.
Within a flat, Super Cycle wave (b) must retrace a minimum 90% of Super Cycle wave (a) at 1,833.71.
Super Cycle wave (b) may be any one of 23 possible corrective structures. First, a move of this size should have a clear five up on the daily and weekly charts. That may now be seen as complete. Now that a five up is complete, no second wave nor B wave may make a new low below its start at 1,046.27.
On the way up, the next long term line of resistance is the red trend line.
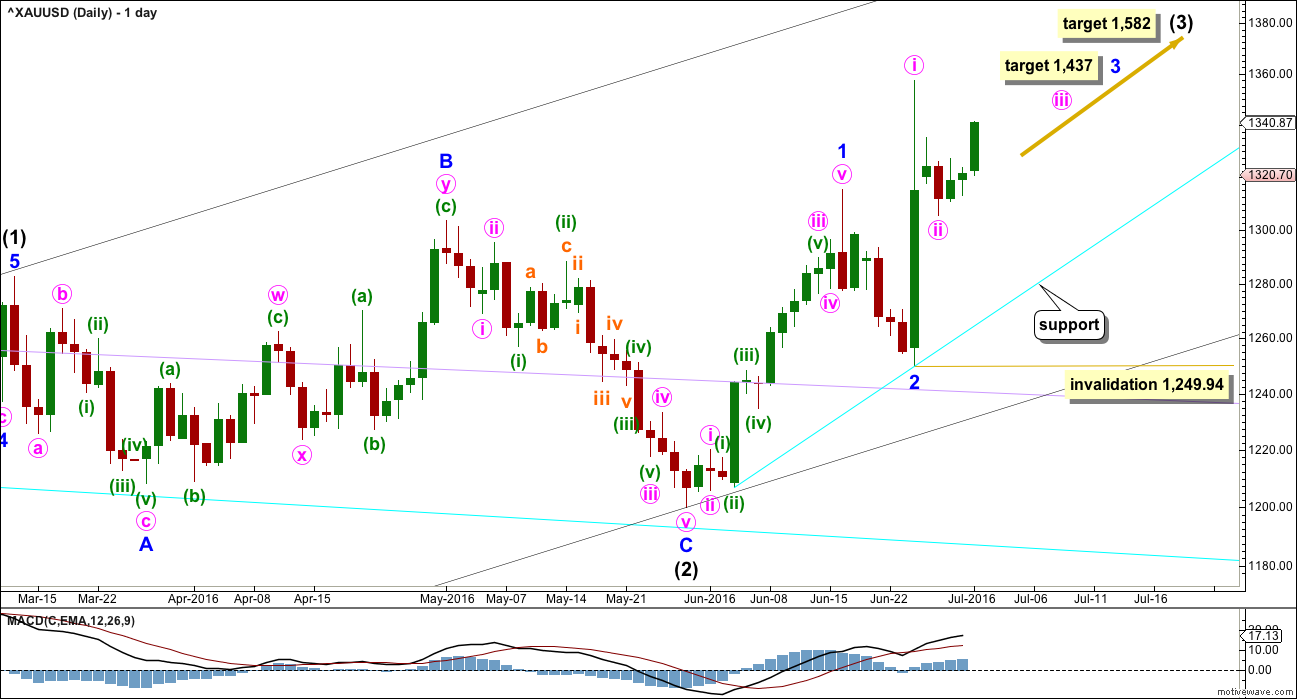
DAILY ELLIOTT WAVE COUNT
Click chart to enlarge.
Intermediate wave (2) is a complete expanded flat correction. It is a shallow 0.350 correction of intermediate wave (1) lasting 56 days, just one more than a Fibonacci 55. There is no Fibonacci ratio between minor waves A and C. Minor wave C is a complete impulse.
I have looked back at the last two big cycle degree up movements within the last bull market: the first move from the low at 255.05 in April 2001, and the next move from the low at 682.75 in October 2008. Within the first move, the beginning series of corrections were 0.76, 0.6 and 0.96 in depth. Within the second move, the beginning series of corrections were 0.82, 0.68, 0.57 and 0.45. Early corrections within a new trend are most often deep.
Minor wave 2 may have been a quick, deep 0.57 zigzag over in just six sessions. If minor wave 3 has begun there, then at 1,437 it would reach 1.618 the length of minor wave 1.
Add a base channel (black lines) to intermediate waves (1) and (2). Draw the first trend line from the low at 1,046.27 on 3rd December, 2015, to the low labelled intermediate wave (2), then place a parallel copy on the high of intermediate wave (1). Along the way up, downwards corrections should find support at the lower edge of the base channel, if they get that low. At this stage, it looks like corrections are shallow and may not reach back down to the base channel.
Minute wave ii may not move beyond the start of minute wave i below 1,249.94.
At 1,582 intermediate wave (3) would reach 1.618 the length of intermediate wave (1).
Add a new support line, drawn here in cyan. Along the way up, if another relatively deep correction arrives, then it should find support at this line.
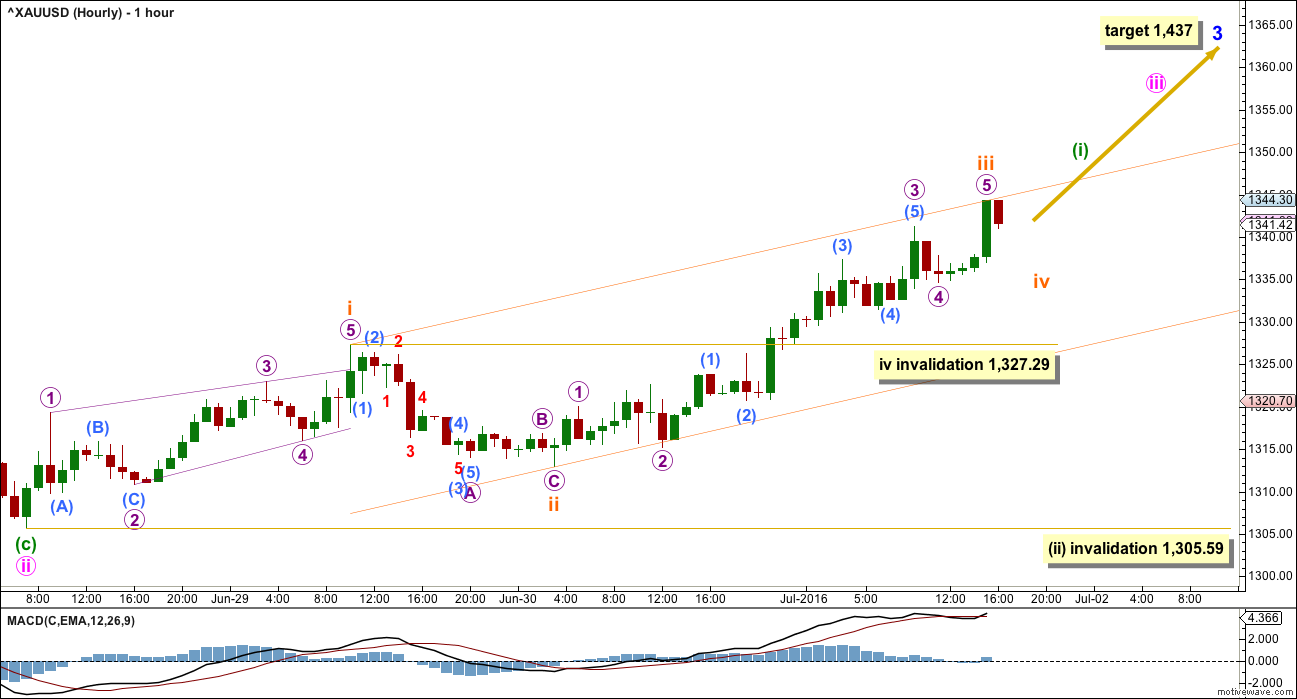
MAIN HOURLY ELLIOTT WAVE COUNT
Click chart to enlarge.
This was a second alternate in last analysis. Invalidation of the main wave count in last analysis increases the probability of this idea. Thereafter, price has continued higher.
This wave count today sees minute wave ii over as a complete zigzag ending just below the 0.382 Fibonacci ratio as a relatively shallow 0.48 correction.
If this is correct, then a third wave up may be underway. The target for minor wave 3 remains the same. At 1,437 minor wave 3 would reach 1.618 the length of minor wave 1.
If minute wave ii was very quick as labelled, then minute wave iv may be quicker still. A target is not given for minute wave iii because the following correction for minute wave iv may be too quick to show up on the daily chart.
The degree of labelling within upwards movement from the end of minute wave ii is moved down one degree today. Minute wave iii may only subdivide as an impulse. It looks like the first wave within it, minuette wave (i), is incomplete.
Within minuette wave (i), its third wave of subminuette wave iii shows an increase in momentum beyond the first wave. Subminuette wave iv may not move into subminuette wave i price territory below 1,327.29.
When minuette wave (i) is complete, then minuette wave (ii) should unfold lower and may not move beyond the start of minuette wave (i) below 1,305.59.
Draw a channel using Elliott’s first technique about this impulse unfolding upwards. Draw the first trend line from the ends of subminuette waves i to iii, then place a parallel copy on the end of subminuette wave ii. Look for corrections to find support at the lower edge while minuette wave (i) is still unfolding. If the lower edge of this channel is breached, then a deeper correction for minuette wave (ii) may be underway.
However, the lower edge of this channel may not be breached by minuette wave (ii). As a third wave begins to develop momentum, the corrections within it may begin to be more brief and shallow.
Price is still within minute wave i territory. Any long positions opened below 1,357.51 may be held for a longer time frame (if that is your trading style) because when minute wave iii is complete the following correction for minute wave iv may not move below 1,357.51. When minor wave 3 is complete, the following correction for minor wave 4 may be expected to be quite brief and shallow. Price action right up to the end of intermediate wave (3) may increase in momentum with corrections becoming more brief and shallow, until a blowoff top is seen.
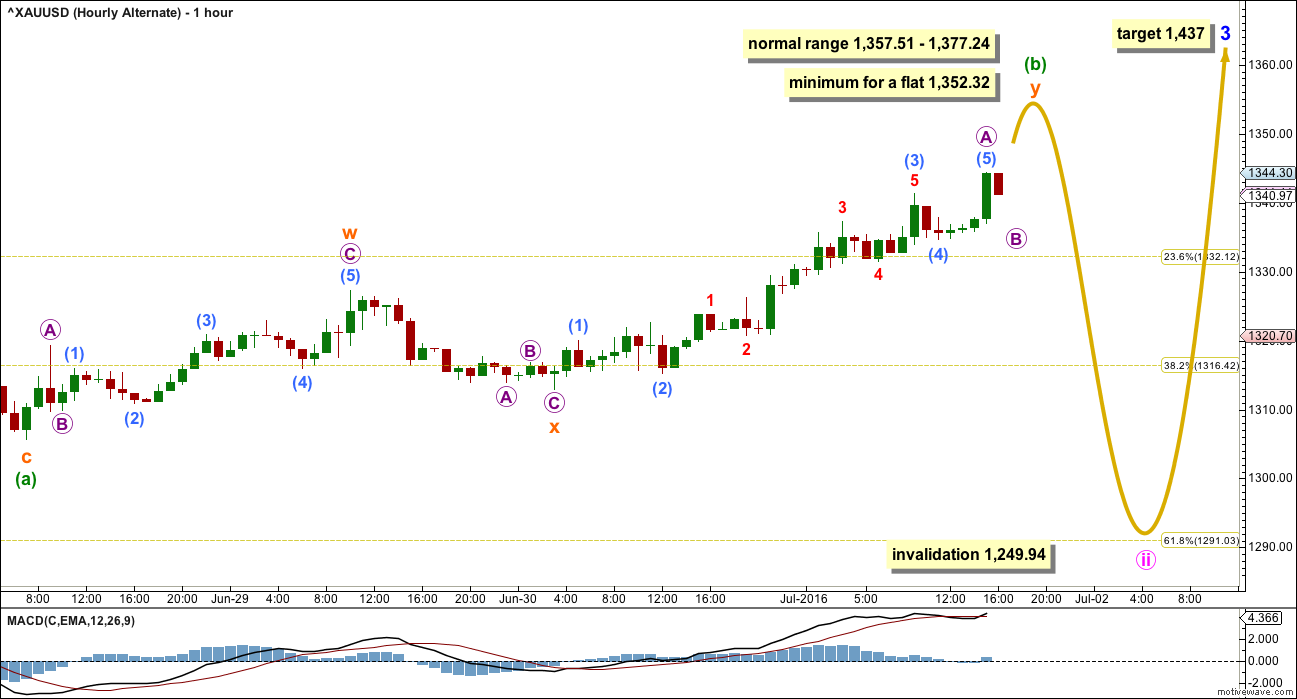
ALTERNATE HOURLY ELLIOTT WAVE COUNT
Click chart to enlarge.
Minute wave ii may still be unfolding as a flat correction.
If minute wave ii is unfolding as a flat correction, then within it minuette wave (a) is a completed three, a zigzag. Minuette wave (b) must subdivide as a three and must be a minimum 0.9 length of minuette wave (a) at 1,352.32.
Minuette wave (b) may be unfolding as a double zigzag.
The normal range for minuette wave (b) within a flat is 1 to 1.38 the length of minuette wave (a) giving a range of 1,357.51 to 1,377.24. A new high above 1,357.51 may still be part of minute wave ii as in an expanded flat, which are very common structures.
If a new high is seen, then careful attention to volume and RSI will indicate the probability of this wave count vs. the main hourly wave count.
TECHNICAL ANALYSIS
WEEKLY CHART
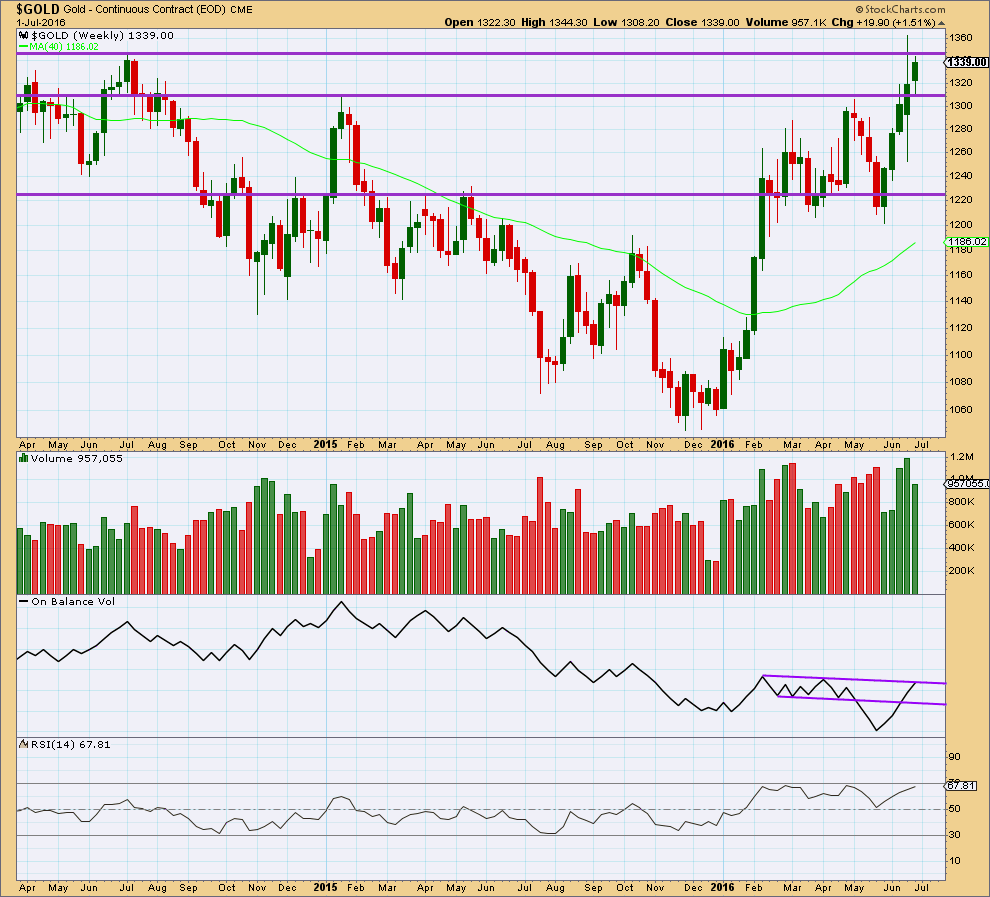
Click chart to enlarge. Chart courtesy of StockCharts.com.
From the last low at 1,201, Gold has completed four green weekly candlesticks. The first three were supported by a rise in volume but this last week was not, which is concerning for the main hourly Elliott wave count. At the end of this week, the alternate must be understood to be entirely possible.
On Balance Volume has come up to touch the upper purple line. If the alternate hourly wave count is correct, then this may initiate a reaction downwards. If so, then OBV may find support at the lower purple line.
A break above the upper purple line would be a reasonable bullish signal from OBV.
RSI at the weekly chart level also has not made a strong new high from the prior high in April, while price these last two weeks has. This indicates some weakness in price. At the end of this week, the alternate hourly Elliott wave count must be understood to be a real risk to long positions.
DAILY CHART
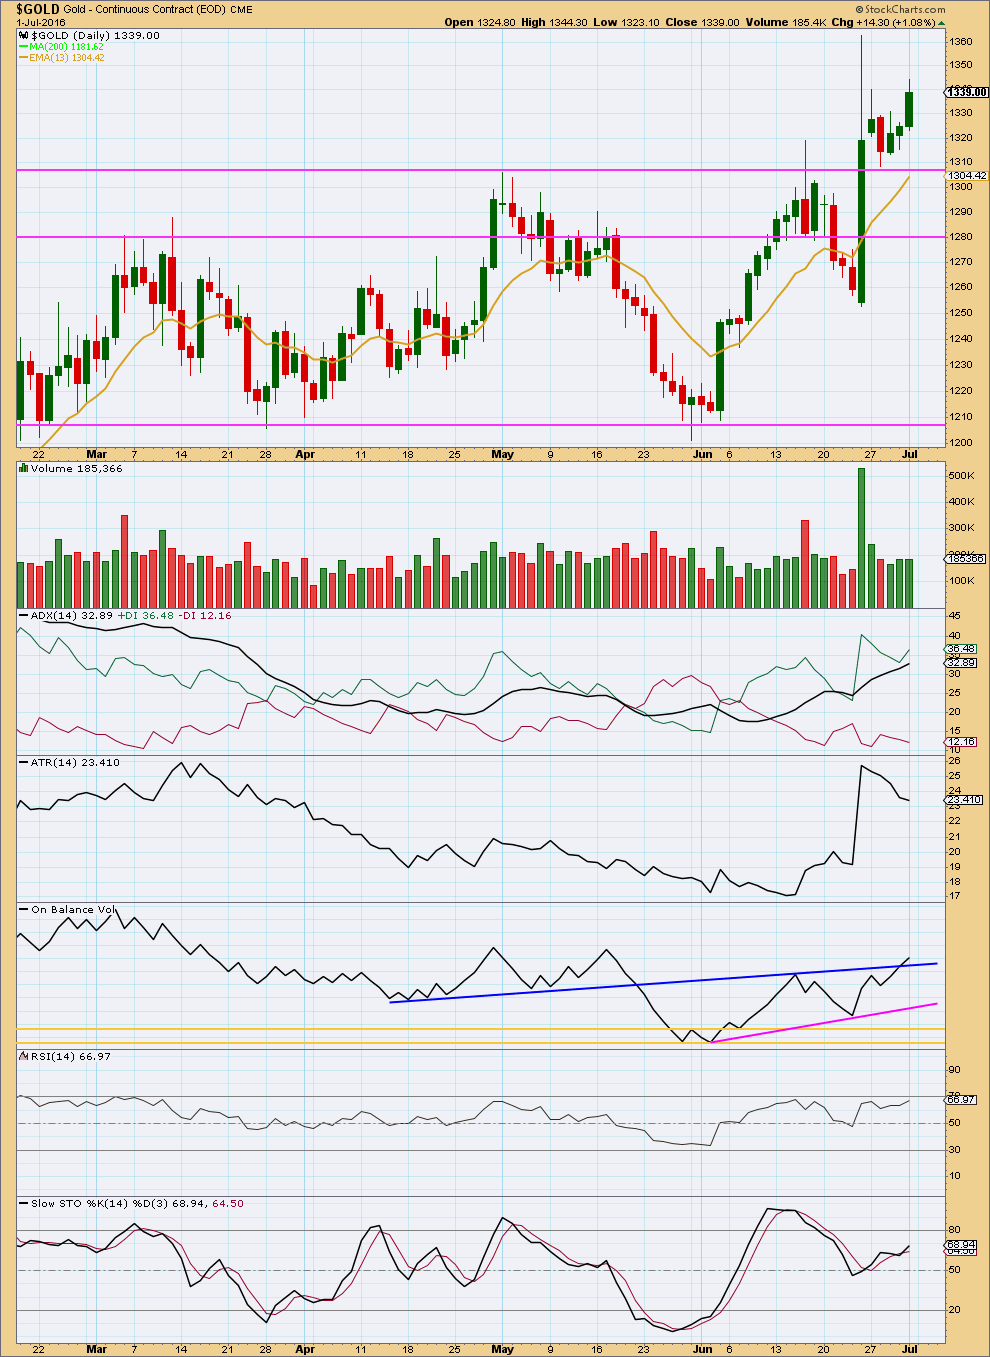
Click chart to enlarge. Chart courtesy of StockCharts.com.
Another small increase in volume for another upwards day supports the main hourly Elliott wave count over the alternate. Sometimes third waves begin somewhat slowly, only showing a clear increase in volume and strength once they near the middle. That may be happening here.
The strong upwards day of 24th of June still looks like a classic breakout from a consolidation zone, and it is strongly supported by volume. Price broke above the horizontal trend line at 1,308 and then turned down to find support. It looks like today the throwback to support is over and price may now move up and away from the line.
ADX remains clear. There is a trend and it is up.
ATR disagrees as it is declining. Some disagreement between these two indicators is to be expected at the start of a new trend. If ATR turns upwards, then they would be in agreement and more confidence in an upwards trend may be had.
If this market is trending as ADX suggests, then price may find support about the 13 day moving average.
On Balance Volume has provided a reasonably strong bullish signal at the end of this week with a break above the dark blue line. OBV often (not always) works well with trend lines, so this supports the main hourly Elliott wave count over the alternate and is one of the main reasons for that wave count being preferred at the end of this week.
RSI is not extreme. There is room for price to rise or fall. In a trending market, RSI may move into extreme territory and remain there for a little while. If RSI shows divergence at an extreme, then it is often a good indicator of a trend change. There is no reasonable divergence at this time.
Stochastics is not extreme. There is room for price to rise or fall.
This analysis is published @ 08:30 p.m. EST.
Today volume will surely be small comparitively…as US is on holiday…tought time to judge todays high
Gold peaked at 1,357.63 at 10:35 pm then dropped fast down to 1,342.89 at 11:02 pm.
As per the Hourly Alternate – A new high above 1,357.51 may still be part of minute wave ii as in an expanded flat, which are very common structures.
If a new high is seen, then careful attention to volume and RSI will indicate the probability of this wave count vs. the main hourly wave count.
The main hourly wave count is still in play above the breakout of the channel.
Is there divergence in RSI or MACD??
Trend remains up above the trend line.
No divergence to show weakness at the daily chart level with either RSI or MACD.
Volume will be light today probably though because 4th July.