The targets were not met before price turned and moved higher. Downwards targets for the correction to end were inadequate.
Summary: The correction looks like it is over. A short term target for a strong third wave up is at 1,515.
New updates to this analysis are in bold.
Last weekly chart can be found here.
Grand SuperCycle analysis is here.
DAILY ELLIOTT WAVE COUNT
There will be just one wave count today.
At this stage, this wave count has the best look and the best fit at the hourly chart level. There are no truncations and no rare structures in this wave count, so it has a reasonable probability. Yesterday’s first preferred wave count expects exactly the same direction next, but has now decreased in probability due to a reasonable sized truncation, so it will no longer be published.
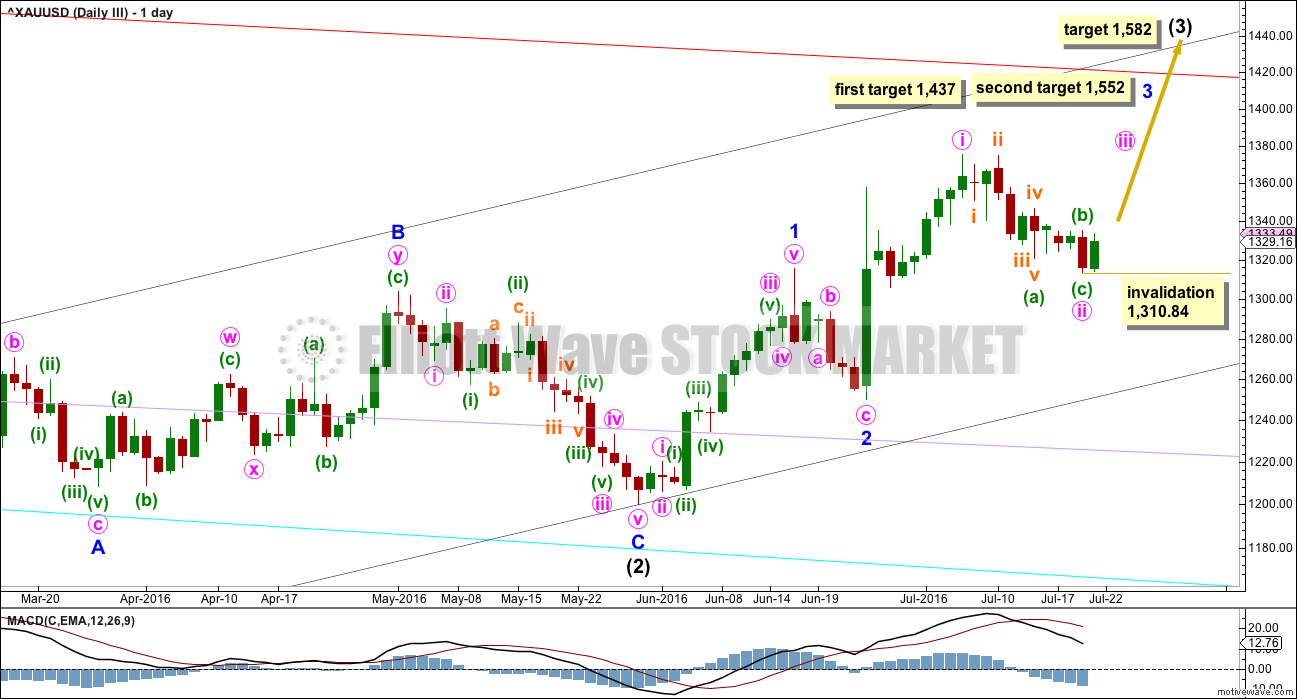
Intermediate wave (2) is a complete expanded flat correction. Price from the low labelled intermediate wave (2) has now moved too far upwards to be reasonably considered a continuation of intermediate wave (2). Intermediate wave (3) is very likely to have begun and would reach 1.618 the length of intermediate wave (1) at 1,582.
Intermediate wave (3) may only subdivide as an impulse.
So far minor waves 1 and 2 may be complete within intermediate wave (3). The middle of intermediate wave (3) may have begun and may also only subdivide as an impulse.
Within minor wave 3, the end of minute wave i is today moved up to the last high. This fits on the hourly chart although it looks odd here on the daily chart. There was a small fourth wave correction up at the end of minute wave i and it subdivides on the hourly chart as an impulse. Minute wave ii may be a complete zigzag, also subdividing as a zigzag on the hourly chart. If minute wave ii is over, it would be 0.50 the depth of minute wave i.
No second wave correction may move beyond the start of its first wave below 1,310.84 within minute wave iii.
At 1,437 minor wave 3 would reach 1.618 the length of minor wave 1. If price keeps going upwards through this first target, or if it gets there and the structure is incomplete, then the next target would be at 1,552 where minor wave 3 would reach 2.618 the length of minor wave 1.
HOURLY ELLIOTT WAVE COUNT
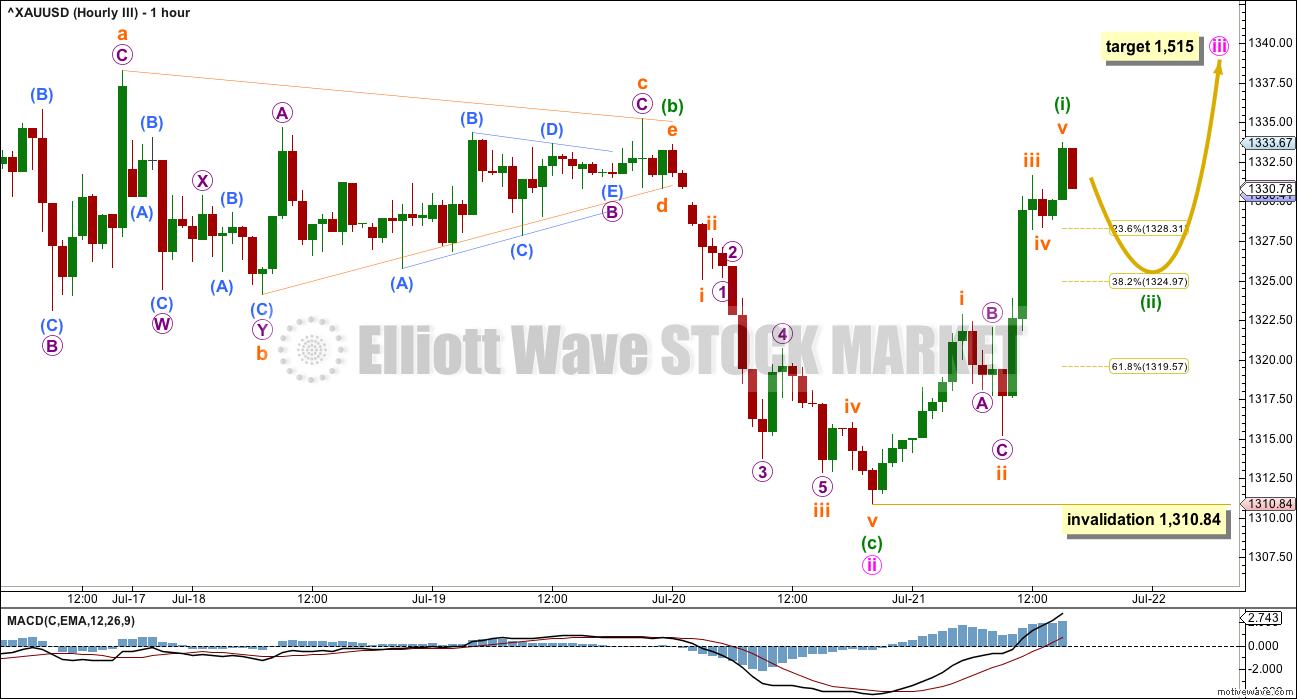
The triangle may have been a B wave, not a fourth wave. Because of the spike labelled subminuette wave c within the triangle, it cannot end there. The triangle may only have ended at the high of 1,333.60. With price since having made a slight new high above this point, upwards movement may not be a second wave correction within minuette wave (c), so minuette wave (c) has to be over.
So far within the new upwards movement a five wave structure upwards looks to be complete. A three wave correction downwards would be likely to follow it.
With price now close to the middle of a third wave at three degrees, the strong upwards pull may force minuette wave (ii) to be more shallow than a second wave is normally. The 0.382 Fibonacci ratio may be a reasonable expectation in this instance for it to end. If price moves below that point, then the 0.618 Fibonacci ratio would be the next reasonable expectation.
At 1,515 minute wave iii would reach 1.618 the length of minute wave i. This target fits only with the second higher target for minor wave 3 on the daily chart.
Minute wave iii should have support from rising volume and it should exhibit stronger momentum than minute wave i.
Minor wave 1 lasted a Fibonacci thirteen days. Minute wave i lasted a Fibonacci eight days. Minute wave iii may be expected to last longer, about a Fibonacci thirteen or maybe twenty one days.
TECHNICAL ANALYSIS
WEEKLY CHART
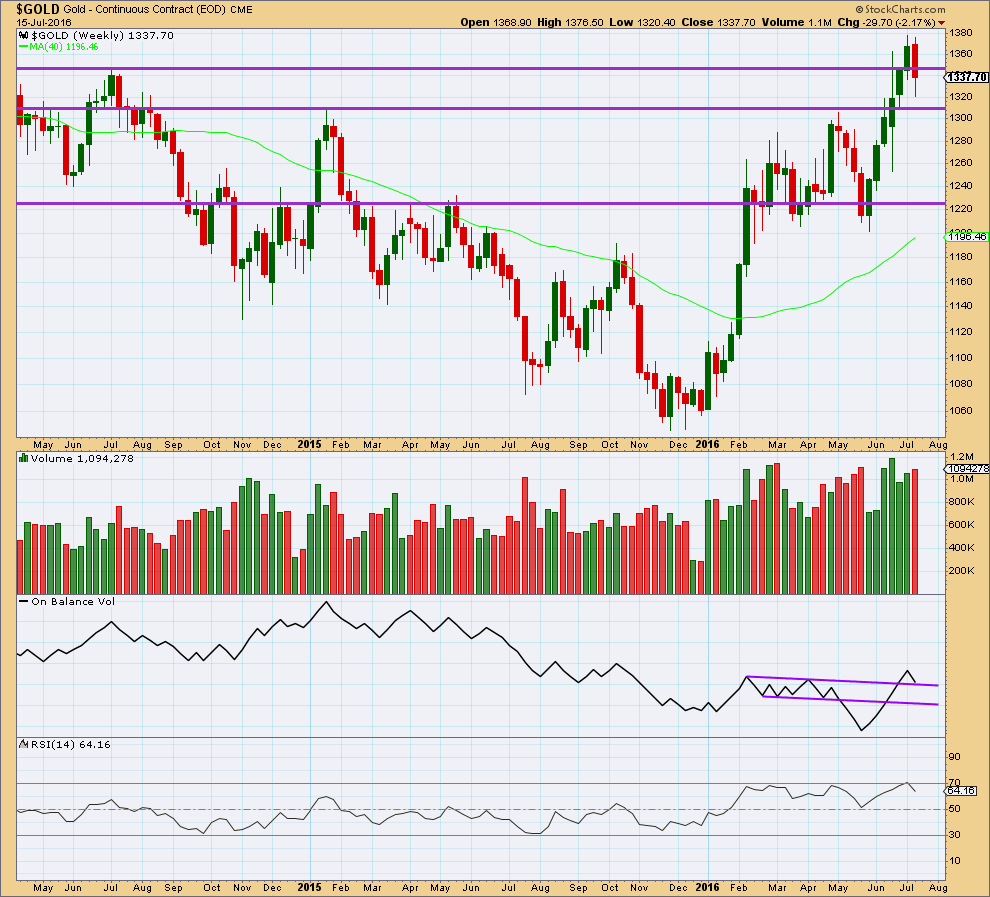
Last weekly candlestick completes a bearish engulfing candlestick pattern with higher volume. This is a strong bearish signal and strongly supports the wave count in expecting more downwards movement. If targets are wrong, they may be too high.
On Balance Volume has come down to find support at the upper purple trend line. This may offer some support. If OBV moves up and away from this line this week, it would be a reasonable bullish signal. A break below this line would be a reasonable bearish signal. The next line to offer support is not too far away but would still allow for a reasonable fall in price.
DAILY CHART
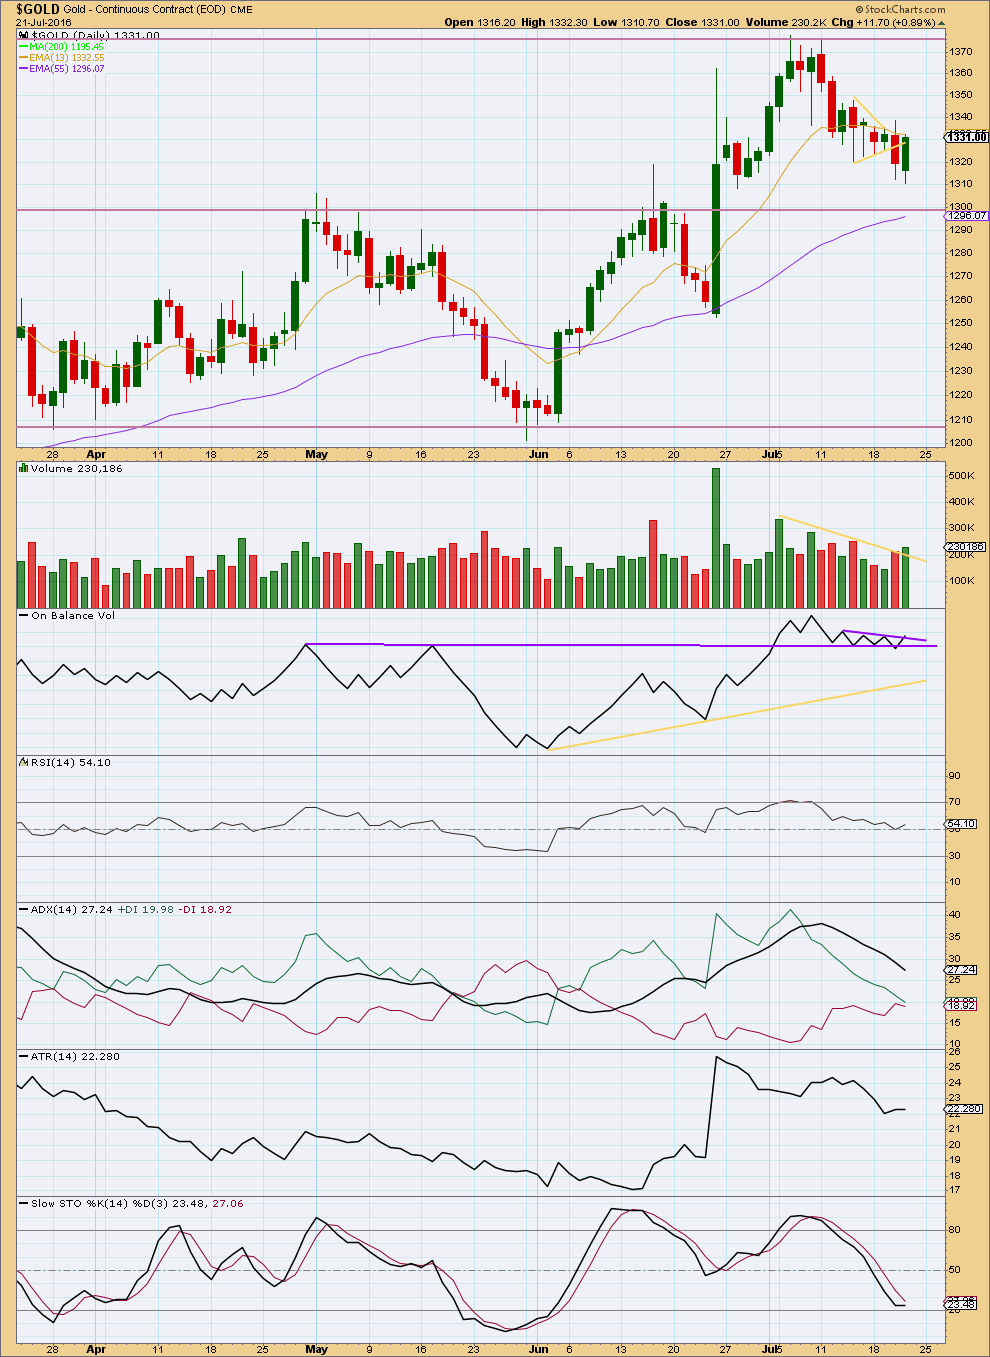
An upwards day comes with an increase in volume for the first time in several days. There was support today for the rise in price, so it is not suspicious. This supports the Elliott wave count.
Price did not reach down to support at the horizontal line at 1,300 and Stochastics did not quite manage to reach oversold, but it still looks like the correction is over, falling a little short of expectations.
On Balance Volume may be beginning to break above the short purple line. One more day of upwards movement would make this break clearer. That would provide a weak bullish signal from OBV.
ADX has returned from extreme. It is now below 30. There is plenty of room for price to rise again.
ADX today is still declining, indicating the market is not trending. ATR is still overall flat to declining, in agreement with ADX. The market has been correcting now for 11 days and both of these indicators are based on 14 day averages, so they are lagging. If the black ADX line turns upwards and / or ATR turns upwards, then a resumption of the upwards trend would be indicated.
RSI is neutral. There is plenty of room for price to rise or fall from here.
Overall, with volume and OBV both slightly bullish, it looks reasonably likely that the correction has ended and the upwards trend may now resume.
This analysis is published @ 05:38 p.m. EST.


Damn Manipulators (Gold and miners) – Avi Gilburt EW
Thursday July 21, 2016 16:14
http://www.kitco.com/commentaries/2016-07-21/Damn-Manipulators.html
EW Charts on GDX, GLD & YI (Silver) for Wednesday July 20th 2016
EW charts included just click on the link at the end of the ‘Damn Manipulators’ article.
Thanks, Richard!
Hi Lara,
In a corrective wave can wave a and c be very different lengths like in minuette II below? In what situations should a equal c?
They can be different lengths, yes.
The most common ratio is equality. But what is most common and what is possible in the range of possibilities is not the same thing.
Often TBH they don’t have a ratio to each other. I find ratios between actionary waves of impulses (1, 3 and 5) more reliable than ratios between A and C waves.
The 0.618 Fibonacci ratio was reached. Downwards movement subdivides best as a zigzag.
A small channel about minuette (ii) is breached.
The expectation is now for Gold to move strongly up next week.
I need to adjust my end of minuette (ii) to the next low to the right…
I concur.
I estimated minuette ii to end about 1317 – 1315.
The drop is not over yet.
Thanks Alan, I’ll trade that with NUGT next week if it drops to 1317 – 1315.
Simple observation, but in my 12 yrs. of trading the POG will often settle down into options expiration (which is next Tuesday), and the fireworks will probably start with Fed and BOJ announcements next week.
There might be a change of character in the markets right now, with all risk assets going up. I’d like to see the Euro get stronger and gold go up in USD terms…this has largely been happening already (e.g. gold holding its gains while the equity markets strengthen).
Seems like a lot of this would be predicated on a neutral Fed and dovish BOJ. Anyone remember the Yen carry trade from ’05-’07? Basically, the yen served as the risk currency of the world – borrow yen @ 0%, buy everything else, then make sure to get out before everyone else. Gold did extremely well in that environment. The BOE and ECB were both fairly neutral this past week, so that’s where the pop in the Euro might come from.
Lara
Wave count suggests for usd being bullish simulteneously with gold…than if im right the relation between usd and gold will prove that one count must be wrong..isint it..??..
Or can they both move in a same direction..??..
The nxt event for both is fomc desicion…and as the last months suggests,it acts like a sharp and strong trigger on the gold and dollar index..how personally you look forward to handle this scenario..??..
Thank u
As gold bottom in feb $ index was arnd 101 it came down to 92.5 and gold rallied…now as usd is again showing power is it a point of concern for gold bulls..??..
Just curious abt it..
I don’t have a USD count and haven’t published one for a while. So I don’t know where you get my bullishness on USD from?
Scratch that, I do have a USD count and haven’t looked at it nor published it in a while.
I see USD in a big intermediate (4). It could certainly move sideways while Gold moves up.
While they mostly move in synch in opposite directions (because the Gold data I’m analysing is nominated in USD) their highs and lows don’t always match perfectly.
As for news releases, I completely ignore them. Not popular I know, but I focus on technicals not fundamentals.
Sentiment Speaks: What Is In Store For Gold Jul. 22, 2016 9:18 AM ET
Avi Gilburt EW
http://seekingalpha.com/article/3990603-sentiment-speaks-store-gold
Avi new article today- While GDX remains over 27.70 I will “sit tight” and look higher. Our next higher minimum target 33.50 for GDX.
“So, as long as silver remains over 19 and GLD remains over 124.50, and GDX remains over 27.70 I will continue to “sit tight” and look higher. A break of those levels will have me reconsider my expectations. Our next higher minimum targets are 137 for GLD, 22.15 for silver, and 33.50 for GDX. Should all those levels break as support, I will have to adjust my larger degree wave structures, but the likelihood that a lower low may be seen is estimated to be between 25-30% in my humble opinion.”
Wow Richard. That’s awesome info from Avi. Thank you for posting it– it gives me a sigh of relief that I made the right decision, with a GDX new entry, sitting tight for higher prices 🙂
dsprospering
Yes it is reassuring. Avi Gilburt his EW charts are inferior to Lara’s however he after trading gold miners for decades and having a huge website of his own with many EW experts providing advice and he is the boss and has great insight into general direction for miners. I’ve been following him for years. Together with Lara’s refined details it can help. He may not get the day to day EW details but he gets the main directions and more general turning points for gold and miners. If you subscribe his in house advisors do tons of multiple time frames charts very over whelming.
I’d say that buying GDX since the Wednesday gold low is very likely a good buy and hold.
Thanks, good to know other perspectives.
Especially if they have a good track record making a ton of profits with miners and are heavily invested in them right now.
Go gold…show ur power
Gold low at 1319.72 at 9:50 am and Lara’s lower target 1319.57 then and at 9:30 open times to buy GDX and NUGT so far today.
Gold Miners seasonality is strong through September, might be time to buy and hold for a while.
When I searched for seasonality charts a while back I could only find data up to the last couple of years. 2012/2013 I think. Have you had any luck locating say a chart for the last 4-5 years? I realize those years are the bear market gold years. Thought it interesting no one is posting those. This is what I come up with on stockcharts.com
Nice chart. Even in the last 5 bear years, miners were always up in August. I haven’t found any other recently updated charts for seasonality.
I’m seeing divergence on smaller time frames (I’m on my mobile though),can anyone else confirm?
I don’t watch divergence on smaller time frames, I find it somewhat unreliable.
Dreamer,
Thank you for your efforts in creating these magnificent charts!
I am new to Investing .com. When you have a few moments, could you give me a ‘clue’ as to how you are able to ‘hide’ pattern lines after you draw an Investing.com’s Elliott Wave pattern on their charts using their EW pattern tools. I find the ‘pattern lines’ created by drawing with their EW patterns distracting.
I’ve noted that there is a Chart Manual @ Bottom of each ‘Streaming’ chart. Is there another guide I am missing that goes into more depth about Trading View program, or is this the extent of guidance Investing.com offers?
I’d appreciate your comments as you can.
Thank you….Melanie
Hi Melanie, after you draw an EW pattern, if you click anywhere on the pattern, you will activate the toolbar. When you see the toolbar for the EW pattern, click on the gear symbol. Uncheck the “show wave” box to hide the wave lines. Also, this is where you choose the wave degree and color. If you match the wave degrees and colors to Lara’s, it’s easier for everyone to understand.
Their manual doesn’t go into much detail. Just experiment and I’m sure you’ll pick it up quickly. Let me know if I can help further. I look forward to seeing some of your charts.
Thank you ….Dreamer. I am practicing.
Great weekend to everyone.
About time!
Hi guys…
Yaa it seems that gold and silver are ready to rock again…if this is 3rd begining wave the fomc result will surely give this wave a curved look… :)..
Thanx lara for guiding us in this correction to earn some quick 20$ gain to the downside…
Gold silver and also copper all metals are ready to ride again…goodluck
Thanks James.
Yes, good luck everybody. Let’s see how this one turns out.
Remember, two golden rules:
1. ALWAYS use a stop loss. I’m setting mine just below 1,310.84.
2. Invest only 3-5% of equity on any one trade. Don’t get greedy!
That way when I’m wrong you won’t lose the house.
Trading after all is an exercise in probability. Risk management is the most important aspect by far.
Yes agree lara…
Ohh i think ther are two james on the board.. 🙂
Gudluck
Uh oh…
Shall I change the name for one of you? Otherwise this may get confusing…
Who wants their name changed?
Change mine lara frm james to Jimmy ..thk u
GDX
Thanks, Dreamer!
Thanks for the support. Do you trade miners?
Hi Dreamer, yup, I like to swing trade miners. I rely on classic TA, but I’d like to use Lara’s wave analysis to confirm gold’s possible directions. Thanks for your additional supports to show us the GDX chart. 🙂
Sounds good. Swing trading miners is my style also.
Thank you very much Dreamer! Looks good.
An interesting island bottom there on GDX. The gap may offer some resistance?
The wave count looks good.
Thanks for making sure my count stays on track! ?
Dreamer, awesome work you’ve done here, and yesterday’s post as well. Really appreciate the posts and your working with Lara to keep us all in the know. Keep up the good work! 🙂
Thanks for the support!