
Upwards movement was expected. This is not what happened.
Price moved lower but remains above the invalidation point on the hourly Elliott wave chart.
Summary: The outlook is for a third wave up to 1,515 while price remains above 1,310.84. A new low below 1,310.84 would invalidate the main wave count, so at that stage expect downwards movement to continue to about 1,296 before it is done. Both wave counts still see this as a counter trend correction. The alternate has support today from volume and On Balance Volume, so the risk to long positions that the alternate illustrates should be taken seriously today.
New updates to this analysis are in bold.
Grand SuperCycle analysis is here.
Last weekly chart is here.
DAILY ELLIOTT WAVE COUNT
Click chart to enlarge.
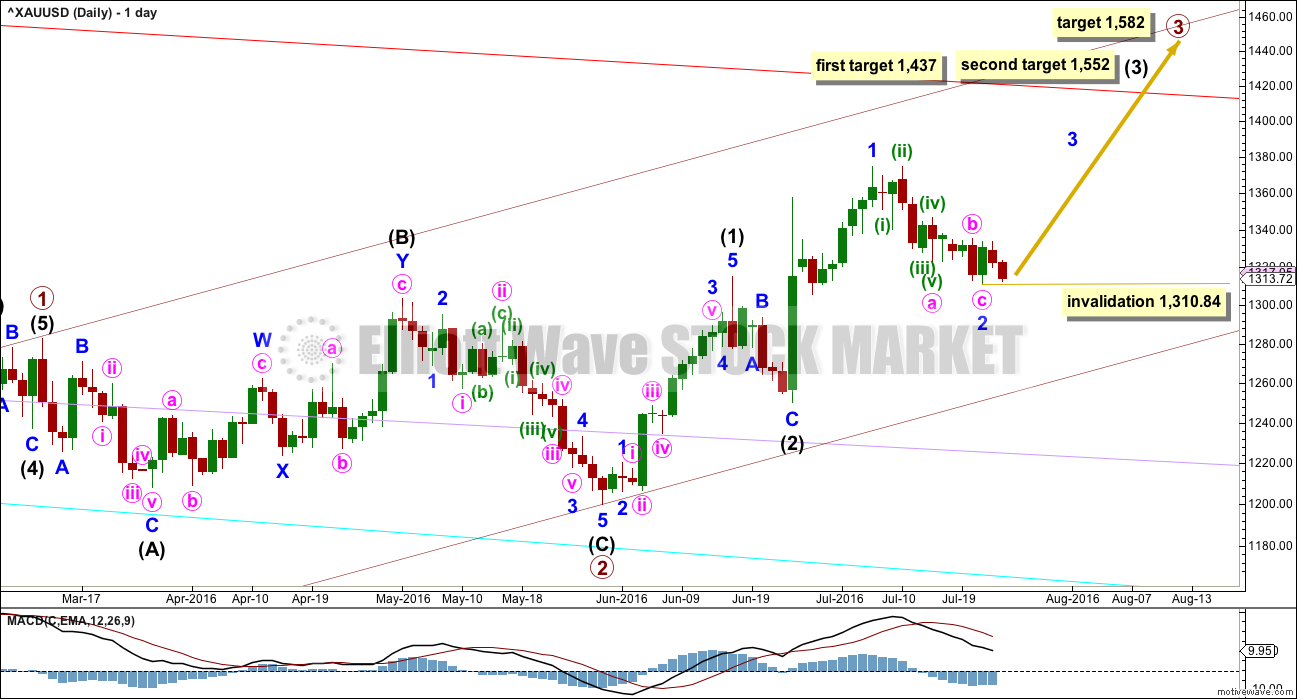
Primary wave 2 is a complete expanded flat correction. Price from the low labelled primary wave 2 has now moved too far upwards to be reasonably considered a continuation of primary wave 2. Primary wave 3 is very likely to have begun and would reach 1.618 the length of primary wave 1 at 1,582.
Primary wave 3 may only subdivide as an impulse.
So far intermediate waves (1) and (2) may be complete within primary wave 3. The middle of primary wave 3 may have begun and may also only subdivide as an impulse.
Within intermediate wave (3), the end of minor wave 1 is moved up to the last high. This fits on the hourly chart although it looks odd here on the daily chart. There was a small fourth wave correction up at the end of minor wave 1 and it subdivides on the hourly chart as an impulse. Minor wave 2 may be a complete zigzag, also subdividing as a zigzag on the hourly chart. If minor wave 2 is over, it would be 0.50 the depth of minute wave i.
No second wave correction may move beyond the start of its first wave below 1,310.84 within minor wave 3.
At 1,437 intermediate wave (3) would reach 1.618 the length of intermediate wave (1). If price keeps going upwards through this first target, or if it gets there and the structure is incomplete, then the next target would be at 1,552 where intermediate wave (3) would reach 2.618 the length of intermediate wave (1).
HOURLY ELLIOTT WAVE COUNT
Click chart to enlarge.
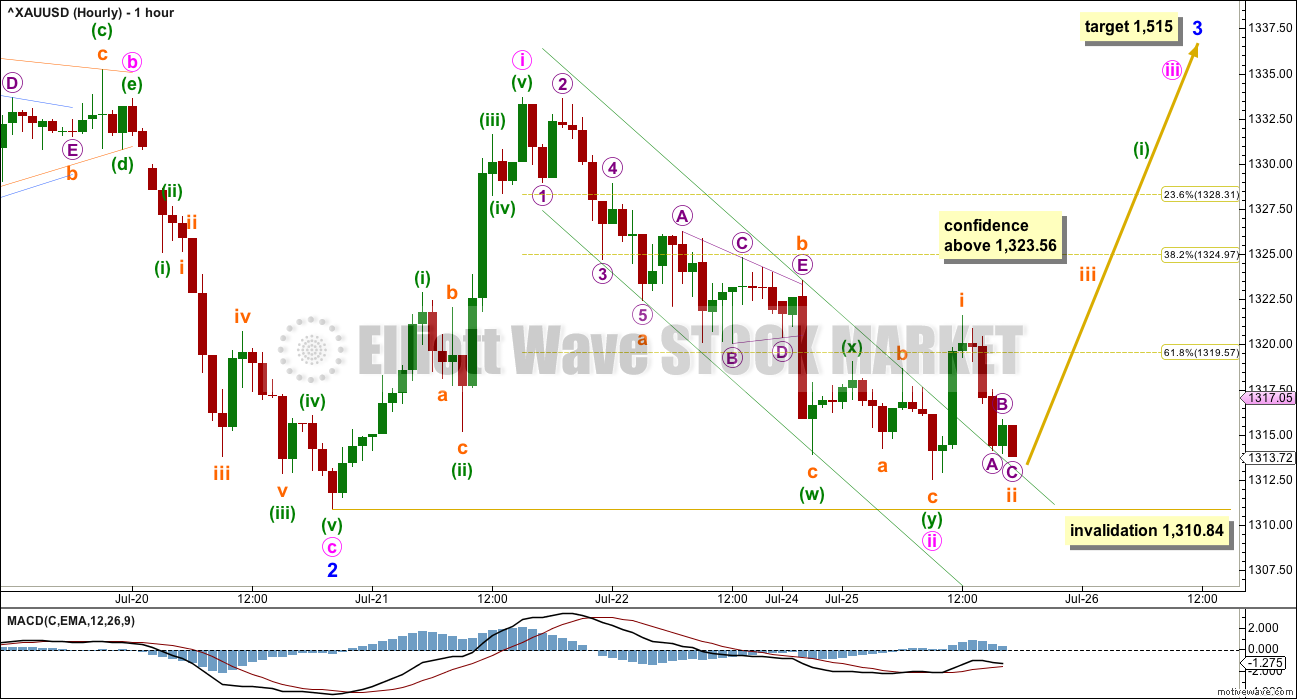
Minute wave ii moved even lower to so far be a very deep 0.93 correction of minute wave i. So far it subdivides well as a double zigzag although the second zigzag in the double has barely deepened the correction. It does fit neatly within a channel.
If minute wave ii continues any further, then it may not move beyond the start of minute wave i below 1,310.84. If this main wave count is invalidated, then the alternate should be used.
At 1,515 minor wave 3 would reach 1.618 the length of minute wave i. This target fits only with the second higher target for intermediate wave (3) on the daily chart.
Minor wave 3should have support from rising volume and it should exhibit stronger momentum than minor wave 1.
Intermediate wave (1) lasted a Fibonacci thirteen days. Minor wave 1 lasted a Fibonacci eight days. Minor wave 3 may be expected to last longer, about a Fibonacci thirteen or maybe twenty one days.
ALTERNATE DAILY ELLIOTT WAVE COUNT
Click chart to enlarge.
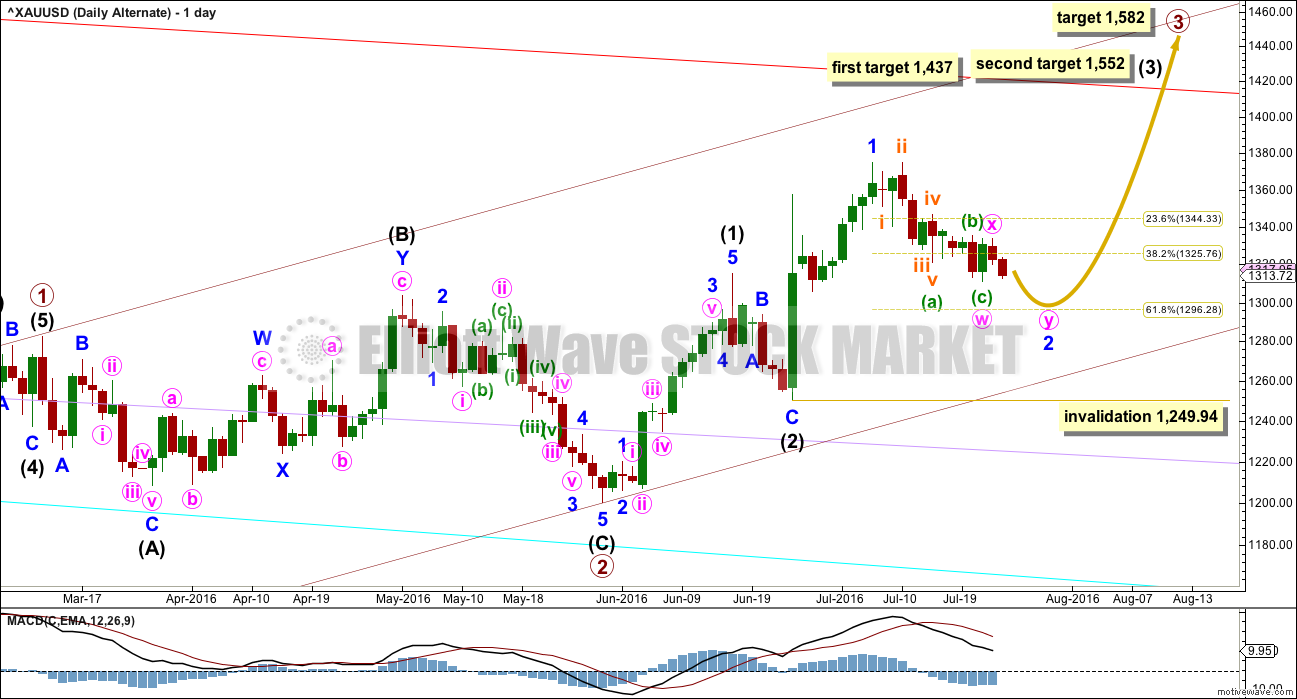
It is possible that minor wave 2 is not over and is continuing lower as a double zigzag.
A second zigzag in a double may be needed to deepen the correction to the 0.618 Fibonacci ratio of minor wave 1 at 1,296.
Minor wave 2 may not move beyond the start of minor wave 1 below 1,249.94. If it gets down that low, it should find very strong support at the lower edge of the maroon base channel drawn here about primary waves 1 and 2.
This wave count still has a lower probability than the main wave count due to proportion. Intermediate wave (2) was a quick zigzag lasting six sessions. So far minor wave 2, one degree lower, has lasted thirteen sessions and would be incomplete. A correction of a lower degree may be a little more time consuming, but for it to be over twice the duration and incomplete begins to give the wave count the wrong look.
It is the proportions between corrections which is a major factor in the right look of a wave count.
However, not all waves look perfect and alternatives should be considered.
ALTERNATE HOURLY ELLIOTT WAVE COUNT
Click chart to enlarge.
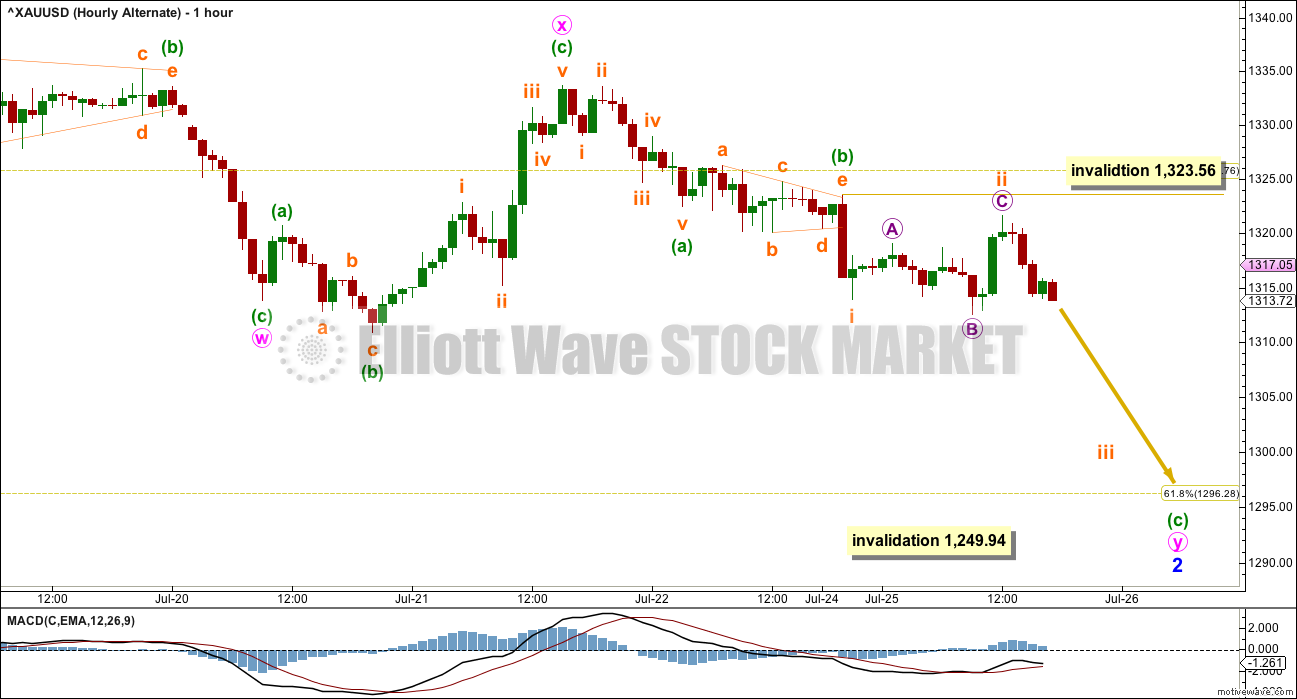
If minor wave 2 is continuing lower, then it may be as a double zigzag.
The second zigzag in the double may have minuette waves (a) and (b) complete. Minuette wave (c) may now be ready to move strongly lower as a small third wave of subminuette wave iii unfolds.
The correction of subminuette wave ii fits well as an expanded flat within minuette wave (c). If subminuette wave ii continues further sideways, it may not move beyond the start of subminuette wave i above 1,323.56.
Invalidation of this alternate would add some confidence to the main wave count.
TECHNICAL ANALYSIS
WEEKLY CHART
Click chart to enlarge.
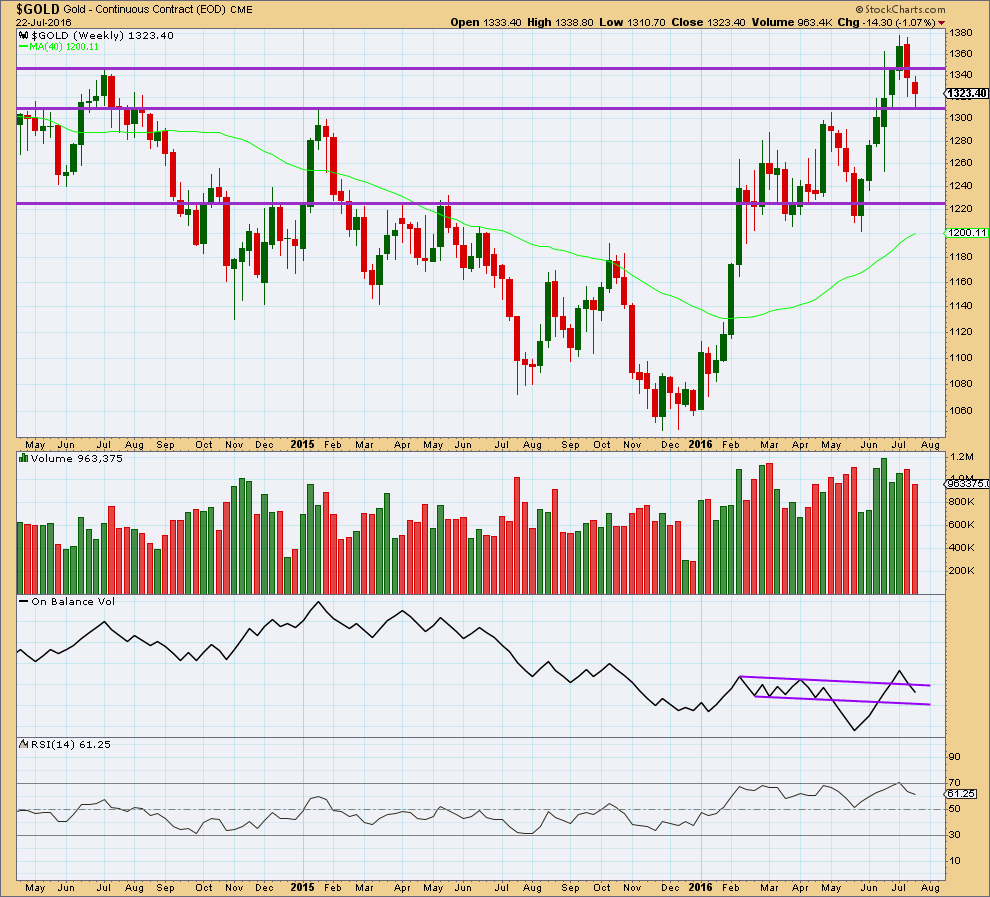
The week before last week completed a bearish engulfing candlestick pattern that was supported by an increase in volume. This bearish reversal pattern indicated a trend change from up to either down or sideways.
This weekly candlestick completes another red candlestick with lighter volume than last week. The fall in price last week was not supported by volume. Volume last week was lightest for six weeks, so this decline is significant. This last downwards week looks like a countertrend pullback within a larger upwards trend. The prior rise in price was supported by volume.
The reversal implications of the bearish engulfing candlestick pattern may now be fulfilled. A reversal pattern only indicates a trend change and gives no indication of how far or for how long the next trend should be. It also does not mean a change from up to down or down to up but may also mean a change from up to sideways or down to sideways.
Price may be finding support at the horizontal trend line about 1,310. Two weeks in a row with longer tails on these candlesticks is slightly bullish.
On Balance Volume is not working with the upper purple line, because it broke above the line giving a bullish signal only to turn and break below the line. The lower line so far should provide support if OBV moves lower.
DAILY CHART
Click chart to enlarge.
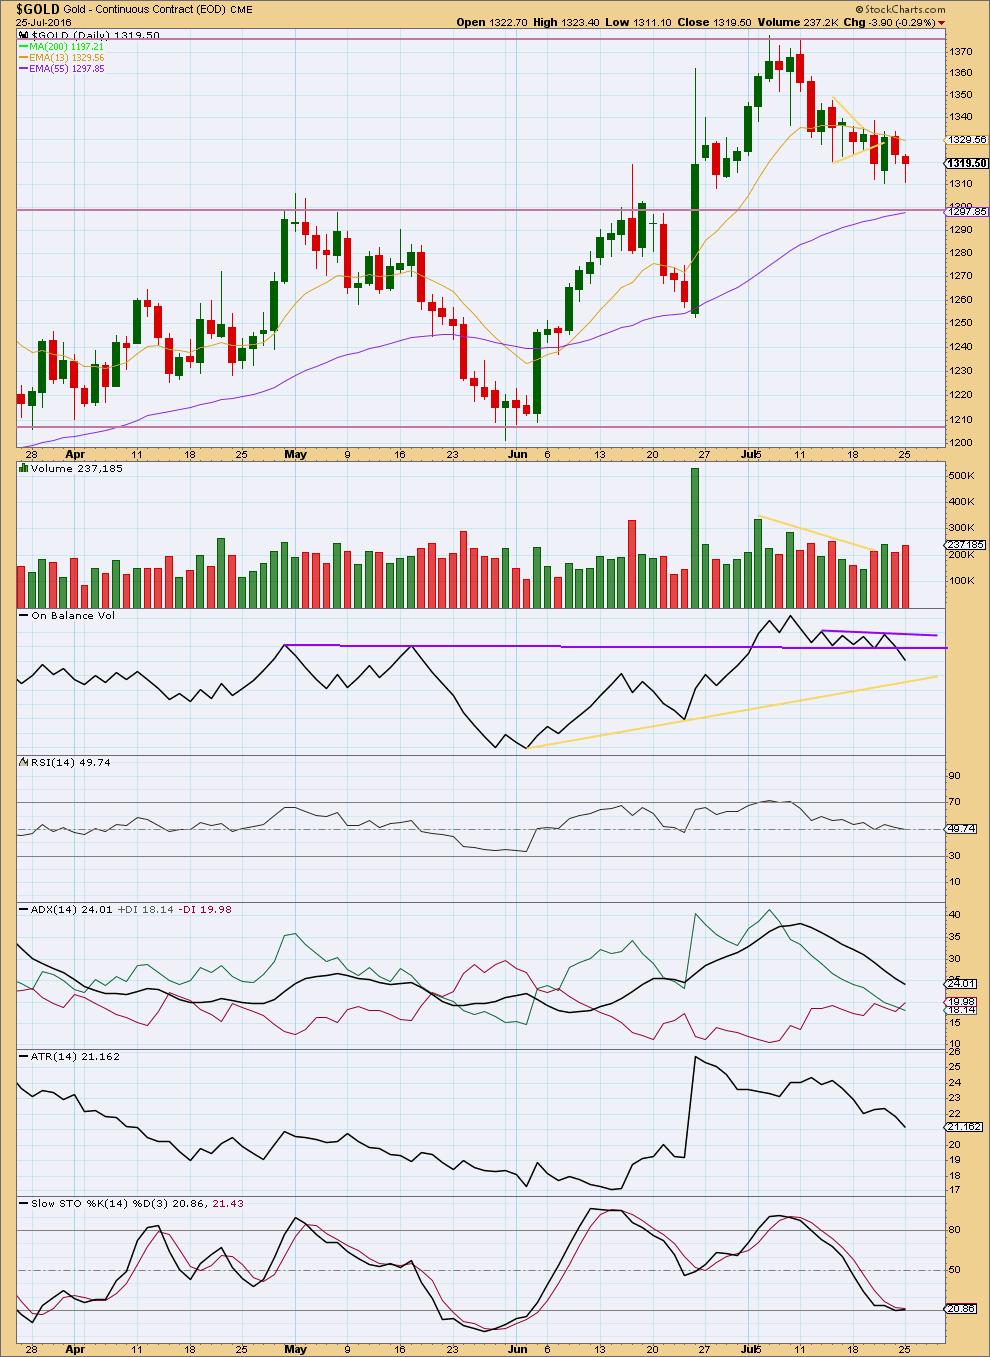
Monday’s session completes a small hammer candlestick pattern. When this pattern occurs at a low after a decline, then it is a bullish reversal signal.
Volume for Monday’s session is stronger than the prior downwards day of Friday. There was some support from volume for the fall in price this Monday. However, volume is still lighter than the last upwards day of Thursday, so there is still more support for a rise in price than a fall in price at this stage. This slightly supports the main wave count over the alternate, but the small increase in volume today is still concerning for the main wave count.
On Balance Volume is today giving a strong bearish signal with a break below the lower purple line. This line has strong technical significance because is long held, almost horizontal and repeatedly tested. This bearish signal strongly supports the alternate wave count over the main, so it should be taken very seriously.
A signal from OBV often precedes a movement from price, but the signal does not indicate how far that movement from price may go. Other indicators point to this downwards movement being close to completion as a counter trend pullback, so at this stage that should still be considered as most likely.
ADX today has indicated a possible trend change from up to down, but does not yet indicate a downwards trend is in place. ADX is still declining, indicating the market is not trending.
ATR still agrees with ADX. This downwards movement should be expected to be a counter trend pullback.
Stochastics is not quite yet oversold and price may yet move a little lower to find support before this pullback is done. That may be about 1,300.
This analysis is published @ 06:57 p.m. EST.
Tomorrow’s FOMC announcement (2pm ET) should be able to affect gold’s price. Anyways, I follow price only, but I also try to avoid to trade during FOMC announcement. I think they called it event risk.
No guts…no glory
The bigger the risk…the bigger the reward
or something to that effect…..
Hehe…. I guess everyone’s risk appetite is different. I used to trade earnings when I started to learn trading, but not anymore…lol
Yesterday GDX low $27.45 was the lowest price since June 30th, 2016.
July 11th $30.73 highest price since August 26, 2013
NUGT July 6th high at 169.83 down to 117.10 July 25th NUGT low Monday down $52.73 lowest price since June 29th low 116.67
A couple of months ago, when folks here were worried about the large net short position of Commercials in the CoT reports, the situation is now much worse. Yet gold continues to defy the predictions of an imminent collapse, albeit, has been subdued of late.
The following short report makes for interesting reading, and supports my assertion of 2 months ago (and implicitly Lara’s current wave count) that very occasionally the Commercials blink first.
http://www.gata.org/files/MylchreestReport-07-25-2016.pdf
My position on the COT is since miners went bullish mid January that the COT report is best ignored except at extremes. It’s like DUST those DUST investors rarely make any profits since mid January and left with pennies on the dollar. They are betting against the trend and much harder to make profitable trades that way.
Educational read for me. Thanks for sharing this.
Great article. Thanks for posting. Since gold is yet to go parabolic since the up move in January, maybe the Commercials will blink soon.
Looks like the alternate hourly has been invalidated with a move above 1,323.56.
YES !!
Another good post by SurfCity on gold cycles. He thinks it’s too early in the current cycle for a top.
https://goldtadise.com/?p=376779
Post on USD by SurfCity. Looks like USD is at resistance. From a gold seasonality standpoint, a move back down to the blue line for USD over the next two months would make sense and could help propel gold to the Intermediate 3 target.
https://goldtadise.com/?p=376768
Lara, does this still look like the most probable count?
If your gold alternate plays out, the daily GDX count may invalidate. What would you suggest at that point? Change the current Minor 4 into another second wave (Minute wave 2)? That should work, but Minute 2 would look out of proportion compared with Minor 2. Thoughts?
I agree with your conclusion on the chart. Minor 4 looks to be over, but it is relatively deep now.
I have it still within a channel for GDX… just. I have the invalidation point at the same place.
If the invalidation point is breached then yes, my go to would be to move the degree of labelling within the correction down one degree.
But then as you rightly point out there is a problem of proportion. As there is for the same idea with Gold.
FWIW this is my updated GDX chart. No different to yours.
Lara, thank you for the feedback and chart update. Very helpful. Let’s hope the GDX channel holds. When you add in todays candle, it appears to have stopped right on or just above the channel support.
Always a good sign 🙂