
Upwards movement was expected.
A new high above 1,323.56 adds some confidence to the main Elliott wave count.
Summary: The trend is up. A counter trend pullback looks most likely complete. Further confidence in this outlook would come with a new high above 1,333.66. The target remains at 1,582. If price makes a new low below 1,312.15, then a target for a deeper pullback to end would be at 1,296. Caution is strongly advised here: Volume is bearish and warns this pullback may not be over. If holding long positions here, it is essential that no more than 3-5% of equity is risked and stops are used.
New updates to this analysis are in bold.
Grand SuperCycle analysis is here.
Last weekly chart is here.
DAILY ELLIOTT WAVE COUNT
Click chart to enlarge.
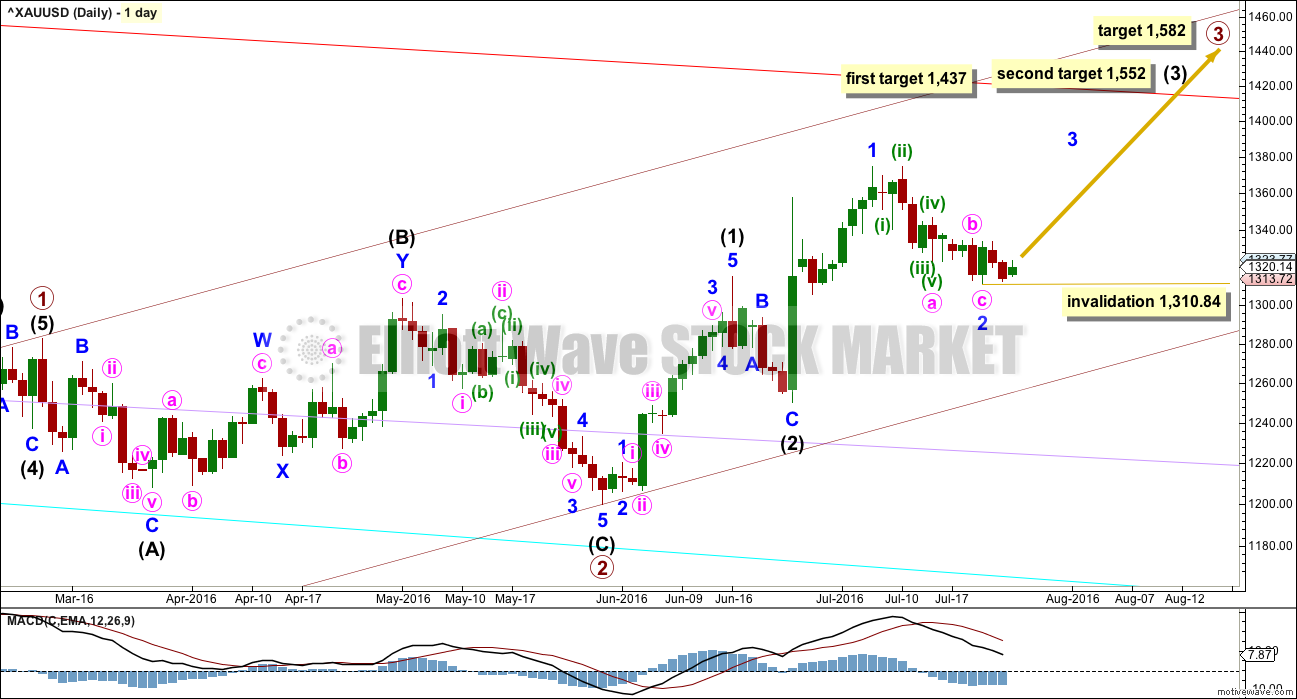
Primary wave 2 is a complete expanded flat correction. Price from the low labelled primary wave 2 has now moved too far upwards to be reasonably considered a continuation of primary wave 2. Primary wave 3 is very likely to have begun and would reach 1.618 the length of primary wave 1 at 1,582.
Primary wave 3 may only subdivide as an impulse.
So far intermediate waves (1) and (2) may be complete within primary wave 3. The middle of primary wave 3 may have begun and may also only subdivide as an impulse.
Within intermediate wave (3), the end of minor wave 1 is moved up to the last high. This fits on the hourly chart although it looks odd here on the daily chart. There was a small fourth wave correction up at the end of minor wave 1 and it subdivides on the hourly chart as an impulse. Minor wave 2 may be a complete zigzag, also subdividing as a zigzag on the hourly chart. If minor wave 2 is over, it would be 0.50 the depth of minute wave i.
No second wave correction may move beyond the start of its first wave below 1,310.84 within minor wave 3.
At 1,437 intermediate wave (3) would reach 1.618 the length of intermediate wave (1). If price keeps going upwards through this first target, or if it gets there and the structure is incomplete, then the next target would be at 1,552 where intermediate wave (3) would reach 2.618 the length of intermediate wave (1).
HOURLY ELLIOTT WAVE COUNT
Click chart to enlarge.
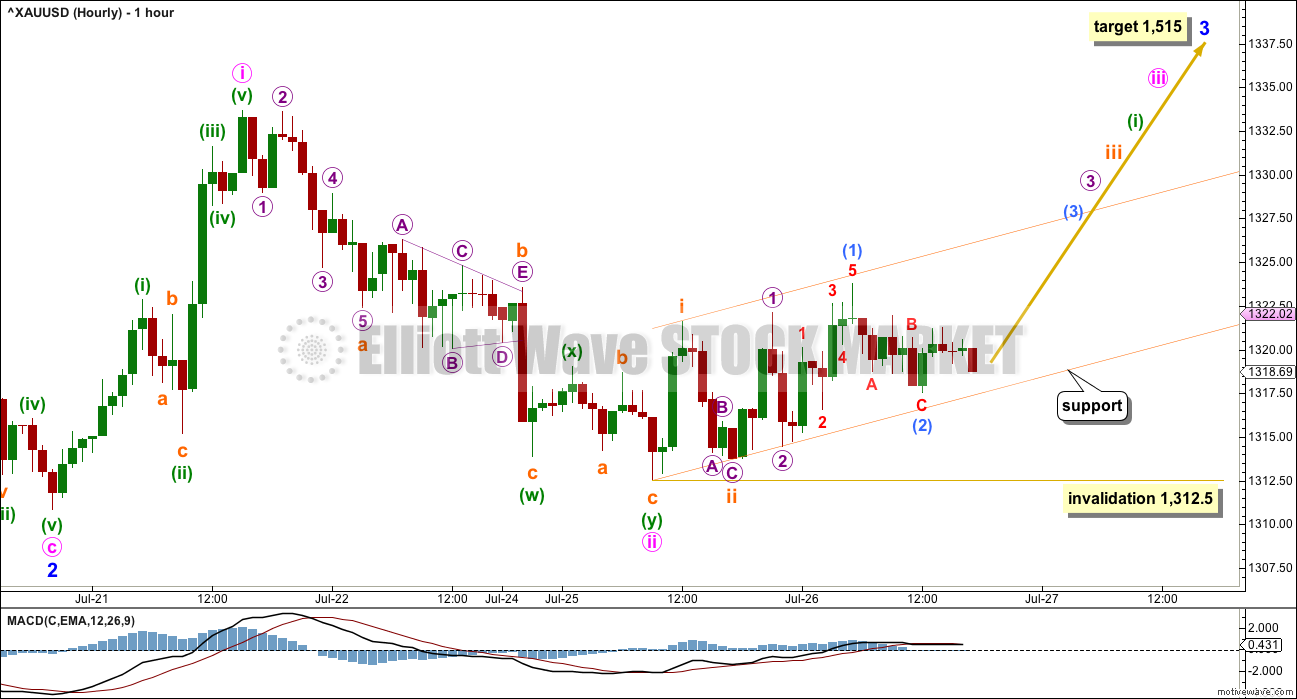
Upwards movement for Tuesday’s session breached the channel drawn about prior downwards movement. This adds a little confidence to the main wave count.
Upwards movement from the end of minute wave ii so far looks like a series of small first and second waves. The orange channel is a base channel drawn about subminuette waves i and ii. So far downwards movement is finding support at the lower edge.
The power of a third wave should break above the upper edge of this small base channel. When that line is breached, then it may provide support.
A new high above 1,333.66 would add further confidence to the main wave count.
When minuette wave (i) is a complete impulse, then another second wave correction for minuette wave (ii) may not move beyond the start of minuette wave (i) below 1,312.50.
At 1,515 minor wave 3 would reach 1.618 the length of minute wave i. This target fits only with the second higher target for intermediate wave (3) on the daily chart.
Minor wave 3should have support from rising volume and it should exhibit stronger momentum than minor wave 1.
Intermediate wave (1) lasted a Fibonacci thirteen days. Minor wave 1 lasted a Fibonacci eight days. Minor wave 3 may be expected to last longer, about a Fibonacci thirteen or maybe twenty one days.
ALTERNATE DAILY ELLIOTT WAVE COUNT
Click chart to enlarge.
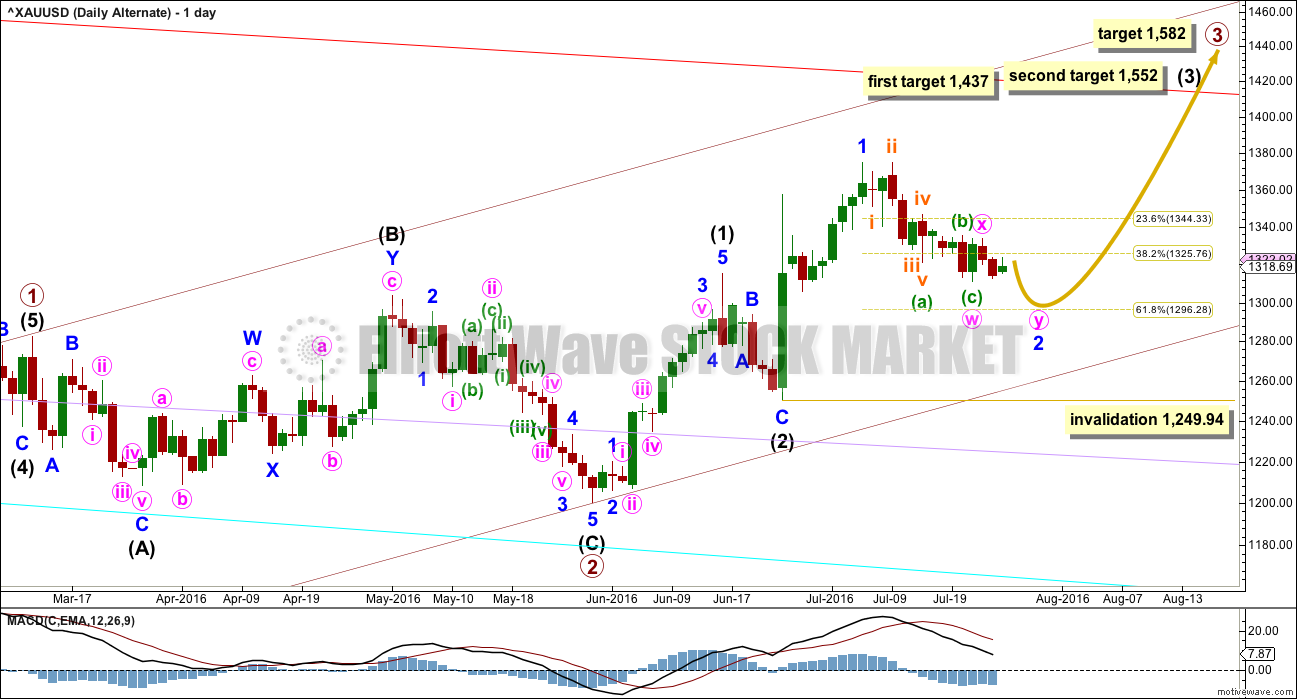
It is possible that minor wave 2 is not over and is continuing lower as a double zigzag.
A second zigzag in a double may be needed to deepen the correction to the 0.618 Fibonacci ratio of minor wave 1 at 1,296.
Minor wave 2 may not move beyond the start of minor wave 1 below 1,249.94. If it gets down that low, it should find very strong support at the lower edge of the maroon base channel drawn here about primary waves 1 and 2.
This wave count still has a lower probability than the main wave count due to proportion. Intermediate wave (2) was a quick zigzag lasting six sessions. So far minor wave 2, one degree lower, has lasted thirteen sessions and would be incomplete. A correction of a lower degree may be a little more time consuming, but for it to be over twice the duration and incomplete begins to give the wave count the wrong look.
It is the proportions between corrections which is a major factor in the right look of a wave count.
However, not all waves look perfect and alternatives should be considered.
ALTERNATE HOURLY ELLIOTT WAVE COUNT
Click chart to enlarge.
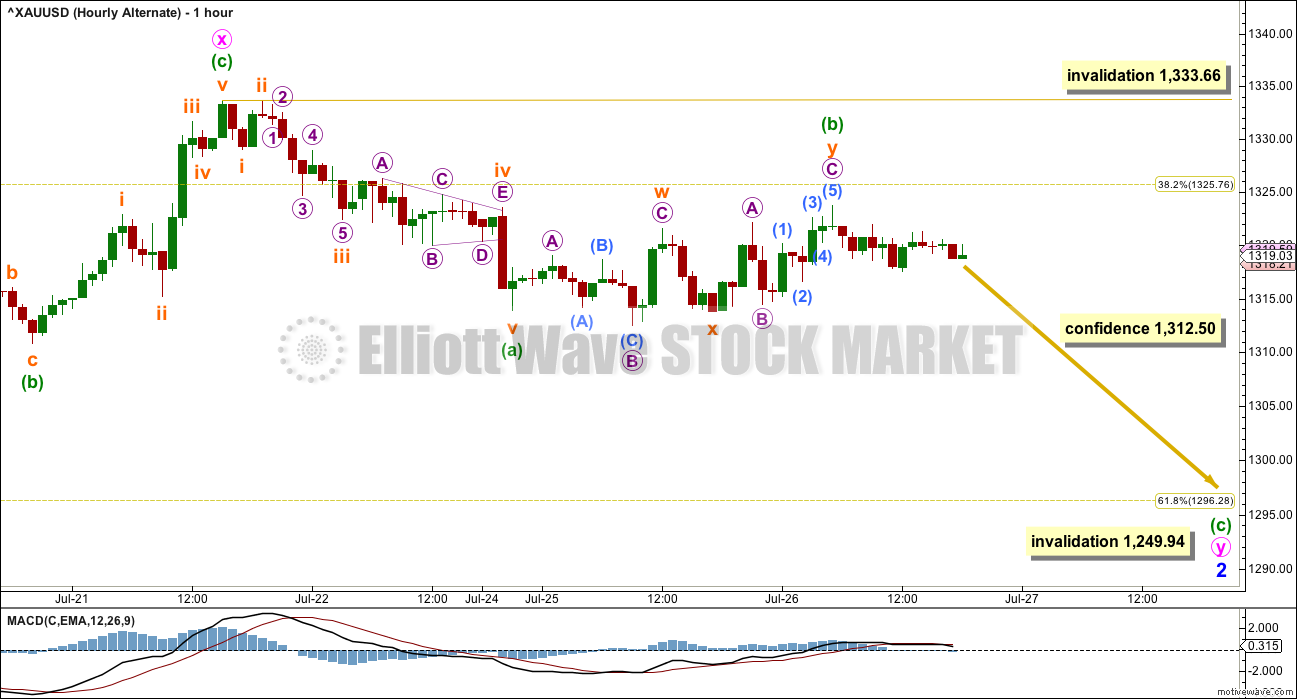
If minor wave 2 is continuing lower, then it may be as a double zigzag.
Upwards movement for Tuesday may have been a double flat correction for minuette wave (b).
This wave count has to see the downwards wave labelled minuette wave (a) as a five wave impulse. This piece of movement does not have as good a fit as the main wave count, which sees it as a three. In trying to see this as a five the third wave of subminuette wave iii does not fit as well. This slightly reduces the probability of this alternate, but both wave counts are viable.
If minuette wave (b) continues any higher, it may not move beyond the start of minuette wave (a) above 1,333.66.
Minor wave 2 may end about the 0.618 Fibonacci ratio of minor wave 1 at 1,296.
TECHNICAL ANALYSIS
WEEKLY CHART
Click chart to enlarge.
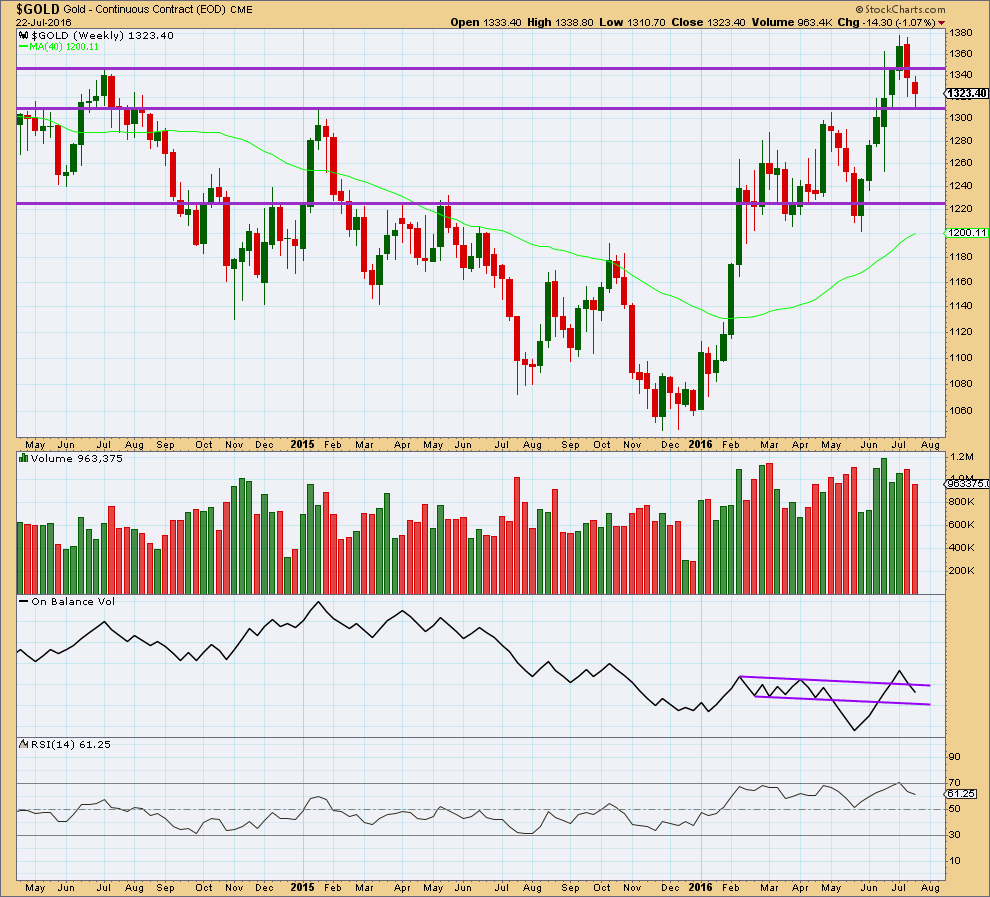
The week before last week completed a bearish engulfing candlestick pattern that was supported by an increase in volume. This bearish reversal pattern indicated a trend change from up to either down or sideways.
This weekly candlestick completes another red candlestick with lighter volume than last week. The fall in price last week was not supported by volume. Volume last week was lightest for six weeks, so this decline is significant. This last downwards week looks like a counter trend pullback within a larger upwards trend. The prior rise in price was supported by volume.
The reversal implications of the bearish engulfing candlestick pattern may now be fulfilled. A reversal pattern only indicates a trend change and gives no indication of how far or for how long the next trend should be. It also does not mean a change from up to down or down to up but may also mean a change from up to sideways or down to sideways.
Price may be finding support at the horizontal trend line about 1,310. Two weeks in a row with longer tails on these candlesticks is slightly bullish.
On Balance Volume is not working with the upper purple line, because it broke above the line giving a bullish signal only to turn and break below the line. The lower line so far should provide support if OBV moves lower.
DAILY CHART
Click chart to enlarge.
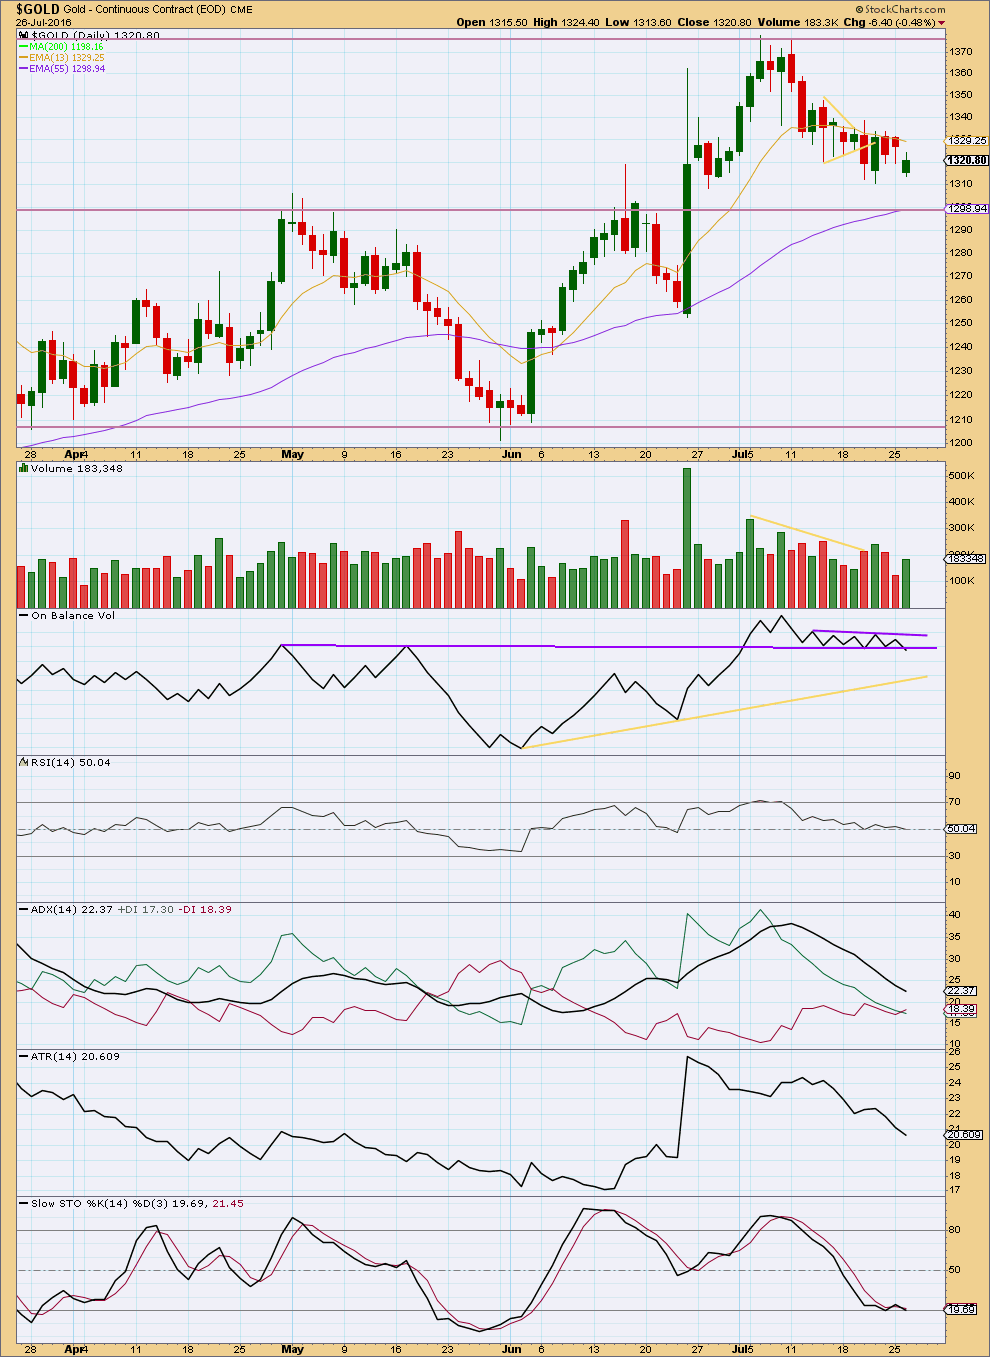
Monday’s session completes a small hammer candlestick pattern. When this pattern occurs at a low after a decline, then it is a bullish reversal signal.
Volume data has changed from StockCharts. This volume data is mirrored by COMEX data, so I must assume it is now correct.
Volume for Monday’s red candlestick was higher than the prior six sessions. There was support from volume for the fall in price on Monday.
Now Tuesday completes a small green daily candlestick on lighter volume. There was not support from volume for the small rise in price today.
In the short term, this volume profile is bearish.
On Balance Volume is also very bearish with a break below the purple trend line. Now OBV has come up to touch this line, and this line may now provide resistance.
Volume and On Balance Volume support the alternate Elliott wave count over the main Elliott wave count today.
RSI is neutral. This pullback has brought it down from close to extreme. There is plenty of room for price to rise or fall.
ADX is declining, indicating the market is not currently trending. ATR agrees as it too is declining. ADX is indicating a possible trend change from up to down, but the ADX line needs to increase before this is confirmed.
With ATR decreasing, this downwards movement looks more like a counter trend pullback than a new downwards trend. But volume indicates today the pullback may not be over.
Stochastics is just now entering oversold. Price may still continue a little lower.
This analysis is published @ 06:58 p.m. EST.
Well, the gold miners are all lighting up like Christmas trees and my GLD calls are now up 30%. It is certainly starting to look like your projection is right on target, Lara.
Yay! It was a slow start.
Now in subminuette iv I think….
Minuette (i) may still need a final fifth wave up to complete it.
FOMC 2 pm in 2 minutes by 2:02 pm gold dropped 7.00 NUGT dropped 8.00 to 127.44 than peaked at 321 at 151.45 up 24.00.
If I didn’t know better I’d try and see a triangle in a second wave position.
But it can’t be, that doesn’t meet EW rules.
So this move started with a series of 1-2, 1-2… now moving through 3-4, 3-4.
I’ve spent some time this morning on the five minute chart. I cannot see a five wave impulse for minuette (i) complete yet.
Now that price is moving up to complete subminuette iii (within minuette (i) ) the fourth wave corrections are very quick and shallow.
Minuette (i) is developing a typical curved look, typical of Gold’s impulses.
I will not be expecting a reasonable pullback until minuette (ii) arrives. That may be in a few hours.
My trading strategy will be this:
1. I’ve moved my stop up to breakeven. I’ll hold my first entered long position, target 1,582.
2. On each pullback I’ll add to my long position, same target.
3. When invalidation points are above my entry position then I’ll move the stop up to protect profits.
Just got sell signals for NUGT at 3:10 then 2 more at 3:21 pm at 1 and 5 minute time frames. Sell signals for gold at 5 minute at 3:20 pm
Good. I feel vindicated. I took my money and ran. See you guys tomorrow. Good night for me.
Gold just hit 1335.32 broke above Lara’s 1,333.66 bullish confidence.
Do we keep NUGT or does it correct?
I’m selling. Miniscule 3 has ended, or is ending soon. I’m sitting out wave 4. It has a possible $6 pullback at 0.382 Fib.
It is better to fight and run away. I’m now up $16 on NUGT. It’s a decent profit for an hour’s work.
good profit. Are we still in micro 3 or do you think this is ending now?
My wave count sees gold having just ended miniscule 3 as indicated in my post. After miniscule 4 is over, most likely $6 to $7 down from today’s high, then there are 3 third waves to play before ending minuette 1. These are small fry compared to the larger waves to come before hitting 1582. It’s the golden age (pun intended).
I see 1333.67. And, we’re thru. (Must have heard me whispering come on you SOB– not an acronym for some other bank.) 🙂 🙂
My sense in here from New London CT. on the deck of FATBOYS restaurant and Bar ,overlooking the Thames River and Long Island Sound is that we are in a very nice position concerning both gold and silver . Stochastics are ready to move up and there should be NO FEAR in taking long positions. I am especially attracted to silver at these prices . Couer De Alene Mines (CDE) has moved from $2.00 per share in February to over $13 and will be going well over $30 by XMAS. The same with Hecla (HL) ,which was $1.00 or so in February and now $6.00 and going to the mid $20’s . (I bought and held both in February as well as a number of gold stocks. I added boucoup shares of USLV (triple X ETF silver trust.) at $24.75 yesterday , (lookong for over $200 per share, You understand that the US has no silver reserves ,that used to back the Dollar. Remember the silver certificates (dollar Bills ) that said “Payable tpo the bearer on demand , one dollar in SILVER”.. No more. Silver is likely to regain its former ratio of 15 to one to gold ,so with gold at say $1,500 per ounce silver would be $100 per ounce (it is now about $20 per ounce). Why would this happen? Because the Chinese have been stockpiling Silver and will announce that the Yuan (chinese currency) will be backed by silver and convertible into silver. I leave it to you to fathom the implications for the Dollar versus the Yuan (especially when oil is priced in Yuan and probably rubles ( Yes the Russians are also buying silver). Should you take out a home equity loan at cheap interest rates ? Paying interest only and principal after 4 or 5 years ? Depends on your risk taking attitude. Me ? I SEE LITTLE RISK and very huge REWARD. C U later alligator. Stephen of New London Connecticut. Formerly director of Corporate Development ,Callahen Mining Corporation (among other things).
Stephen, thanks for sharing that. That’s interesting. Be careful of USLV due to the nature of volatility of silver. Good luck!
Gld broke the bull flag. Shooting up!! 🙂
Alan did you buy NUGT yet?
Does gold have to go first above Lara’s 1,333.66 bullish confidence?
NUGT 5 minutes signalled a Buy at 2:20
Gold 5 minute Buy at 2:20
Gold 15 minutes Buy at 2:30 pm
Hi Richard. I bought in a small amount when I first posted, at 134.88. Now I’m waiting for a dip to add on to my position.
Now we are in the dip but it looks pretty tame. This nano 3 wave looks pretty solid.
I see a strong 3rd wave up in progress after the release of FOMC minutes. This is a 3rd wave up in 4 degrees!
I’m getting in big time anytime now. Just waiting to see if the second wave correction is a single zigzag or if it comes in three waves. I have been caught so many times in the past because of this.
Should the BOJ, followed by the BOE provide stimulus as expected and the GDP number is positive on Friday, I’m thinking that GOLD sells off. Would love some dialogue on this.
I’ll take it one step at a time. I go for momentum plays and not buy-and-hold as I trade 3X ETF. I just let price dictate the action.
See if FED FOMC at 2:00 pm EST goes above Lara’s 1,333.66 bullish confidence or below 1,312.50 invalidation.
I favor the alternate count post FOMC and I’ll explain why if I turn out to be correct. I’m still trying to learn the methodology without paying from a well known trader who posts daily. He uses classic TA which Lara mentions in her analysis, but he takes it one step further. I’m currently seeing a setup where a move to sub $1300 Looks probable.
What I forgot to mention is the setup is only good at the end of the day. This large move up has negated the setup for now. If gold reverses tomorrow and the setup is back, it officially would still be valid. If gold continues higher tomorrow, the setup never actually occurred. So TBD….
Rambus PM combo chart – looks like we go much higher once the back test is complete – get your tickets now for the next leg up
https://rambus1.com/2016/07/26/pm-combo-chart-5/
Whatever the decision of FOMC may be..we here at elliottwavegold know that gold technically is in a medium term bull run with a target of 1580$..and i have also seen lara dont give importance to these one day rockstar central banks….a correction is always a chance to buy on dips..for now we have a sl of 1310$…if its trigger i vl surely buy at 1297odd levels…unless the alternate is invalidated…every dip is a buy…and i firmly believe that as we are in minor 3 “Expect surprises on the UPSIDE”
James this afternoon we got a big Surprise to the Upside!
Wednesday 2:00 pm EST FOMC announcement
The one big fear I have for gold is that most market participants expect the Fed to do nothing for the rest of year regarding rates. However, if they hint of future rate increases sooner than later, which would have an impact on the dollar, gold/silver, stocks and bonds. Perhaps, stocks might rally temporarily perceiving that the Fed feels the economy is improving enough to do one rate increase before the election. We’ll see how the markets will react tomorrow.
Good point….the fed doesn’t have to move and can still influence the market
Daily TA chart isint updated
It’s got the green daily candlestick for 26th of July which was current at the time of publication.
I guess it’s sideways until FOMC…
While gold moved up, then mostly sideways, GDX gapped up and continued higher. Tomorrow should be interesting.
I notice your comment “volume was unconvincing”.
That’s my problem right now with Gold.
But then, sometimes the start of a new move can be unconvincing… yet it continues.
Wouldn’t it be nice if markets gave fully reliable signals, and at least some of TA was certain? 🙂
But then… everyone would do it and we’d all be billionaires 🙂
So true…. 🙂
No, it’s more likely that we are all paupers. Everyone wants a share of the booty. All buyers and no sellers, or all sellers but no buyers. So, no deal can be cut. It’s not a zero-sum game anymore. The status quo is best. It allows the person(s) with the best insights win.
Thanks for the update, Dreamer. A good chart analysis is like a good filter to filter endless opinions. Let’s trade price with stops & solid risk management. 🙂