
A correction was expected to end at a target zone given at 1,337 – 1,339. Price moved lower to reach 1,338.21 and turned there to continue upwards, exactly as expected.
Summary: The trend is up. Corrections present an opportunity to join the trend. Expect upwards momentum to increase in coming weeks. The target for this third wave to end remains at 1,582. The middle of it may end about 1,437, but the correction after the middle may be brief and shallow.
New updates to this analysis are in bold.
Last weekly chart can be found here.
Grand SuperCycle analysis is here.
DAILY ELLIOTT WAVE COUNT
Click chart to enlarge.
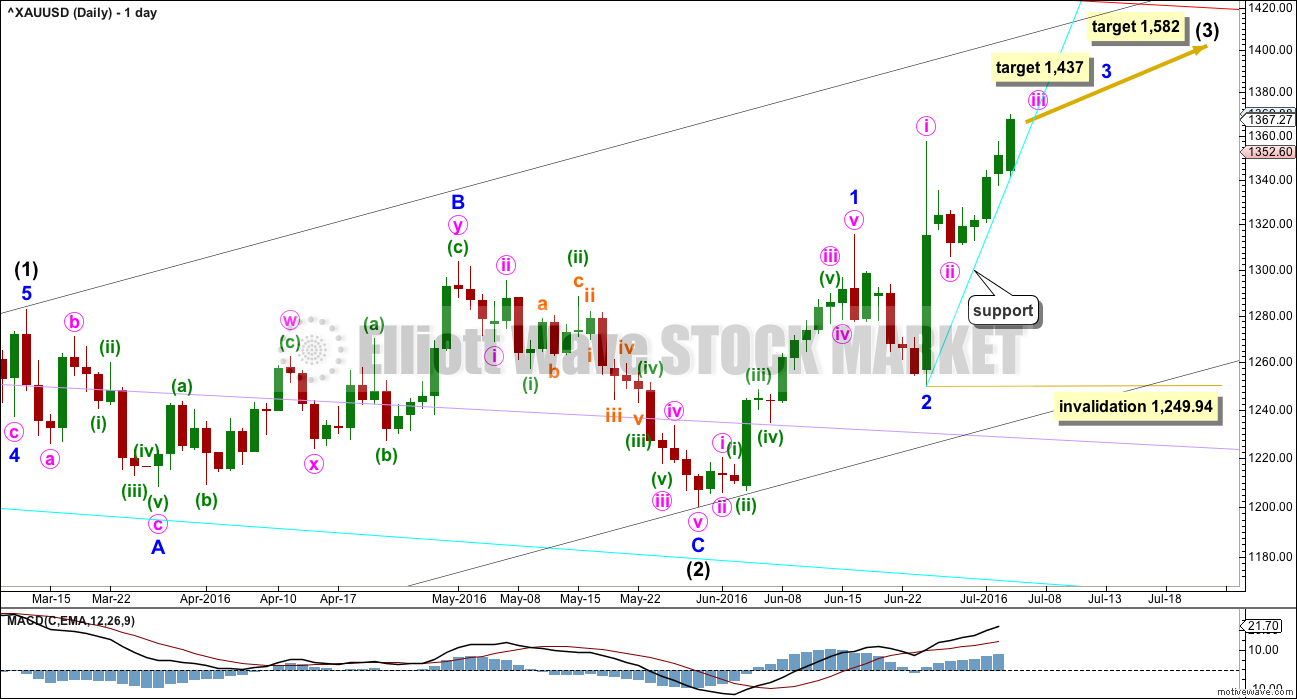
Intermediate wave (2) is a complete expanded flat correction. It is a shallow 0.350 correction of intermediate wave (1) lasting 56 days, just one more than a Fibonacci 55. There is no Fibonacci ratio between minor waves A and C. Minor wave C is a complete impulse.
Minor wave 2 may have been a quick, deep 0.57 zigzag over in just six sessions. If minor wave 3 has begun there, then at 1,437 it would reach 1.618 the length of minor wave 1.
When minor wave 3 is complete, then the following correction for minor wave 4 may be relatively brief and shallow. Intermediate wave (3) may end with a strong blowoff top typical of commodities. This may pull minor wave 4 up forcing it to be over very quickly. For position traders, the target of intermediate wave (3) may be more useful than a target for minor wave 3.
Add a base channel (black lines) to intermediate waves (1) and (2). Draw the first trend line from the low at 1,046.27 on 3rd December, 2015, to the low labelled intermediate wave (2), then place a parallel copy on the high of intermediate wave (1). Along the way up, downwards corrections should find support at the lower edge of the base channel, if they get that low. At this stage, it looks like corrections are shallow and may not reach back down to the base channel.
Minute wave ii may not move beyond the start of minute wave i below 1,249.94.
At 1,582 intermediate wave (3) would reach 1.618 the length of intermediate wave (1).
Adjust the support line, drawn here in cyan. At this stage, price may now continue to find support here as a third wave up accelerates towards a blowoff top. The top is still at least days away (or maybe weeks).
Intermediate wave (1) lasted 71 days (not a Fibonacci number) and intermediate wave (2) lasted 56 days (one more than a Fibonacci 55). Intermediate wave (3) should be expected to be longer in length and duration than intermediate wave (1). An early expectation may be for it to total a Fibonacci 89 days. So far it has lasted 27 days.
MAIN HOURLY ELLIOTT WAVE COUNT
Click chart to enlarge.
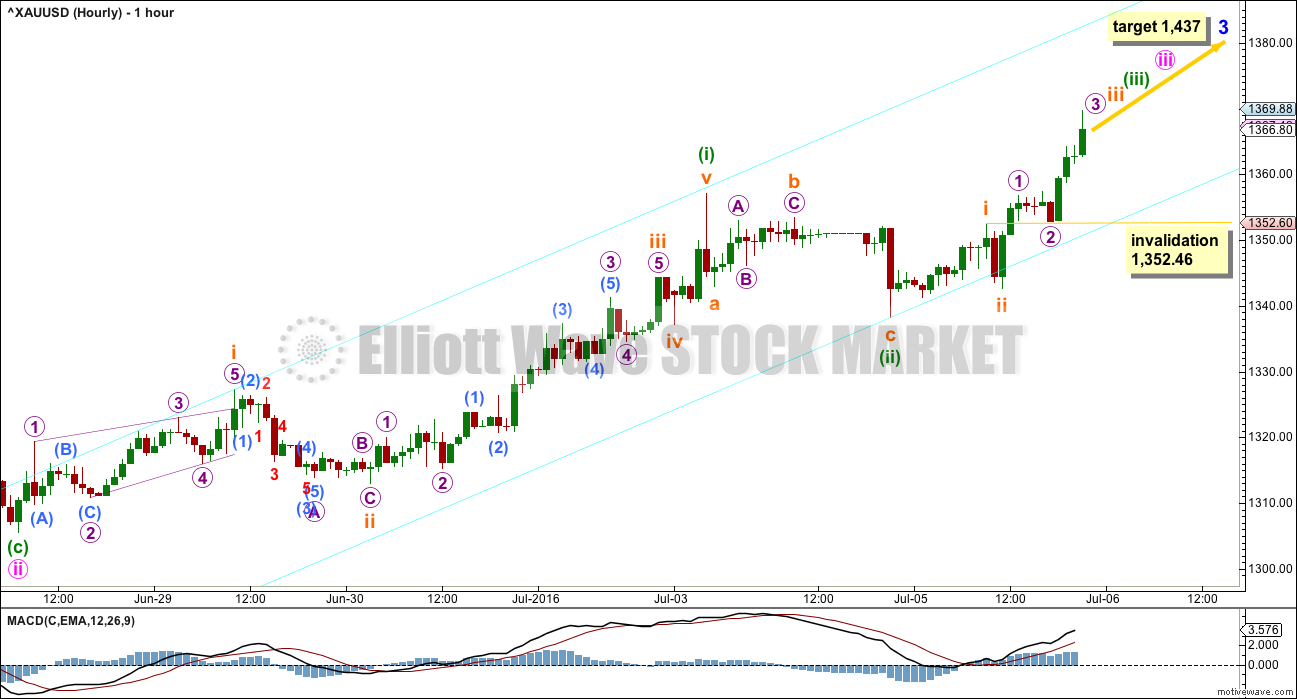
The target for minor wave 3 remains the same. At 1,437 minor wave 3 would reach 1.618 the length of minor wave 1.
If minute wave ii was very quick as labelled, then minute wave iv may be quicker still. A target is not given for minute wave iii because the following correction for minute wave iv may be too quick to show up on the daily chart.
Within minuette wave (iii), the upcoming small correction for subminuette wave iv may not move into subminuette wave i price territory below 1,352.46.
This main wave count sees minuette wave (i) over at the recent high yesterday. This gives minuette wave (i) a curved look because subminuette wave iii is quicker than subminuette wave ii. This is very typical of Gold’s impulses, and so this main wave count has a higher probability than the alternate below.
This wave count now sees a series of five first and second waves complete. The middle of a big third wave would be approaching. It should exhibit an increase in upwards momentum and an increase in volume. Targets for low degree third waves to end are not given because if this third wave behaves as Gold’s third waves typically do, then price may barely hesitate at any targets. The upcoming fourth wave corrections for fourth waves up to and including minute degree may be very quick and shallow.
If price comes down again to the cyan trend line, then it may find support there. Each time price corrects it presents an opportunity to join the trend.
Look out for surprises to the upside for this wave count.
ALTERNATE HOURLY ELLIOTT WAVE COUNT
Click chart to enlarge.
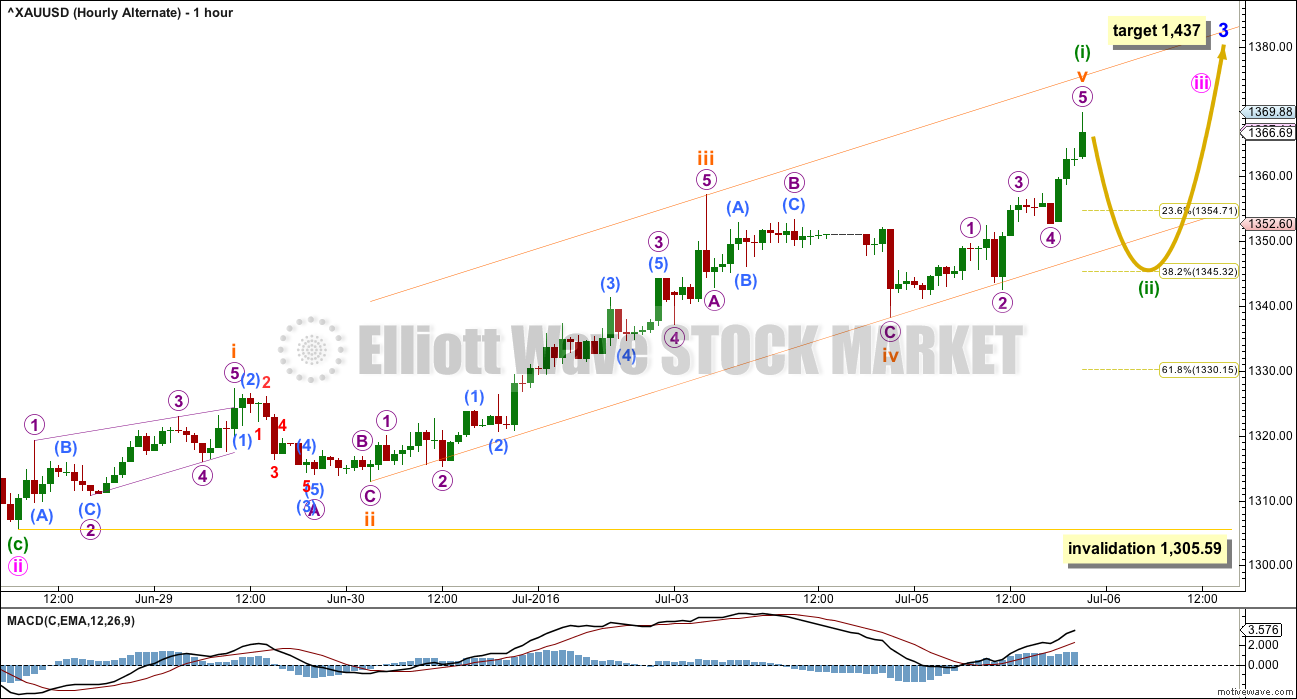
This alternate hourly wave count is new. It looks at minuette wave (i) ending more recently and having a more textbook look, rather than the curved look more typical of Gold.
If a larger more time consuming correction develops about here, then at this stage it may be minuette wave (ii). It may end about the 0.382 Fibonacci ratio at 1,345. At this stage, it may be more likely shallow than deep as the middle of a big third wave pulls it upwards.
Minuette wave (ii) may not move beyond the start of minuette wave (i) below 1,305.59. At this stage, this is now the final risk to long positions.
TECHNICAL ANALYSIS
DAILY CHART
Click chart to enlarge.
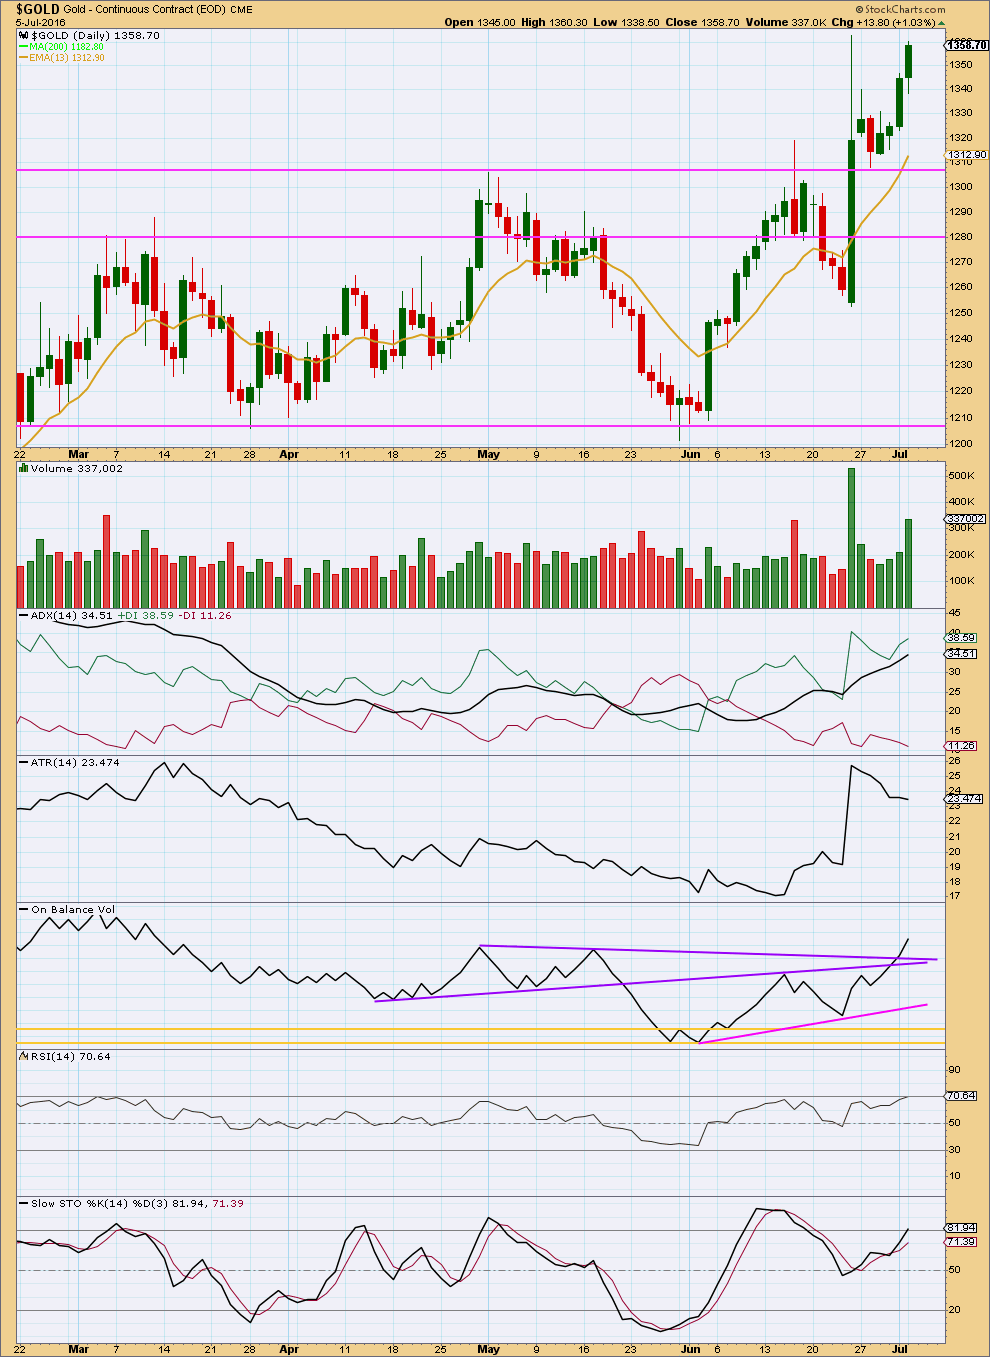
Now price has moved upwards for four days in a row to complete green daily candlesticks on increasing volume. The rise in price is supported by volume. There is no longer any concern over the volume profile. This supports the daily and main hourly Elliott wave count.
ADX is increasing and the +DX line is above the -DX line indicating an upwards trend is in place. This trend is becoming extreme with ADX now over 30. However, ADX can remain extreme for a reasonable period of time during the end of Gold’s impulses (in my experience, only above 40 would there be any serious cause for concern).
ATR still disagrees with ADX today; it is still declining. The decline is slowing and range is still high at 23 though. If ATR shows an increase in the next few days, then more confidence may be had in an upwards trend. At this stage, the disagreement between ADX and ATR warrants some caution. Manage risk carefully in case a deeper correction is to unfold here.
On Balance Volume has given a strong bullish signal today with a break above two resistance lines in purple. On Balance Volume is now free to continue rising. There are no further resistance lines found at this time.
RSI is not yet extreme and will exhibit no divergence with price when the next daily candlestick which has made a new high (not yet shown in StockCharts data) is considered. RSI can remain extreme for a period of time during a trending market. When it shows divergence between price at swing highs, then it may be indicating exhaustion.
Price may find support at the 13 day moving average as the upwards trend continues.
Divergence with price and Stochastics indicates some exhaustion to upwards movement, but this is not always very reliable. It is a weak bearish signal indicating the alternate Elliott wave count may be correct.
This analysis is published @ 11:31 p.m. EST.
Ditto to hearing from those who have experience – refresh see Lara just answered – okay, thats happened before . . .
So I noticed GDX moving up to sideways while XAU doing a small pullback.
Anyone have a current hourly wave count with GDX? (Thanks again to Lara for her July 5th update) Wondering what others have seen as targets for near-term.
Good morning every body. Working on a chart for you now….
Main hourly chart updated. I think I may need to move the degree of labelling from the low of minuette (ii) on upwards all down one degree though…. this labelling expects the middle of the big third wave has just passed, and I don’t think that’s right.
I think the middle is more likely still ahead. Close, but not done yet.
Lara,
Thank you for your update. Agree middle of iii 0f (iii) is still ahead. Is it workable if we place Wave i in place where you have a iii now and place ii where its iv now?Since it is iii of (iii) of {iii} needs to subdivide right from the get go. Sub-divisions look OK. TIA
if this works, we may GAP open higher tomorrow?
like this?
alternate hourly updated
we could move lower tomorrow…. or minuette (ii) could be surprisingly brief and shallow and we could begin to accelerate up tomorrow…
unfortunately (or fortunately for those of us with longs already) we need to be aware now for big surprises to the upside.
here subminuette v is close to 1.618 X subminuette i
Lara,
Here is what I meant, hope all sub divisions fit well? Very minor modification of the last leg up only.
Hope you will not mind using your chart, it fits into iii of (iii) of [iii] of Minor 3 scenario….market just needs to smile and do it…….. 🙂
That works too Sandy.
Looks like the market is smiling for us, moving up and away from that cyan trend line again.
Using that trend line to enter long is a good approach. “Buy the dips”.
Looking and hoping for the dip in gold to be purchased… just hit 1359. Any thoughts? Candle for gold is looking weak too. Fed minutes released were uneventful… data dependent; not hawkish or dovish per say. ADP report to be issued tomorrow morning before open trading hours and and Employment report to be issued on Friday morning prior to market hours. Hearing from those who have experience and understanding is very welcome.
It’s right at the lower edge of the channel.
I’d be adding to my long position here…. I’m slightly concerned that todays candlestick is developing a long upper wick though. That’s a somewhat bearish indicator. So I’ll be waiting for volume and RSI data when the session’s closed from StockCharts before I decide.
May be starting a Sub-minuette v from the low at 12:23 to complete Minuette (iii).
Anyone has a present Wave count? Tiny Inv. HS at the low?
WEDNESDAY, JULY 6 – 2:00 pm EST – FOMC minutes from 6/16 meeting
This site has super fast news on FOMC at 2:00 pm
http://www.marketwatch.com/newsviewer
Thanks a lot Lara, I wish you well, I said some prayers for you and your neck over the weekend and tonight.
Thank you very much Richard. They may be working, I’m feeling a whole lot better 🙂