
The main hourly Elliott wave count was invalidated and the alternate confirmed. Thereafter, price moved lower towards the target then turned upwards as expected for that wave count.
Summary: The trend is up. Corrections present an opportunity to join the trend. Expect upwards momentum to increase next week. The target for this third wave to end remains at 1,582. The middle of it may end about 1,463, but the correction after the middle may be brief and shallow.
New updates to this analysis are in bold.
Last weekly chart can be found here.
Grand SuperCycle analysis is here.
DAILY ELLIOTT WAVE COUNT
Click chart to enlarge.
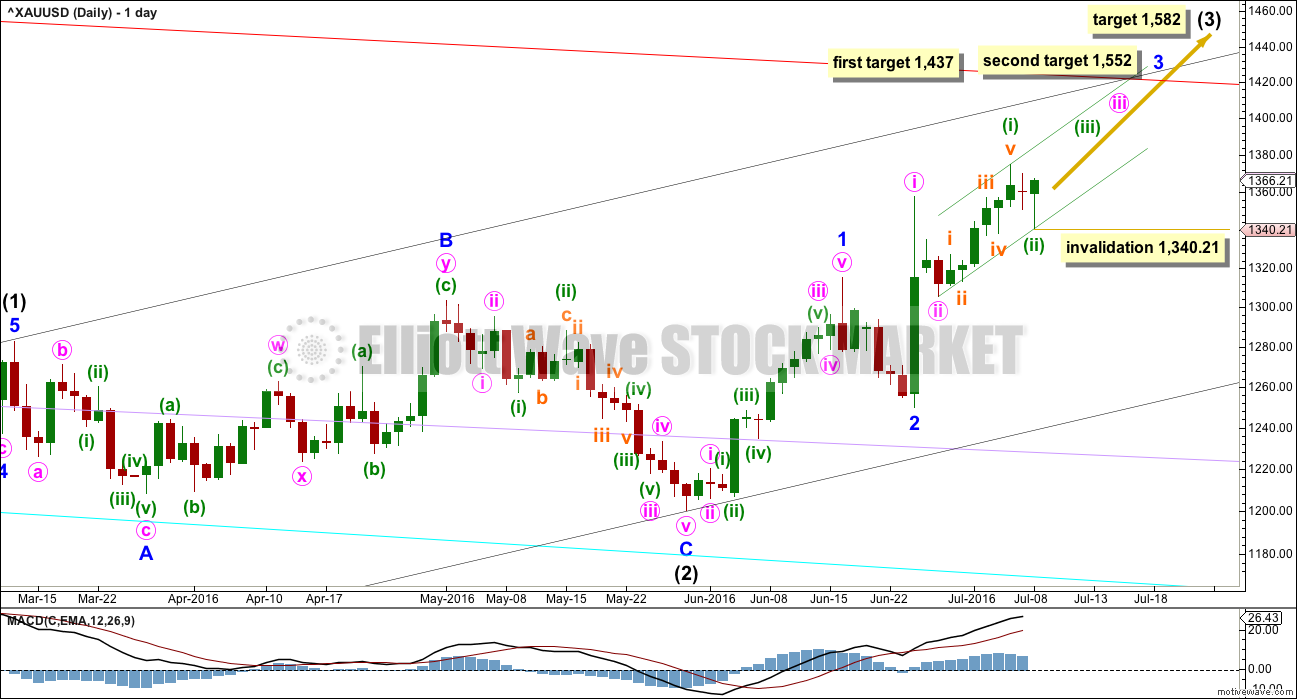
Intermediate wave (2) is a complete expanded flat correction. It is a shallow 0.350 correction of intermediate wave (1) lasting 56 days, just one more than a Fibonacci 55. There is no Fibonacci ratio between minor waves A and C. Minor wave C is a complete impulse.
Minor wave 2 may have been a quick, deep 0.57 zigzag over in just six sessions. If minor wave 3 has begun there, then at 1,437 it would reach 1.618 the length of minor wave 1.
When minor wave 3 is complete, then the following correction for minor wave 4 may be relatively brief and shallow. Intermediate wave (3) may end with a strong blowoff top typical of commodities. This may pull minor wave 4 up forcing it to be over very quickly. For position traders, the target of intermediate wave (3) may be more useful than a target for minor wave 3.
Add a base channel (black lines) to intermediate waves (1) and (2). Draw the first trend line from the low at 1,046.27 on 3rd December, 2015, to the low labelled intermediate wave (2), then place a parallel copy on the high of intermediate wave (1). Along the way up, downwards corrections should find support at the lower edge of the base channel, if they get that low. At this stage, it looks like corrections are shallow and may not reach back down to the base channel. When intermediate wave (3) moves towards the middle, it should break above resistance at the upper edge of the base channel. When that trend line is breached, then it may offer support. A break above a base channel confirms a third wave up.
Within minute wave iii, no second wave correction may move beyond its start below 1,305.59.
At 1,582 intermediate wave (3) would reach 1.618 the length of intermediate wave (1).
Minor waves 1 and 2 are complete within intermediate wave (3). Minor wave 3 has begun and may only subdivide as an impulse. At 1,437 minor wave 3 would reach 1.618 the length of minor wave 1. If when price gets to this first target the structure is incomplete, or if price keeps rising through this first target, then the second target would be used. At 1,552 minor wave 3 would reach 2.618 the length of minor wave 1.
Draw a base channel now about minuette waves (i) and (ii) (shown in green). Copy it over to the hourly chart.
Cyan, lilac and now red trend lines are copied over from the weekly chart. These are longer term lines which may offer support / resistance. Weekly and daily charts are on a semi-log scale.
Intermediate wave (1) lasted 71 days (not a Fibonacci number) and intermediate wave (2) lasted 56 days (one more than a Fibonacci 55). Intermediate wave (3) should be expected to be longer in length and duration than intermediate wave (1). An early expectation may be for it to total a Fibonacci 89 days. So far it has lasted 30 days.
HOURLY ELLIOTT WAVE COUNT
Click chart to enlarge.
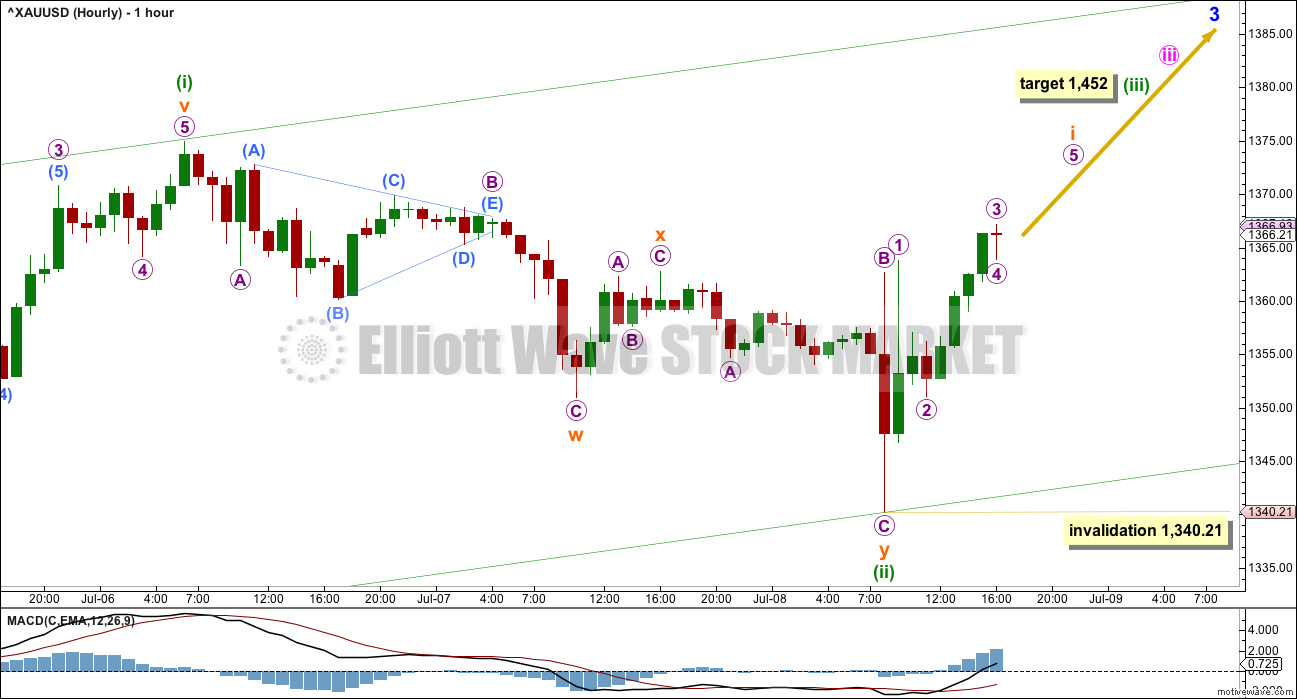
This was the alternate hourly wave count yesterday, and today is the only hourly wave count left by process of elimination.
Minuette wave (ii) continued lower to complete a double zigzag. It is a relatively deep zigzag at 0.50 the length of minuette wave (i).
There is a series now of four overlapping first and second waves so far within this upwards movement from the low on 3rd of December. Intermediate wave (2) was a relatively shallow 0.35 correction of intermediate wave (1), minor wave 2 was relatively deep at 0.57 of minor wave 1, minute wave ii was relatively shallow at 0.48 of minute wave i, and now minuette wave (ii) is halfway of minuette wave (i). There appears to be no pattern here.
Minuette wave (iii) would reach 1.618 the length of minuette wave (i) at 1,452. If this target is wrong, it may be too low. Expect any surprises over the next few weeks to be to the upside. If price keeps going upwards through this first target, then the next expectation would be at 1,522 where minuette wave (iii) would reach 2.618 the length of minuette wave (i).
Along the way up, the lower edge of the base channel should provide support for corrections. When subminuette wave i is a complete impulse, then subminuette wave ii should find support there, if it gets that low. At this stage, within a large third wave expect corrections to be increasingly brief and shallow. Price may not get low enough to touch the lower edge of the base channel.
The strength of a third wave should be able to push price above the upper edge of the base channel. Once that upper edge is breached, then that line may provide support.
Subminuette wave ii may not move beyond the start of subminuette wave i below 1,340.21.
TECHNICAL ANALYSIS
DAILY CHART
Click chart to enlarge.
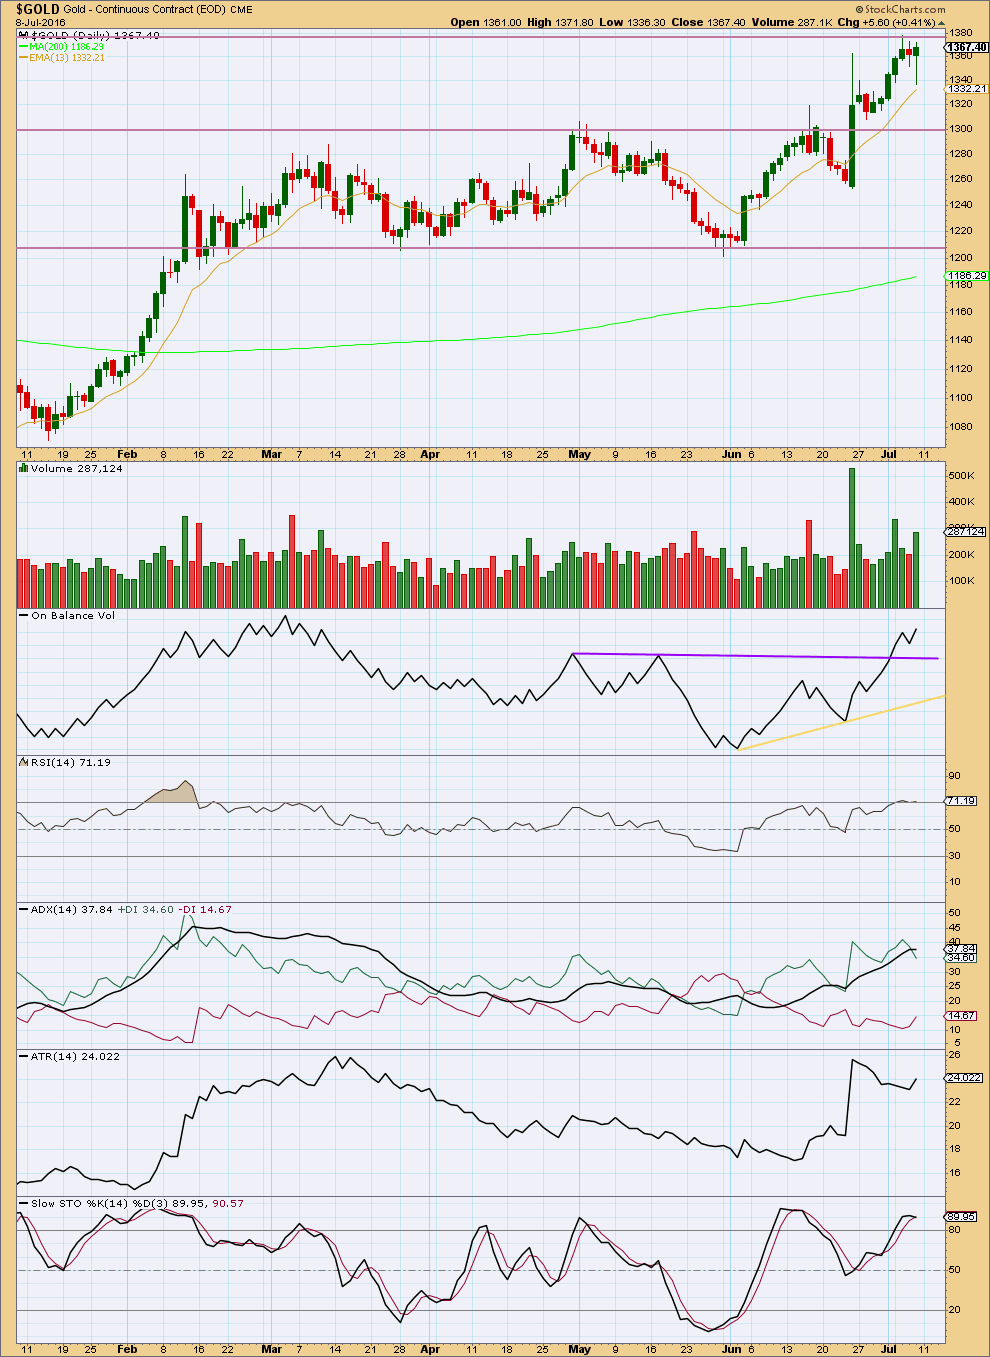
Friday’s candlestick is green with a long lower wick. It looks bullish at this stage. Upwards movement was supported by an increase in volume for Friday.
On Balance Volume continues to be bullish; it remains above the purple trend line.
RSI is only just barely overbought. This indicator may remain extreme for several days during a strongly trending market for Gold. It should be used to indicate weakness if it exhibits divergence with price. At this stage, there is no divergence between price and RSI.
ADX still indicates there is an upwards trend in place. ADX is extreme, over 35. But during Gold’s third waves (and its strong C waves) ADX can remain extreme for reasonable periods of time.
ATR at the end of the week is again increasing, agreeing with ADX.
Stochastics still exhibits some divergence with price: stochastics made a lower high as price made a new high this week. This divergence is bearish but may have been resolved now by two days of downwards movement.
The classic technical analysis picture is very bullish for Gold, but extreme readings are sending a warning to be on the lookout for any weakness in upwards movement. At the end of this week, no weakness to indicate an end to the bull run is seen. Expect the bull run to continue.
This analysis is published @ 02:40 a.m. EST on 9th July, 2016.
Downwards movement so far looks very suspiciously like a five wave structure, not a three.
We may yet see a slight new low for Gold before it’s ready to move up.
Price remains within the base channel. If it gets low enough it may find support at the lower green line.
I know it is a gold forum. But today SPX made new high above 2134.71.
Central bankers have won and now it appears the general market is on its way to much higher level.
Looking for PM sector to follow bullishness in general market.
The break of this level, totally changes the count from bearish to bullish in the SPX…have to agree with you on the PM and wouldn’t be surprised if GC starts to make a real good move up this week to 1st target of 1432
Lots of resistance to get through at the $1420 price level for gold
Miners already broke their downtrend line. I think gold follows.
People’s level of bullish confidence on gold and miners varies greatly.
Until we break thru $1420, I’m not getting overly excited about this move. If we break $1420 in a meaningful way however, and have a successful retest, I would have much more confidence the downtrend since 2011 has changed.
Any comment on this correction…i agree its looking like a 5 wave structure…
I have subminuette 2 as a 3-wave structure: 1375.29-1363.31-1371.37-1350.85. Micro C in Subminuette 2 was 5 waves as it has to be.
Ohhkkk alan…thank u
Hi Alan,
You nailed this move on Friday when you sold and explained that you’ll be waiting for a better entry point. Nicely done!
So, if gold is trading at $1,355 right now, are we heading towards the $1,371 level next followed by the move to $1,350.85? Just trying to understand where we are in the 3 wave structure you described.
Also, would you happen to have approximate timing needing to complete?
Thanks Stephen K for the compliment.
We have completed the move to 1350.85, and is now slowly moving up in Subminuette 3. We are currently in micro 1, and I think submicro 2 has completed at 1353.74. (Submicro 1 was at 1360.36). Using a 10 minute chart helps to see those moves. Hope this helps.
It is very difficult to place a correct timeframe. That is one weakness in my method. I normally try not to think about it, and let price move.
Wonderful 61.8% retrace. Another embedded 2nd wave correction.
The move up should be swift and powerful as momentum builds.
Starting to look like 5 down from $1376ish which is not what was suppose to happen…not good for Bulls
Ross Clark on gold
http://www.321gold.com/editorials/hoye/hoye071116.pdf
Lara,
This may solve the O/Lap problem from different data providers, same purpose in sub-minuette iii of (iii). As per the chart Wave i was huge near $40+ so it fits well
There’s no overlap on COMEX data.
Alan is there any buying opportunity for GDX/NUGT between now and “minuette 3 should end at 1522”?
Richard, it doesn’t matter which count is correct. Price is now dropping slightly. Lara has the drop complete likely at 1361.59 (minuette 2). The submicro count puts it at 1359.39 (c=a), or slightly lower (c=1.272/1.382/1.618a). Ditto ssandysc’s count.
If you can access the market anytime now, you can buy in at that point. Unfortunately, I would have to wait until the US market opens as I am going for NUGT. Possibly, I’ll buy in at the first dip after market opens.
I will mull over each count as the price movement proceeds. I can’t say for now which one is definitely correct. I’ll just be flexible and go with the flow.
Richard, I left a comment for you in response to your asking about surfing. Just FYI in case you missed it in the last analysis.
Looks like Gold has reached down to the 0.382 Fibonacci ratio now. Time to look at adding to my long position.
Great
Lara I watched your surfing video link on the July 7th comments. Great to be able to film your rides and watch them. Thanks for sharing.
Great, you’re welcome. I shared because then I think you’ll really “get” why surfing is a thing that surfers need to do, to stay healthy and happy 🙂
Yes if is just about the most fun and feel so alive and free you can have in the world.
Updated hourly chart. Subminuette i may now be complete. Subminuette ii down may be underway. It may correct to the 0.382 or 0.618 Fibonacci ratios, favouring the 0.382 in this instance due to the proximity of the middle of a big third wave.
I’ll be looking to add to my long position on this correction down.
Lara, what price do you have micro 1 ending vs what price micro 4 ends? it looks like an overlap on your chart, but it’s close. Thanks
One possibility is that Micro wave 3 is extending. Instead of Micro 4 as shown, it could be submicro wave 2. Waves often extend in the middle of a 3rd wave. Something like the attached chart.
I second that. This would bring micro 3 to end at possibly 1.618 Fib at 1408. Which means minuette 3 should end at 1522, the higher target I alluded to last Friday.
Dreamer,
How do you get these circled numbers for sub-minuette waves on Investing.com charts? thanks
The data from COMEX that I’m using has micro 1 high at 1,363.83 and micro 4 low at 1,363.85.
Yes it does look like they overlap, doesn’t it. But they’re just slightly apart.
Lara, it’s just that most of us looked at the 1-hour chart since you published the same.
The datafeed I am sure most of us use resolves micro 1 as 1370.53. That’s where the confusion arises.
If we look at smaller timeframes, the 10 minute chart for instance that I appended from the screen capture taken from pmbull, the picture becomes clearer. However, I do not get anywhere near 1363.83 that COMEX shows. 1370.53 could be micro 3. Gross differences in data aside, I will take your count as correct until price action deems otherwise.
Note: time depicted on the graph is Singapore time, +7 GMT, or +12 US ET.
Ah, the old problem of different data from different feeds.
I don’t think we’ll ever resolve that one.
And yeah, I know when you look at the hourly chart I published it does look like they overlap. I think it’s a bit of an optical illusion due to the upwards sloping green channel on my chart.
August Gold (GCQ6) likely has seen Sub-Minuette Wave i high at 6:55 PM at 1376.50?
May retrace deep for a ii, likely a D ZZ?
Lara: On grand super cycle wave iv duration in the past you had estimated to be shorter than Super cycle wave III (81 years).
In the past your comment was”I have Gold in a Grand Super Cycle wave IV (lime green circle).
I have Grand Super Cycle wave III lasting 79 years. I would expect Grand Super Cycle wave IV to be more brief, so maybe a Fibonacci 55 years.”
The current updated duration for grand super cycle wave IV is few years. I am happy to see revised duration from 55 years from 2011.
Are you expecting cycle wave b to be complete soon and then cycle wave c to begin soon to cycle wave c target of 600 in few years??
It has been our experienced that completion of wave structure are after the fact.
Gold’s price between 1900 and 2200 we will be expecting cycle wave b to be complete. NOT BEFORE THAT.
PS: I am not trying to be critical but am trying to see how to manage my long term core gold investment. I am not a day trader. I like the long term perspective of gold using your excellent EW analysis ( which is the only best analysis).
Thanks.
Thanks Papudi, I’m not taking your comment as criticism at all, it’s an entirely valid question.
Time is harder than price to estimate, and so I do tend to change my estimates and sometimes I’ll flip flop, which is horribly confusing and unhelpful I know, and so for that I apologise.
My comment about Grand Super Cycle wave IV was that it MAY be over within a few years.
Let me take a stab in the dark and try to estimate how much longer it may be.
Grand Super Cycle wave III was about 81 years, not a Fibonacci duration, too far off 89 to be considered close.
If Grand Super Cycle wave IV is an expanded flat then it would be quicker than if it is a triangle. So far Super Cycle wave (a) was 4.25 years. Super Cycle (b) may be about the same, but if it turns into a complicated time consuming B wave it could be a great deal longer. Let’s assume for simplicity that it’s about the same, so at it’s end Grand Super Cycle IV may be 8.5 years. Still requiring Super Cycle (c) to complete it.
The next Fibonacci number in the sequence is 13, so Super Cycle (c) may last about 5 years, taking Grand Super Cycle IV to a total Fibonacci 13 years.
What if it’s a triangle? Then the whole thing could move sideways in an ever decreasing range for years and years…. total a Fibonacci 21 maybe?
It is absolutely impossible to tell at this point if it will be a flat or a triangle. Both start out with a three for the A wave, and both may have the A wave as a double zigzag. Both flats and triangles are common structures.
So you see, this really is quite a stab in the dark. And the whole premise of my musing above is that Grand Super Cycle IV may exhibit a Fibonacci duration…. and if it doesn’t then my words above are useless.
Sorry for the very long comment!
And about price:
“Gold’s price between 1900 and 2200 we will be expecting cycle wave b to be complete. NOT BEFORE THAT.”
Not necessarily.
The minimum for a flat is for Super Cycle (b) to end at 1,832.79.
There is no minimum for a triangle. I have found a common length for triangle subwaves is about 0.8 to 0.85 the prior wave, which would see Super Cycle (b) reach to 1,745.
It can move up to 1,900, it can make a new high, but it doesn’t have to.
Sorry Papudi, the biggest thing to remember here is we need flexibility. This is a corrective structure, and we can’t tell at this stage which structure it will be.
Right now, we’re in a B wave within a correction. The worst most horrible difficult to analyse. Over 23 possibilities. And we have no idea which one it is yet.
Excellent Thank you this gives me some perspective to work with.
I appreciate.
Thanks, Lara. Your explanations about duration and price targets are really helpful!
The GDX correction for Minute 4 looks like it turned out to be very shallow, although price did drop much lower in pre-market than shown on the chart after the NFP news release.
I think we go to above 32 before the next significant correction. That will fill the 2013 gap on the daily chart I’ve shown previously. The move up to 32+ will be about 5% from here for GDX and about 15% for NUGT.
Good trading to all.
Dreamer, a big Thank You for sharing your GDX charts with us all. Most useful and valuable for members I am sure.
That is very kind.
You’re welcome. Just trying to share some ideas and learning with all!
Thanks for sharing your surfing video on the 7/7 post. Looks fun!
Dreamer, thanks & have a good weekend!
Rambus has a target on GDX over 51. Are you on the rocket? This could coincide with the end of cycle wave a for gold, sometime in the 1st half of 2017. I bet Lara will have a target close to that when the EW pattern developes more.
https://rambus1.com/2016/07/08/pm-stock-indexs-update/