
Last analysis expected upwards movement. Price has moved sideways.
Summary: Upwards movement is expected to continue. A small pennant looks to be completing and the breakout should be upwards. In the short term, the target is at 21.255 – 21.44. Mid term the target is at 24.219. Longer term the target is at 24.22. This trend is now extreme, so stops must be used (as always).
New updates to this analysis are in bold.
WEEKLY WAVE COUNT
Click chart to enlarge.
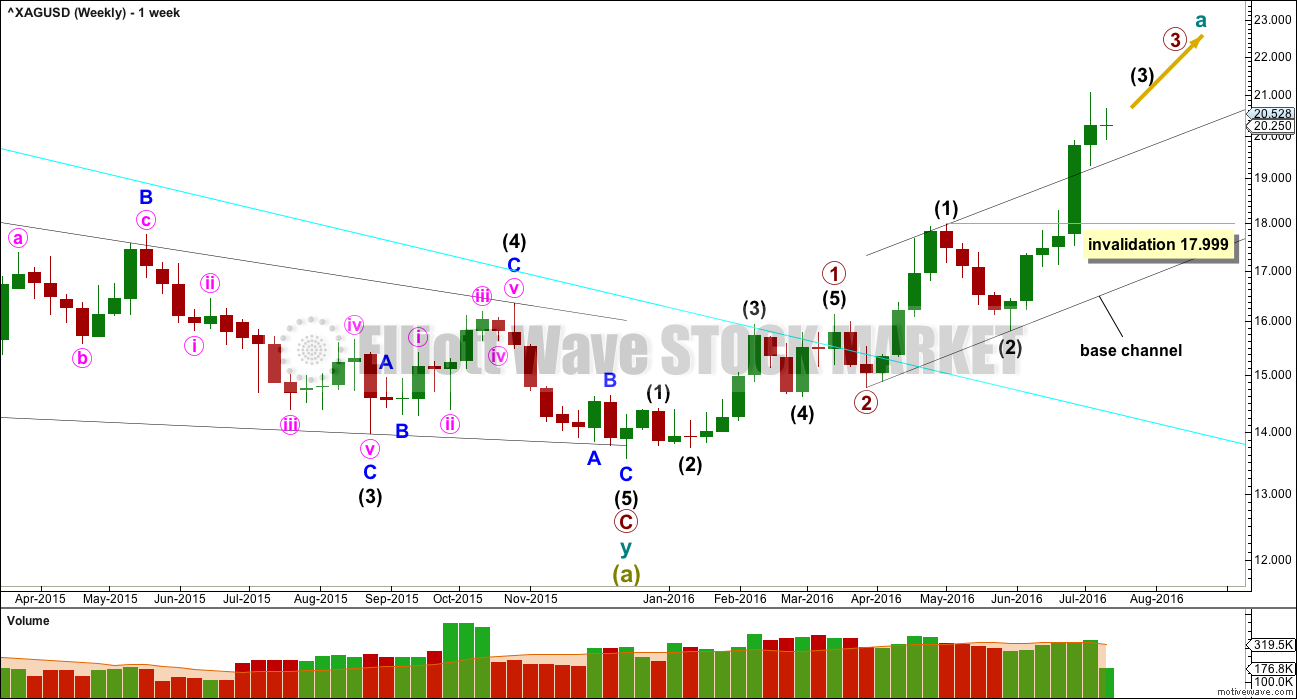
Two first and second wave corrections may be complete. Silver may be ready to move into a strong third wave up.
When intermediate wave (3) is complete, then the following correction for intermediate wave (4) may not move into intermediate wave (1) price territory below 17.999.
Draw a base channel about intermediate waves (1) and (2) as shown. The upper edge is providing support now that price has broken above it. If price makes a deeper than expected correction here, then the upper edge of this channel should provide very strong support.
DAILY WAVE COUNT
Click chart to enlarge.
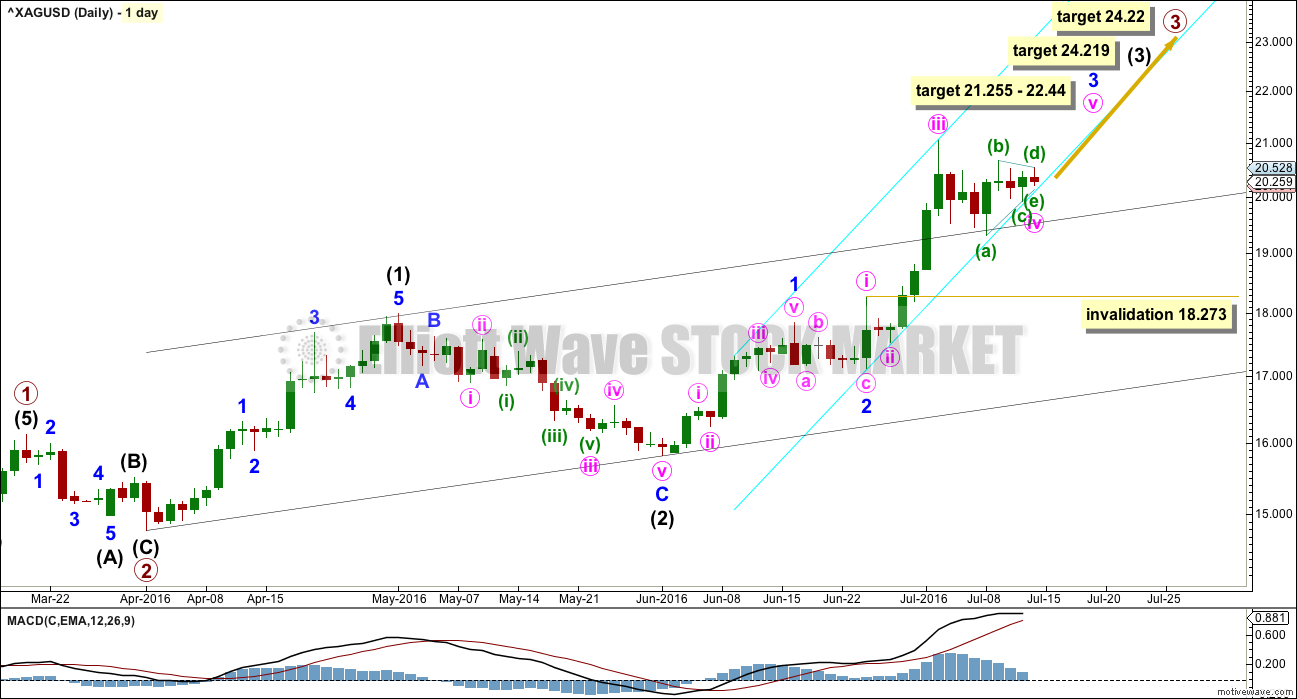
At 24.22 intermediate wave (3) would reach 2.618 the length of intermediate wave (1).
At 21.255 minute wave v would reach equality in length with minute wave i. At 22.44 minor wave 3 would reach 2.618 the length of minor wave 1. This gives a rather wide 1.185 target zone.
Within the impulse of minor wave 3, minute wave ii looks like a zigzag. So far it looks like minute wave iv is unfolding as a regular contracting triangle. The breakout should be upwards.
The triangle will remain valid as long as price remains above 19.304. Within the triangle, minuette wave (c) may not move beyond the end of minuette wave (a).
Within the impulse of minor wave 3, minute wave iv may not move into minute wave i price territory below 18.273.
A best fit channel is drawn this week about upwards movement. So far it shows where price is finding support and resistance. Minor wave 3 may end midway within the channel.
If targets are wrong, they may not be high enough. Silver, like all commodities, has a tendency of swift strong fifth waves. They are not necessarily extended in price, but they often are. Look out for surprises to the upside for this market at this time; blowoff tops commonly occur at the ends of third waves.
TECHNICAL ANALYSIS
WEEKLY CHART
Click chart to enlarge. Chart courtesy of StockCharts.com.
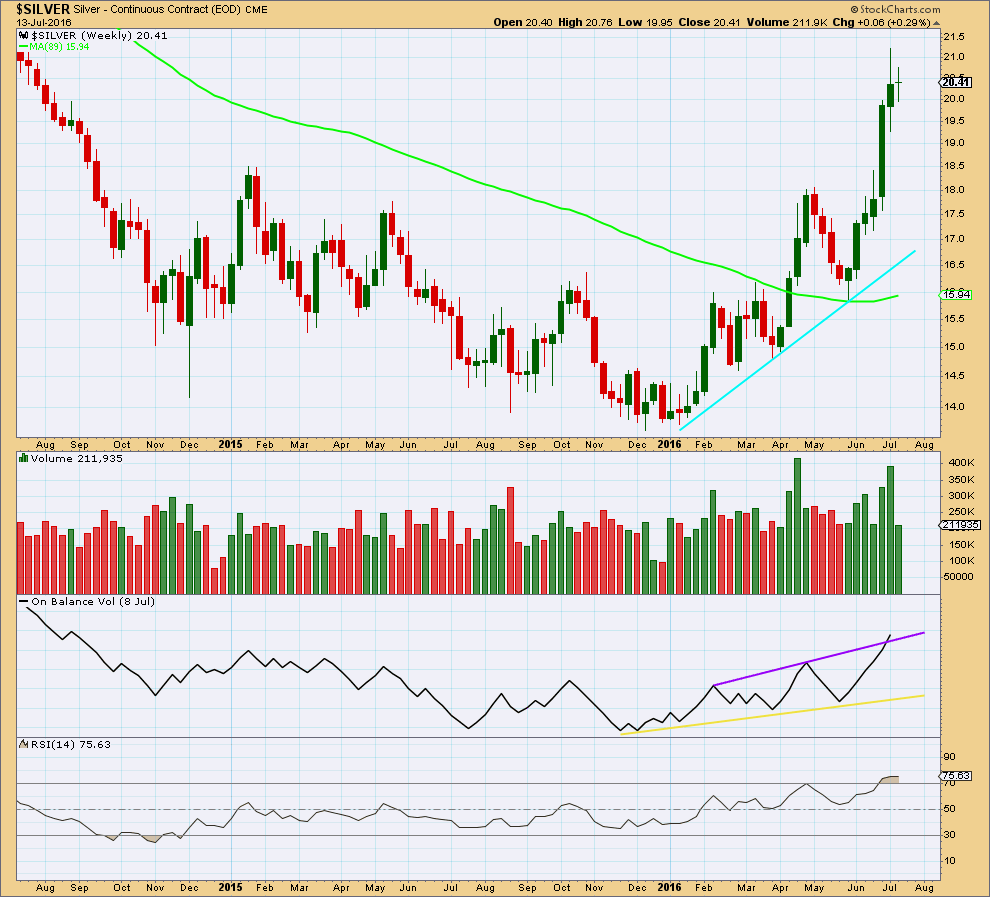
From the low in January, as price rises volume also rises and as price falls volume declines. The volume profile is bullish which supports the wave count.
A support line is added in cyan. If price again comes down to touch it, price should find strong support there.
The upper purple trend line on On Balance Volume may have been slightly breached. This looks like a bullish signal. For the signal to be clearer, one more week of upwards movement from OBV would be required.
RSI is overbought but does not exhibit divergence with price. There is in indication of weakness at the weekly chart level at this stage.
DAILY CHART
Click chart to enlarge. Chart courtesy of StockCharts.com.
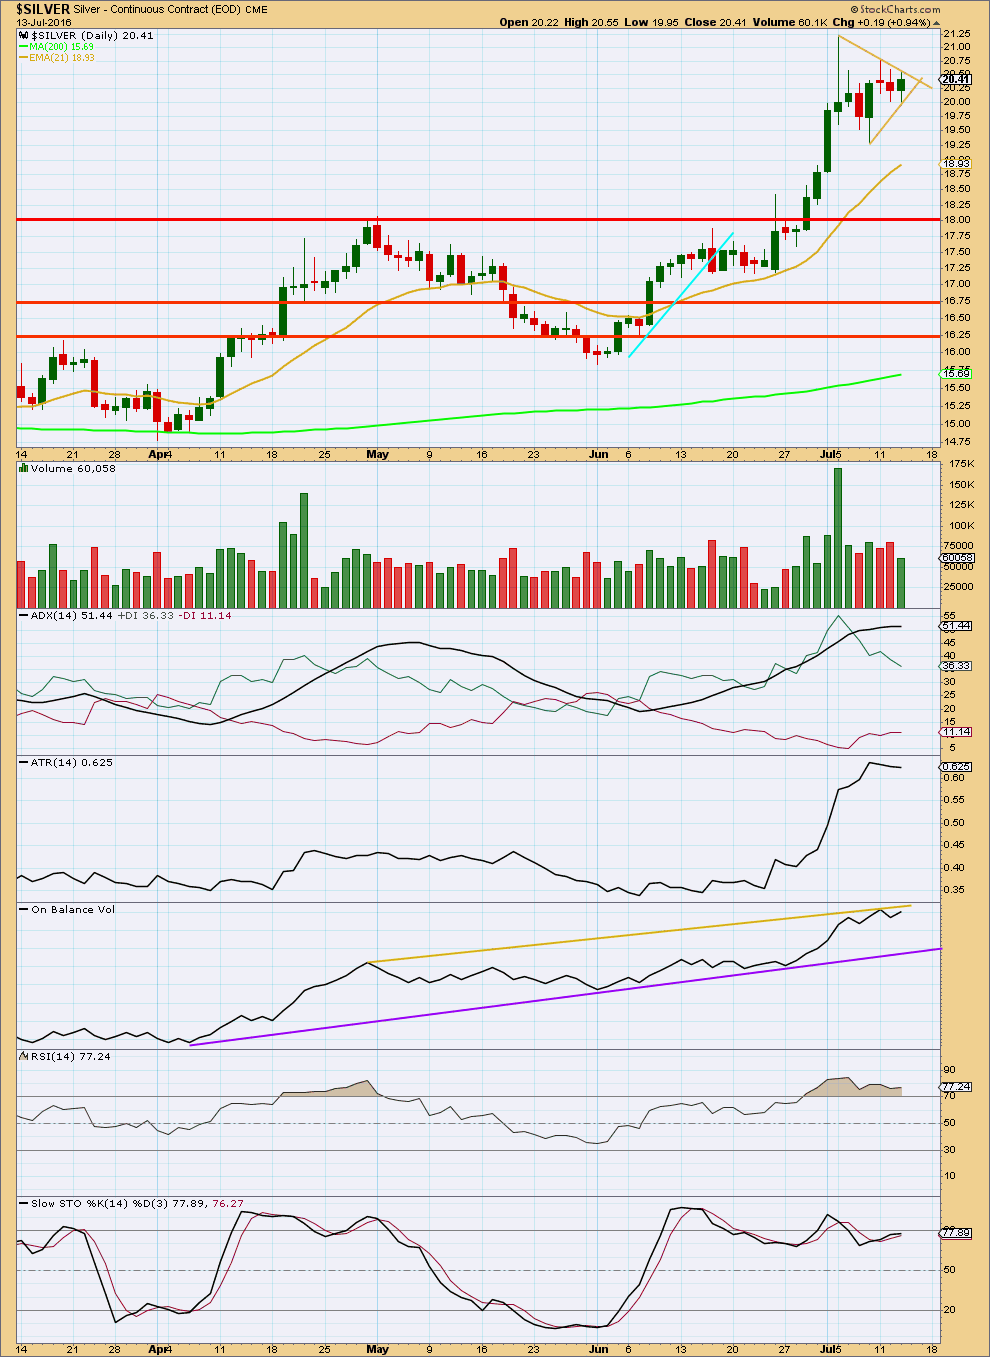
Price is moving sideways in a small pennant pattern, supported by declining volume. Pennant patterns are one of the most reliable continuation patterns. The breakout is highly likely to be upwards.
A conservative target for upwards movement following a breakout from the pennant would be about 23.59. This is conservative because it takes the low of the pole prior to the pennant at 17.59 on 28th of June.
ADX is extreme, over 51. This gives some reasonable cause for concern over the expected upwards breakout from the pennant and the Elliott wave count triangle.
ATR is slightly declining as price moves sideways in a small correction.
On Balance Volume is finding resistance at the yellow line. There is some small bearish divergence between OBV and price at the highs of 6th and 11th of July.
There was no divergence between price and RSI at the last high. RSI is still extreme.
There was divergence between price and Stochastics at the last high. Stochastics has returned from overbought.
This analysis is published @ 03:27 a.m. EST.
Lara,
Was the triangle invalidated today?
Thanks.
With China buying up silver reserves and US having no silver , China will likely move to back the yuan with silver (as the US many tears ago had notes payable on demand with silver ,ier silver certificates, So China and Russia and other Asian countries will push for oil to be priced in a currency that has precious metal backing and r the almighty dollar will no longer be the Reserve currency fot oil purchases or international settlements . Thgis has broad implications . Watch for the price of siver to soar to regain its 15 to one ratio with gold, Buy USLV, CDE, HL etc. Stephen of New London CT. (Hi Lara)