
Upwards movement was expected for the last week, but this is not what happened.
Price broke out of the small pennant pattern downwards.
Summary: Upwards movement is expected to continue. The target is at 24.219. This trend is now extreme, so stops must be used (as always).
New updates to this analysis are in bold.
WEEKLY WAVE COUNT
Click chart to enlarge.
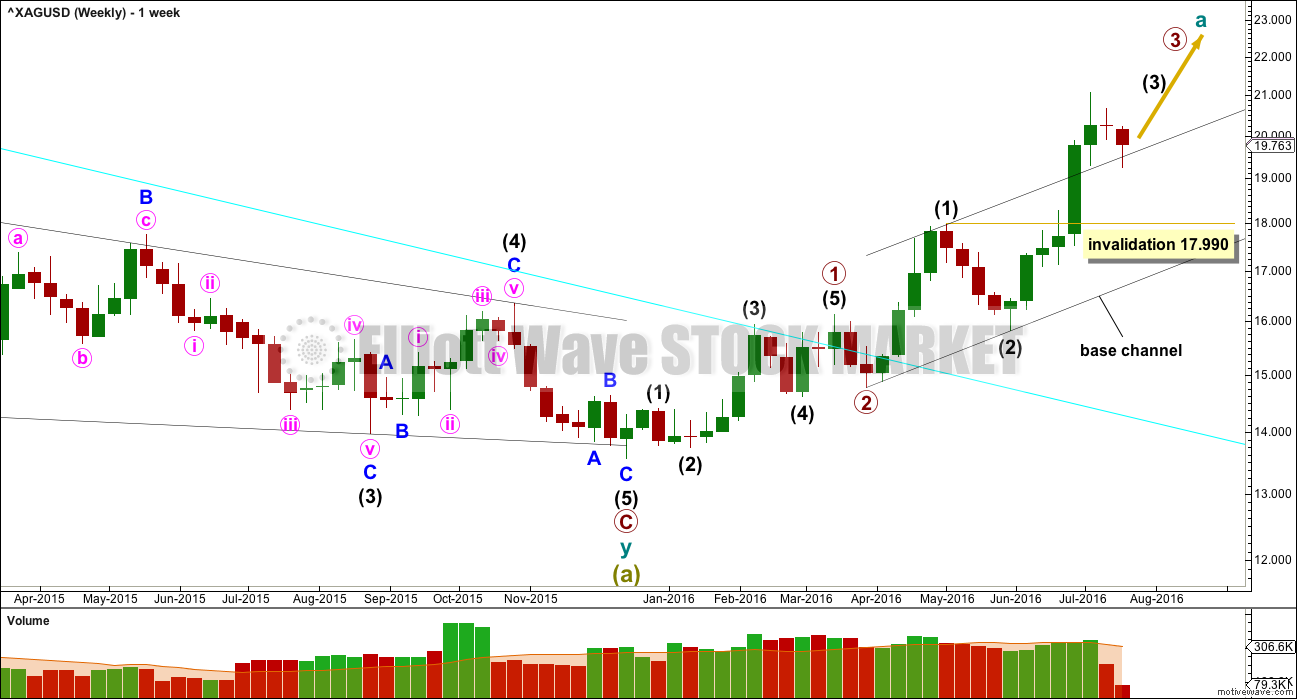
Two first and second wave corrections may be complete. Silver may be ready to move into a strong third wave up.
When intermediate wave (3) is complete, then the following correction for intermediate wave (4) may not move into intermediate wave (1) price territory below 17.990.
Draw a base channel about intermediate waves (1) and (2) as shown. The upper edge is providing support now that price has broken above it. If price makes a deeper than expected correction here, then the upper edge of this channel should provide very strong support.
DAILY WAVE COUNT
Click chart to enlarge.
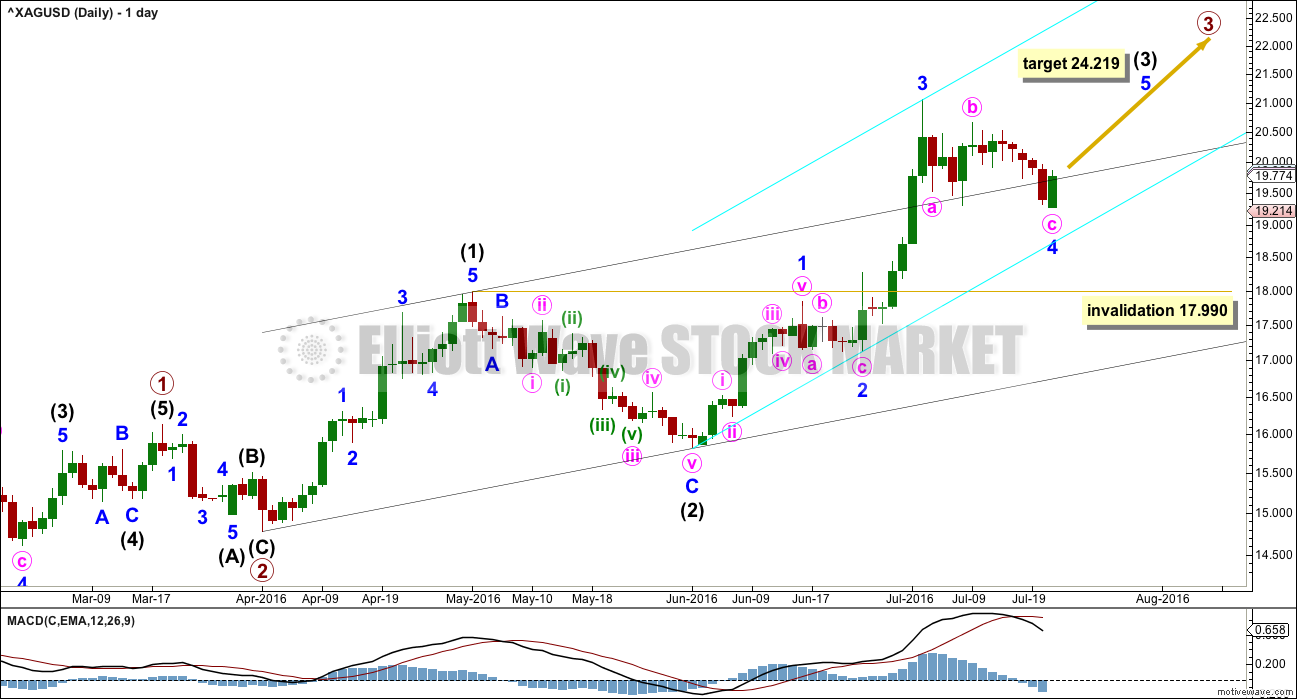
At 24.219 intermediate wave (3) would reach 2.618 the length of intermediate wave (1).
It looks like minor waves 1 through to 4 may now be complete within intermediate wave (3). The next wave up for minor wave 5 to end intermediate wave (3) may be swift and strong.
If minor wave 4 is not over and moves lower, then it may not move into minor wave 1 price territory below 17.990.
If targets are wrong, they may not be high enough. Silver, like all commodities, has a tendency of swift strong fifth waves. They are not necessarily extended in price, but they often are. Look out for surprises to the upside for this market at this time; blowoff tops commonly occur at the ends of third waves.
TECHNICAL ANALYSIS
WEEKLY CHART
Click chart to enlarge. Chart courtesy of StockCharts.com.
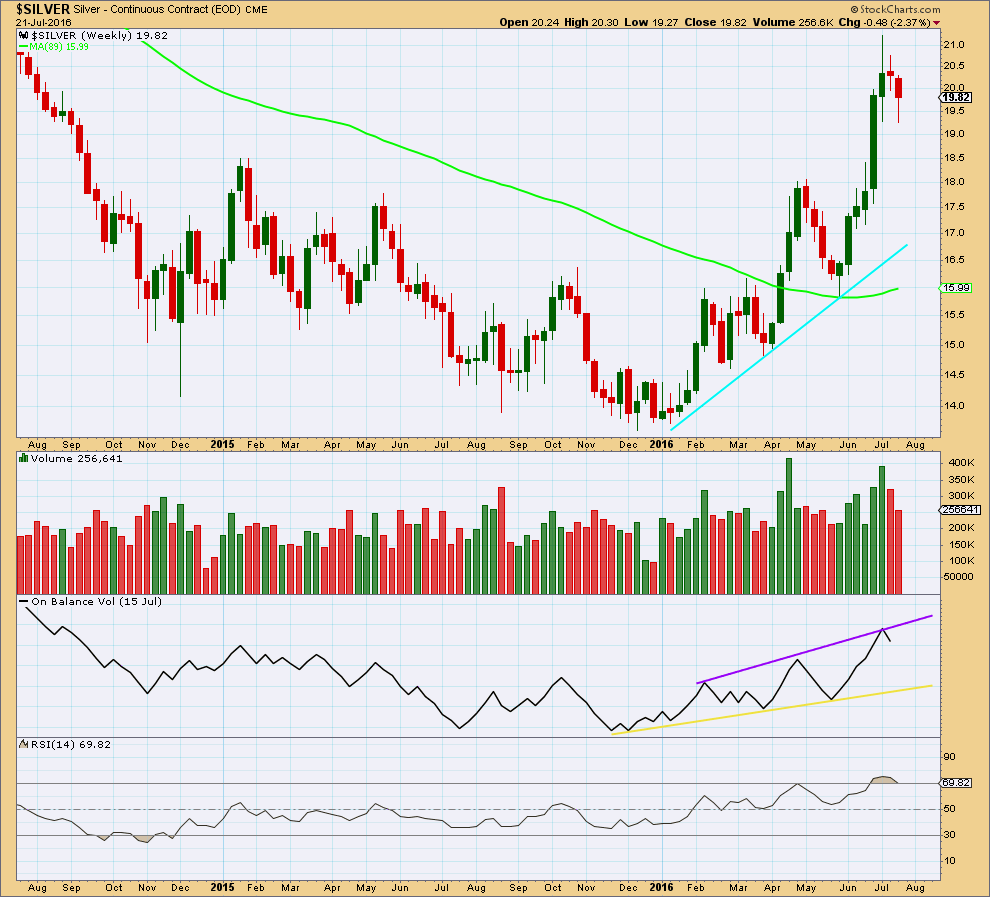
From the low in January, as price rises volume also rises and as price falls volume declines. The volume profile is bullish which supports the wave count.
A support line is added in cyan. If price again comes down to touch it, price should find strong support there.
On Balance Volume breached the upper purple line, only to then turn down and move back below it. The line is now redrawn. A break above this purple line would be a bullish signal.
RSI is overbought but does not exhibit divergence with price. There is in indication of weakness at the weekly chart level at this stage.
DAILY CHART
Click chart to enlarge. Chart courtesy of StockCharts.com.
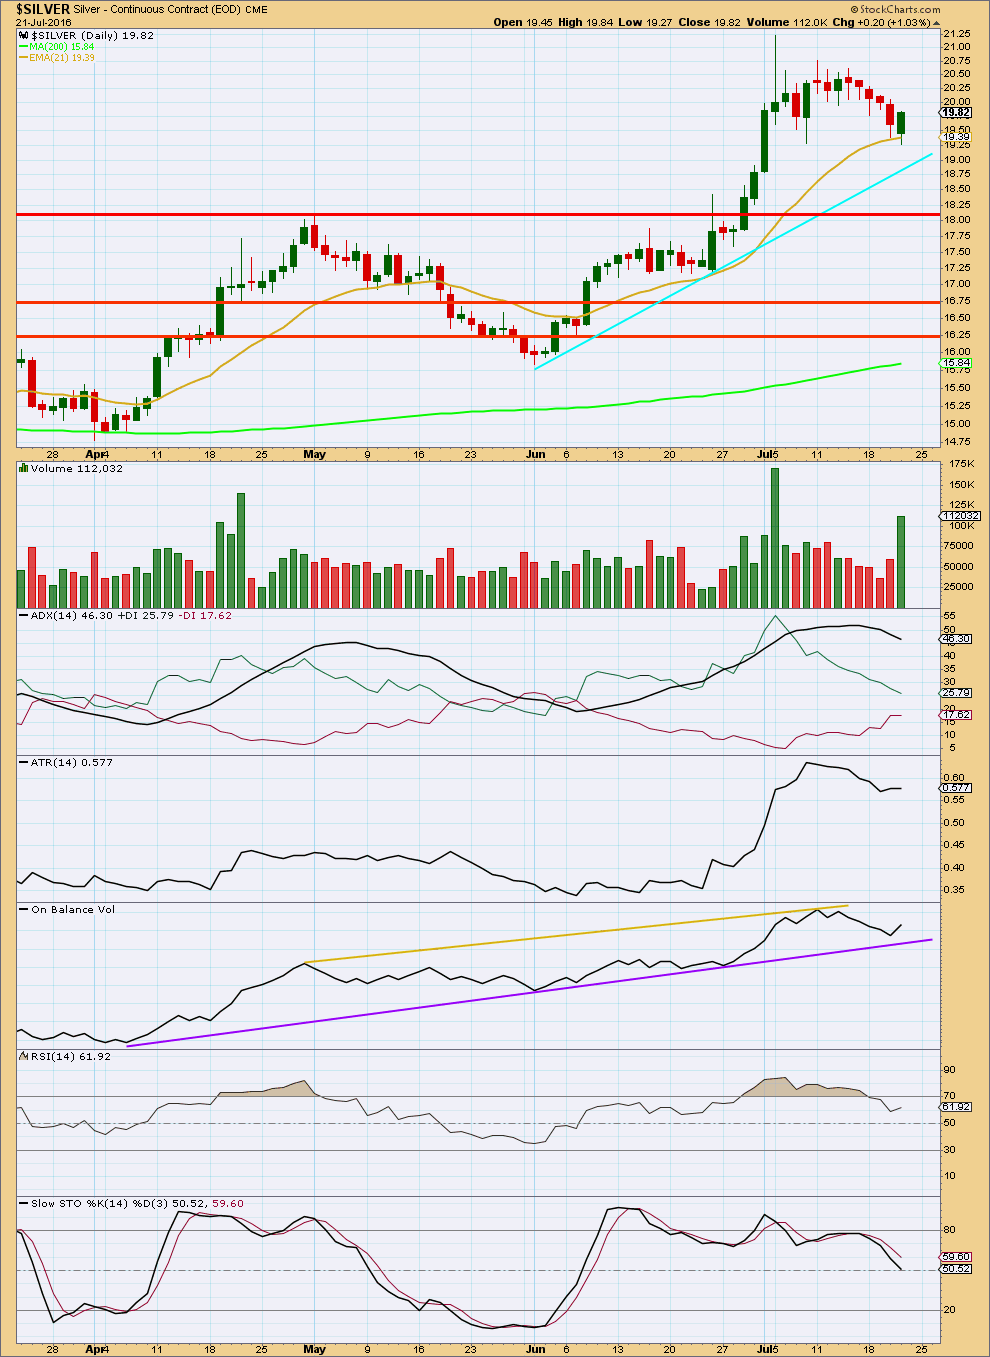
After moving lower for several days on declining volume, Silver is now moving upwards on strong volume. The volume profile is still bullish. It looks like a correction against the trend has just ended.
ADX is extreme and currently declining, indicating the market is not currently trending. ATR is overall flat to declining, in agreement at this time with ADX.
RSI has returned from overbought. There is again room for price to rise.
Stochastics is neutral. There is room for price to rise or fall. Price is finding support at the 21 day moving average.
Overall, the picture looks quite bullish, but I am concerned that ADX is so extreme. The trend should be expected to continue because it has support from volume. But if a blowoff top is seen, then long positions should be exited. This trend is in its ending stages, but that could still take several days to a couple of weeks possibly.
This analysis is published @ 05:07 p.m. EST.
Thanks Lara for the silver analysis… Did you happen to get stopped out of your long position? I thought it would follow gold lower, and it did, but since gold’s low apparently is 13310, then silver has likely bottomed as well and ready for its wave up…
I’m likely going to enter long tomorrow, or Monday… I’m hoping for a small pull back; 19.50 would be great, but the way this is rocketing up, it might not get that low…
I did. I kept my stop too close 🙁
I may try again.