
Again, upwards movement was expected and overall did not happen.
The new low for Friday remains above the invalidation point on the hourly Elliott wave chart.
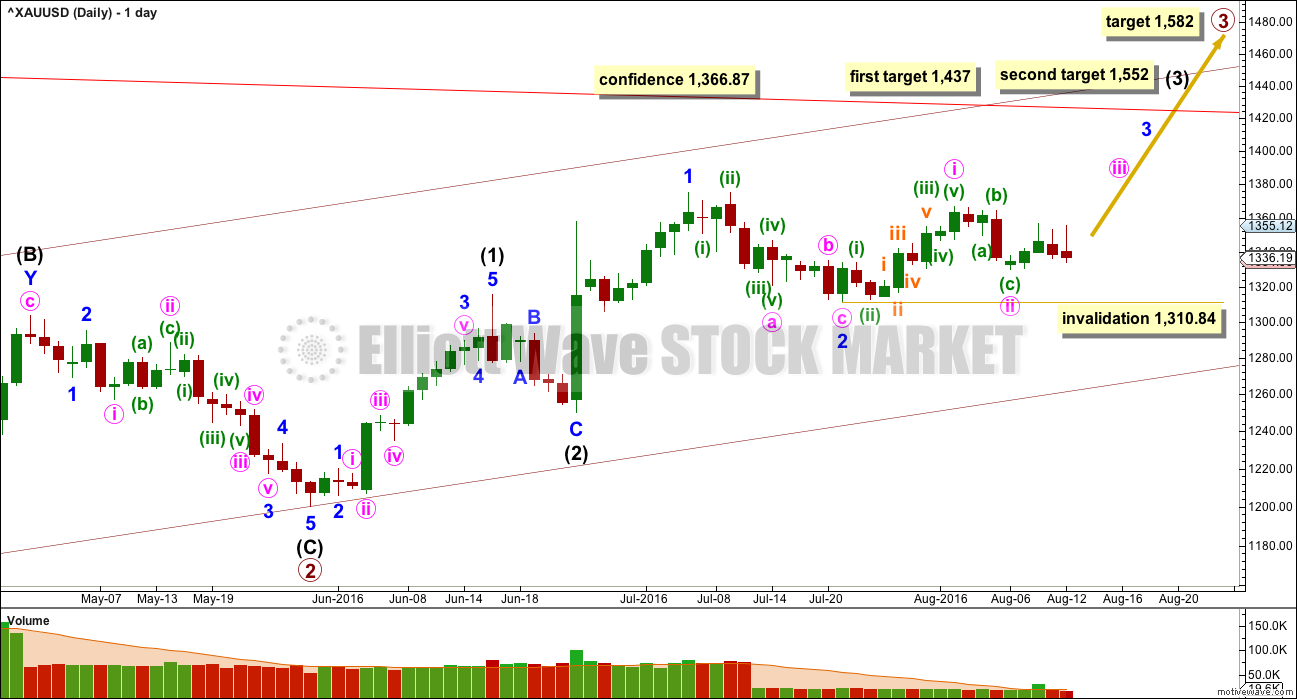
Summary: The target for the main wave count remains at 1,582. Substantial confidence in the main wave count may now be had if price can move above 1,366.87. A new low below 1,310.84 would invalidate the main wave count and confirm an alternate. At that stage, a target for downwards movement to end would be 1,279.
New updates to this analysis are in bold.
Last weekly charts, and a more bearish weekly alternate, are here.
Grand SuperCycle analysis is here.
DAILY ELLIOTT WAVE COUNT
Click chart to enlarge.
Primary wave 2 is a complete expanded flat correction. Price from the low labelled primary wave 2 has now moved too far upwards to be reasonably considered a continuation of primary wave 2. Primary wave 3 is very likely to have begun and would reach 1.618 the length of primary wave 1 at 1,582.
Primary wave 3 may only subdivide as an impulse.
So far intermediate waves (1) and (2) may be complete within primary wave 3. The middle of primary wave 3 may have begun and may also only subdivide as an impulse.
Within intermediate wave (3), the end of minor wave 1 is moved up to the last high. This fits on the hourly chart although it looks odd here on the daily chart. There was a small fourth wave correction up at the end of minor wave 1 and it subdivides on the hourly chart as an impulse. Minor wave 2 may be a complete zigzag, also subdividing as a zigzag on the hourly chart. If minor wave 2 is over, it would be 0.50 the depth of minor wave 1.
No second wave correction may move beyond the start of its first wave below 1,310.84 within minor wave 3.
At 1,437 intermediate wave (3) would reach 1.618 the length of intermediate wave (1). If price keeps going upwards through this first target, or if it gets there and the structure is incomplete, then the next target would be at 1,552 where intermediate wave (3) would reach 2.618 the length of intermediate wave (1).
The cyan support line in last analysis is not working and so is removed. This is of slight concern for the wave count today.
There may now be four overlapping first and second waves complete: primary, intermediate, minor and now minute. This wave count expects to see an increase in upwards momentum.
A new high above 1,366.87 would invalidate the new alternate wave count below and provide price confirmation of this main wave count.
Primary wave 1 lasted 14 weeks and primary wave 2 lasted 12 weeks. Primary wave 3 should be longer in both price and time as it should be extended. It may be about a Fibonacci 34 weeks. So far it has lasted ten.
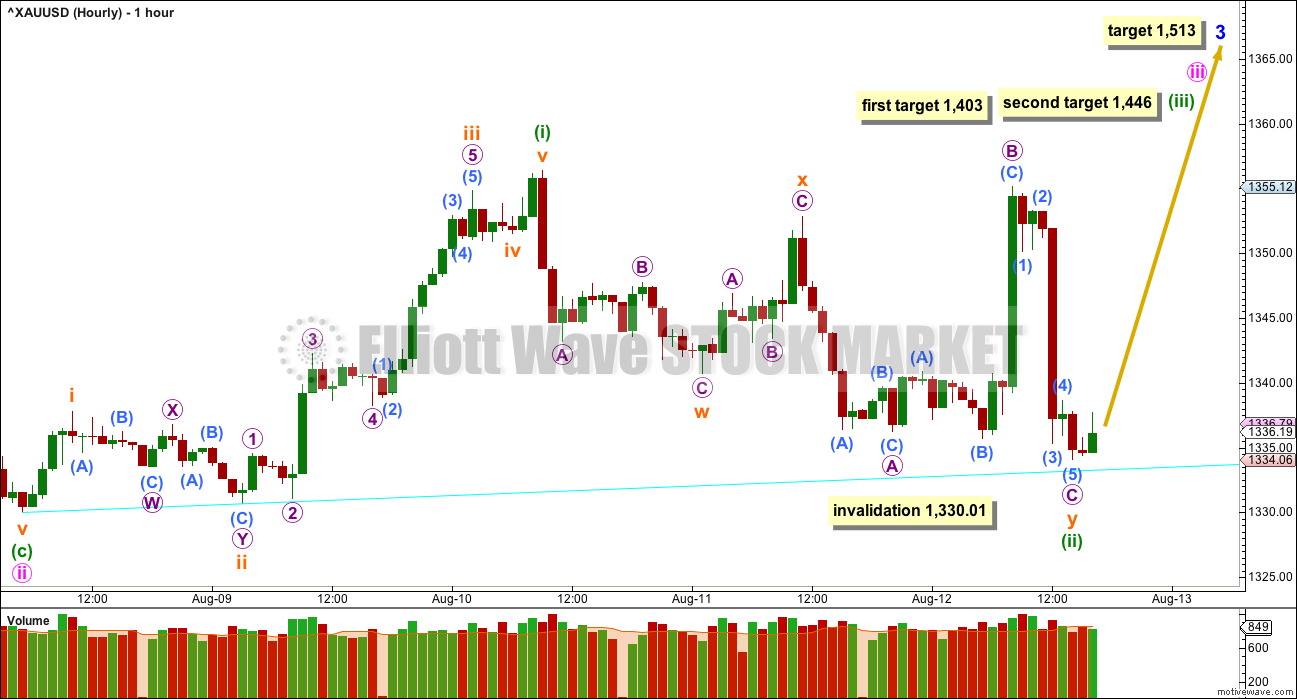
HOURLY ELLIOTT WAVE COUNT
Click chart to enlarge.
Overall, price moved sideways in an increased range for Friday’s session. Friday completed a higher high than Thursday, and a lower low.
Minuette wave (ii) fits as a double combination: zigzag – X – expanded flat correction. Subminuette wave y ended lower than subminuette wave w; the correction has a slight downwards slope. Because subminuette wave x is relatively deep, and micro wave B of subminuette wave y is very deep, the correction still has somewhat a sideways look to it. This is reasonable for a combination.
What does look clear short term is that the wave up labelled minuette wave (i) looks like and fits very well as an impulse and the wave down labelled minuette wave (ii) is more choppy and overlapping, so it looks more corrective.
A cyan support line is drawn short term as shown. Price may find support about this line if this wave count is correct.
If minuette wave (ii) continues any further, then it may not move beyond the start of minuette wave (i) below 1,330.01.
At 1,403 minuette wave (iii) would reach 2.618 the length of minuette wave (i). If price keeps rising through this first target, or if when it gets there the structure is incomplete, the second target would be used. At 1,446 minuette wave (iii) would reach 4.236 the length of minuette wave (i).
The target for minor wave 3 remains the same. At 1,513 minor wave 3 would reach 1.618 the length of minor wave 1.
The short term volume profile for Friday’s movement looks more bullish than bearish. Volume increased as price moved higher to the high for Friday. The rise in price was supported by volume. Thereafter, as price fell to the low for Friday overall volume declined. The fall in price was not supported by volume. There is some small support for this wave count from the hourly volume profile here.
THIRD WAVE EXAMPLE – DAILY CHART
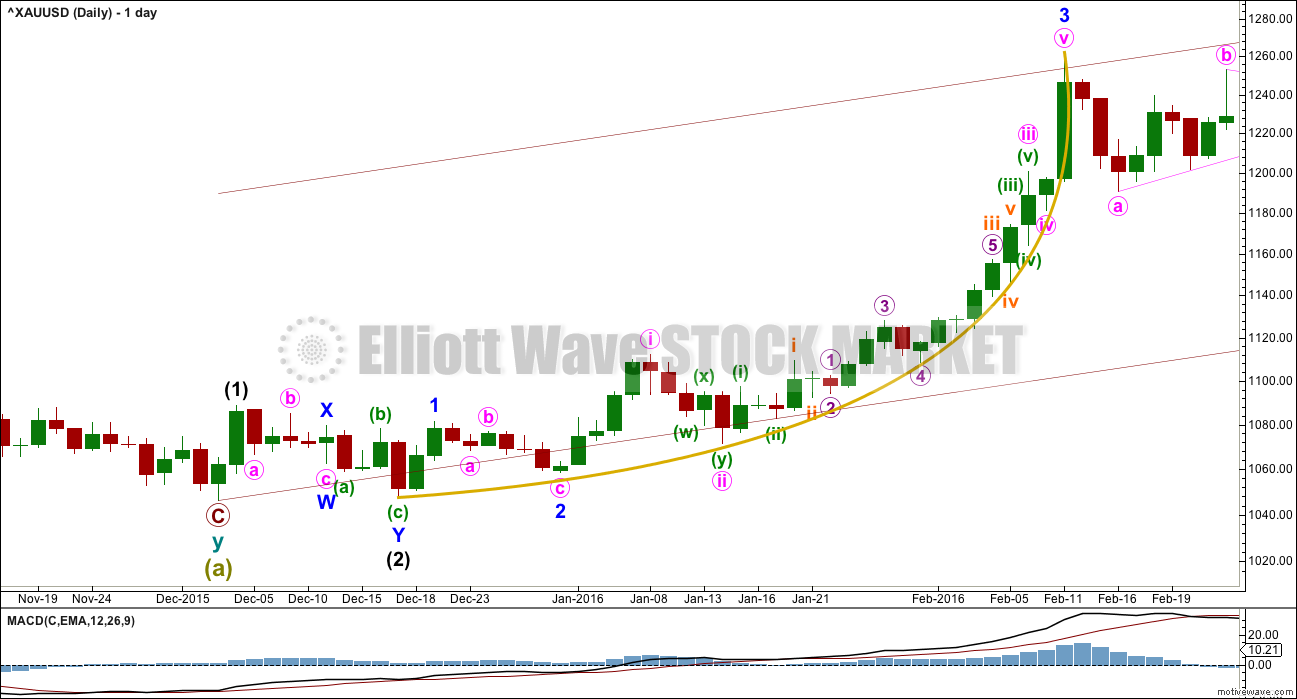
Click chart to enlarge.
In discussing the curved look to Gold’s impulses, particularly for its third waves, here is an example.
Within primary wave 1, the third wave of minor wave 3 had a strong curved look to it. The impulse begins more slowly and has deep and relatively time consuming second wave corrections: Minor wave 2 was 0.68 of minor wave 1, minute wave ii was 0.76 of minute wave i, minuette wave (ii) was 0.56 of minuette wave (i), and subminuette wave ii was 0.64 of subminuette wave i.
The curved look comes from the disproportion between second and fourth wave corrections within the impulse. Here, minute wave ii lasted 4 days and shows clearly on the daily chart yet minute wave iv was over within one day and does not show up with any red candlesticks or doji on the daily chart.
Momentum builds towards the middle of the impulse, continuing to build further during the fifth wave and ending in a blowoff top. This is typical of Gold and all commodities.
This tendency to blowoff tops and curved impulses is particularly prevalent for Gold’s third waves.
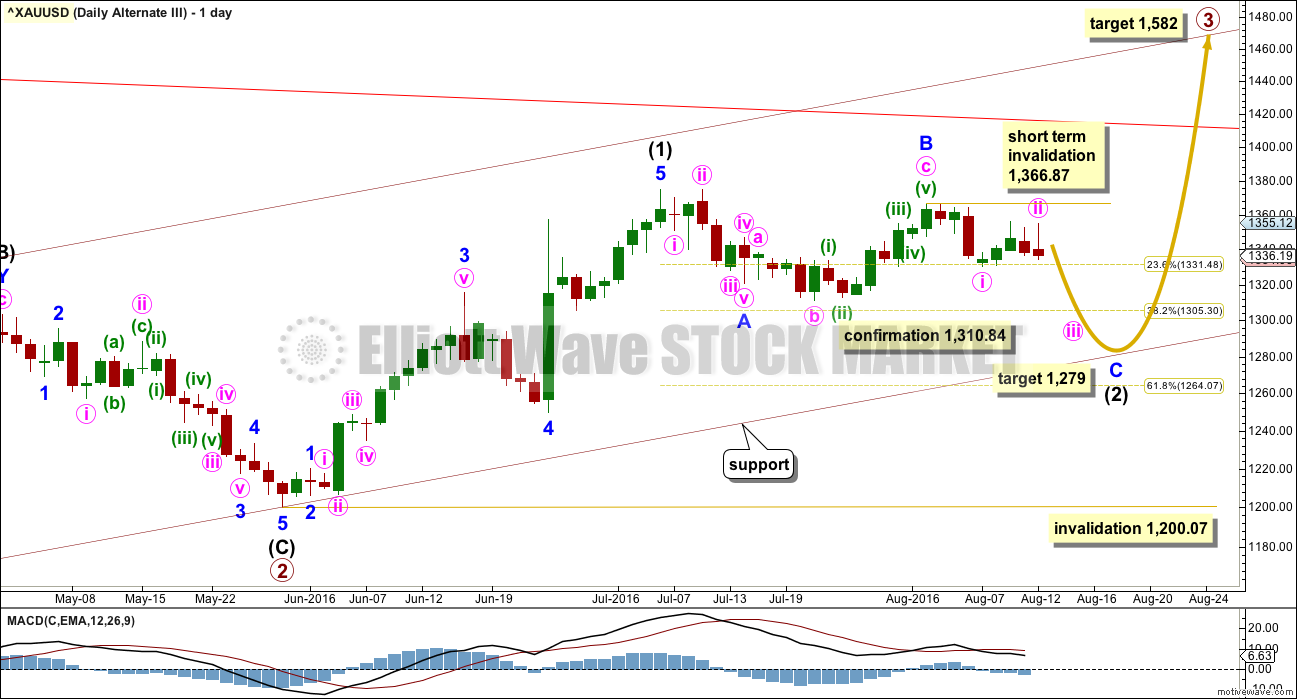
ALTERNATE DAILY ELLIOTT WAVE COUNT
Click chart to enlarge.
This wave count is identical to the main wave count up to the end of primary wave 2. Thereafter, what if only intermediate wave (1) ended at the last high?
This movement will fit as a five wave impulse, although it does not have a very good look on the daily chart. This reduces the probability of this wave count.
If intermediate wave (1) was over at the last high, then it may have lasted 27 days. So far intermediate wave (2) may have taken 25 days and would still be incomplete. The proportions of this part of the wave count look slightly better than the main wave count.
There is a problem now with structure on the hourly chart within minor wave C. Minute wave i would have to be complete. It will fit on the hourly chart, but it does not have a good look as a five and looks better as a three on the hourly and daily chart levels. This slightly reduces the probability of this wave count.
Within minor wave C, minute wave ii may not move beyond the start of minute wave i above 1,366.87.
Minor wave C must be a five wave structure. So far within it minute waves i and ii would be complete. Minute wave iii downwards should be underway.
At 1,279 minor wave C would reach 1.618 the length of minor wave A. Price may end downwards movement when it finds support at the lower edge of the maroon base channel drawn about primary waves 1 and 2.
Intermediate wave (2) may not move beyond the start of intermediate wave (1) below 1,200.07.
ALTERNATE HOURLY ELLIOTT WAVE COUNT
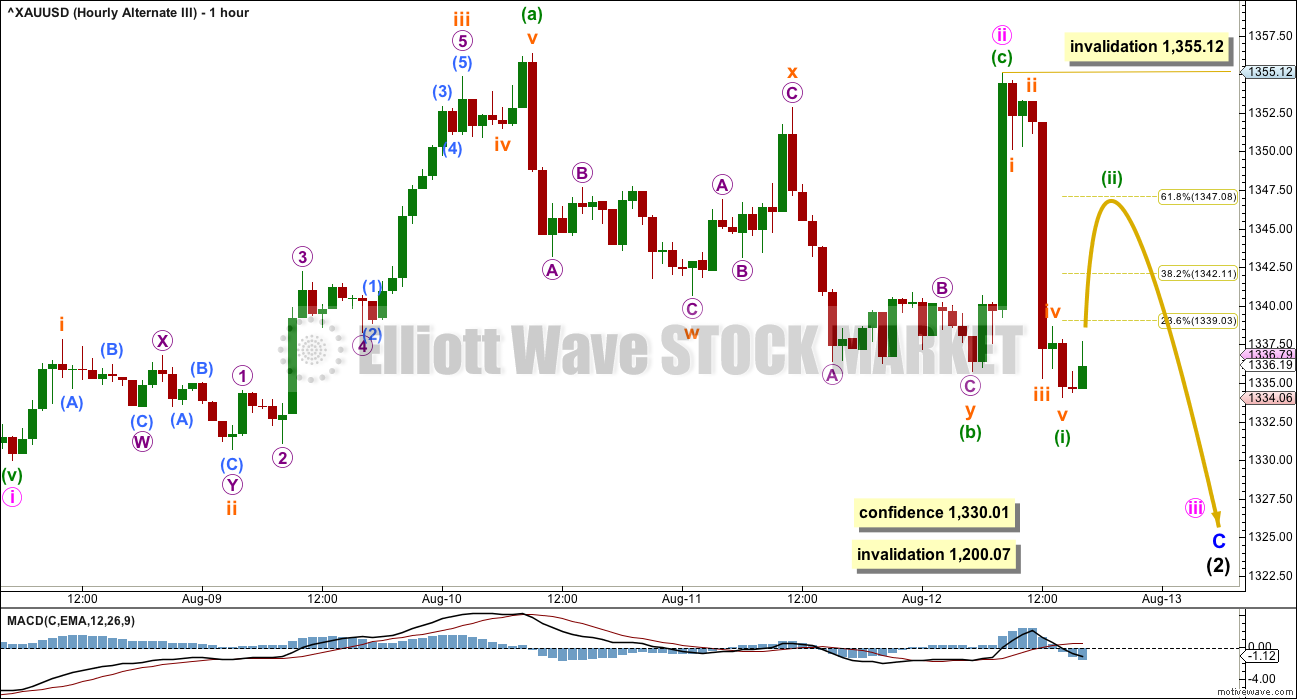
Click chart to enlarge.
In order to make a reasonable judgement of each Elliott wave count, it is at this stage important to see how each wave count sees recent structure at the hourly chart level.
For the subdivisions to fit best minute wave ii may be a completed zigzag with a truncated C wave for minuette wave (c) of 1.24. The truncation is not too large to be acceptable, but it is not small either. This is possible, but it does necessarily reduce the probability of this wave count.
When markets open on Monday a new high above 1,355.12 would invalidate this alternate at the hourly chart level, that would add a little confidence to the main wave count.
A new low below 1,330.01 would add some confidence to this alternate. A new low below 1,310.84 would confirm it.
TECHNICAL ANALYSIS
WEEKLY CHART
Click chart to enlarge.
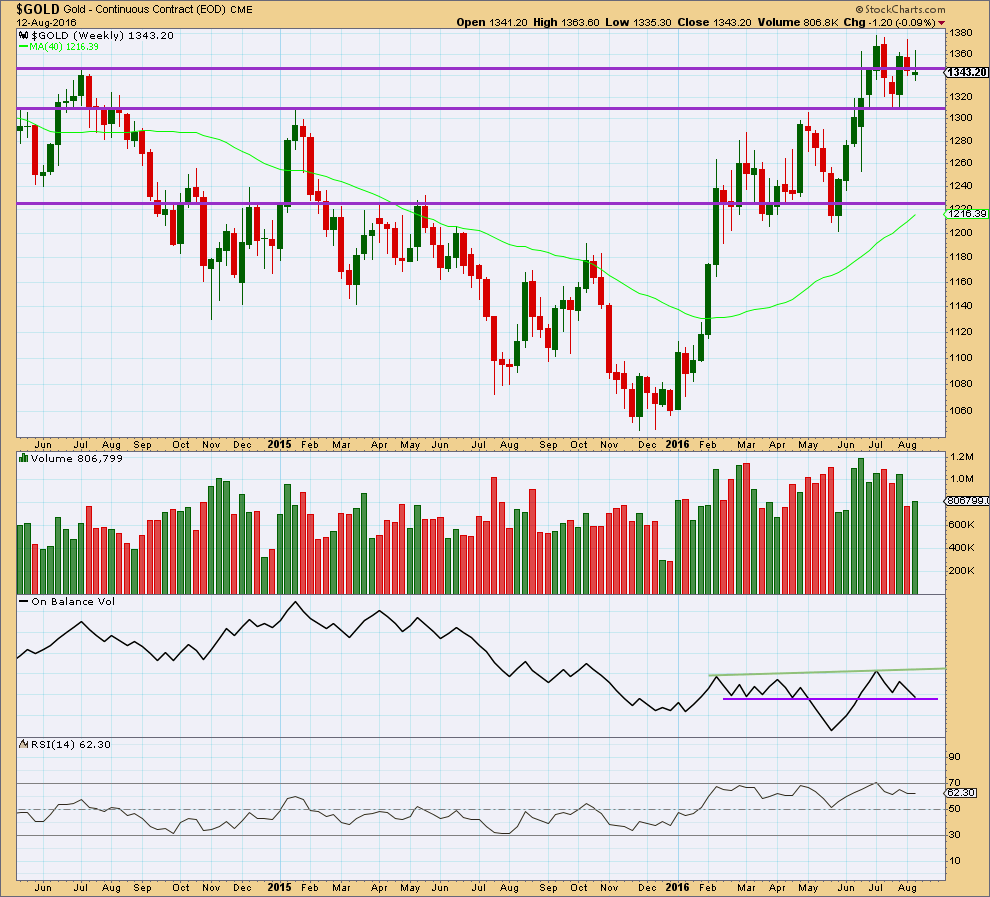
This week completes a lower high and a lower low. The week closed slightly above the open and the candlestick is green but not by much. Overall, this week looks corrective. A slight increase for a green week gives slight support to a bullish wave count.
If the lower purple line on On Balance Volume is drawn carefully across 7th of March and 18th of April, then it was touched at the end of this week. This trend line has been weakened with OBV breaking below and then returning above it, but it still has some technical significance. A break below the purple line would be a bearish signal but a relatively weak one. A break above the green line would be a bullish signal.
RSI is not extreme. There is room for price to rise or fall.
DAILY CHART
Click chart to enlarge.
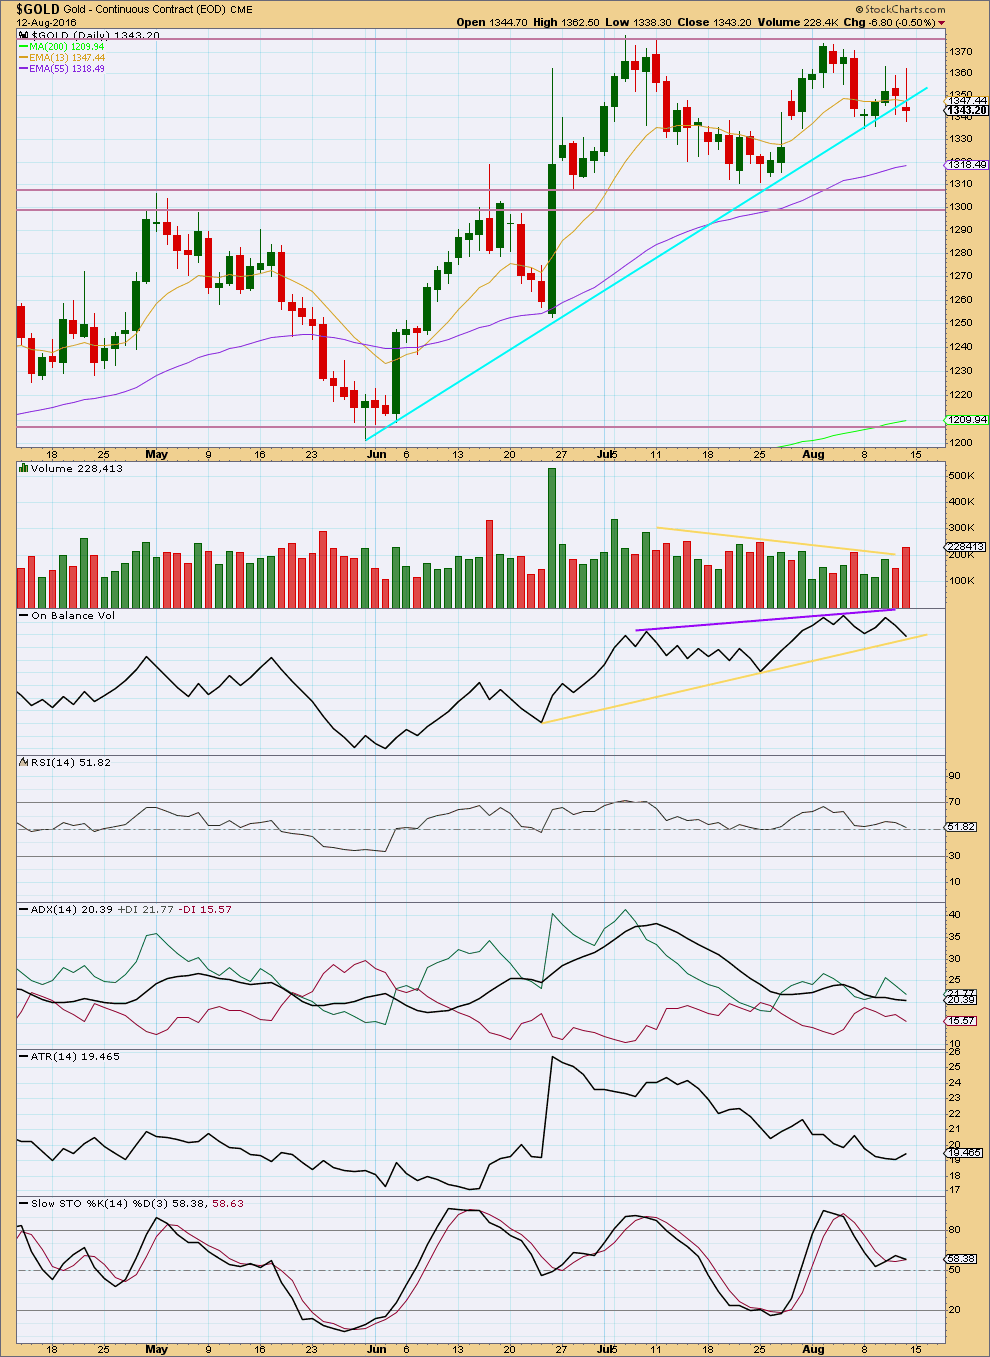
There is a large discrepancy for the volume data for Friday between StockCharts and COMEX (seen on the main daily Elliott wave count).
COMEX data shows volume for the upwards day of 10th of August was the highest day this week at 30.4K. Thereafter, the downwards day of 11th of August at 19.2K and the downwards day of 12th of August at 14.6K. COMEX volume data is bullish: the rise in price early in the week was supported by volume and the fall in price down to Friday was not supported by volume.
StockCharts data shows increased volume for 10th of August; the rise in price was also supported by volume. But thereafter the fall in price for Friday shows the strongest volume for the whole week. The fall in price had more support from volume. StockCharts volume data is bearish.
On Balance Volume may give some clues as to which direction price is more likely to move next.
At the end of this week, OBV is finding support at the yellow trend line. In the first instance, this line should be expected to provide support and initiate a bounce from price here. At the end of this week, there is some small divergence with price and OBV between the lows of 8th of August and 12th of August: OBV has made a lower low but price has made a slightly higher low. This divergence is bullish and indicates weakness to the downwards movement from price.
OBV tends to work better with trend lines than it does with divergence, but both will be noted.
RSI is neutral. There is plenty of room for price to rise or fall here.
ADX today is declining, indicating the market is not trending. ATR is increasing, but with the increase for only one day this is not yet very clear. Overall, it should be expected that this market is still range bound and consolidating. Price is range bound with resistance about 1,375 and support about 1,310. The bottom line is a breakout has not yet occurred, and only a break above or below these price points would be a reliable indication of the next direction for price.
During this sideways movement, it is still the upwards day of 8th of July which has strongest volume. This suggests an upwards breakout is more likely than downwards. This trick usually works for Gold (usually is not the same as always, just more often than not).
On balance of probability the main wave count is still slightly more supported by classic technical analysis than the alternate, but there is enough bearishness for the alternate to be a necessary addition.
This analysis is published @ 05:40 a.m. EST on 13th August, 2016.
And again it looks like volume data between StockCharts and COMEX will be wildly different.
I’ll consider both.
COMEX has strongly higher volume for todays upwards day and the last upwards day of 10th August. It’s short term bullish.
StockCharts has the strongest recent volume for the downwards day of 12th August. It’s short term bearish.
Unfortunately the small movement for Mondays session so far also fits the alternate wave count. And so does the short term hourly volume profile.
Short term at least expect more upwards movement to 1,347.
How high this wave goes is going to tell us which wave count is correct.
The main wave count still has higher probability.
Just to be clear, this chart here is the alternate.
The chart below is the main, preferred wave count.
There is some good support from volume this morning for the upwards movement today. So although the range is small, the volume profile is bullish.
Hi pete & dsprospering.
I cannot venture a count at this point due to the discrepancy in the price data which I highlighted last week.
If I stick to the pmbull chart, then I’m still looking for a low below 1330.30. To me, that constitutes the third wave (submicro 3) and today’s high at 1343.95 is submicro 4, a nice three waves up. If I’m right, then price will now be dropping below 1330.30 to avoid a truncation.
If Lara’s count is correct, then we are rising in micro 1. But, the big drop in the miners runs contrary to this.
Alan, you mentioned, “If I stick to the pmbull chart, then I’m still looking for a low below 1330.30. ”
You think the alternate is more likely?
Lara – “A new low below 1,330.01 would add some confidence to this alternate.”
Below 1330.30 is the hourly alternate validation point.
No. The alternate also has the same problem.
Minuette 1 in that case would still be 3 waves.
So, until there is a low below 1330.30, or pmbull data is wrong, I cannot find a solution to this matter.
I’ll have to let further developments prove it one way or the other.
Thank you for touching base w/your brother. I had all he mentioned ‘intact’. I emailed pmbull.com and I have purchased a new trading computer. When it comes in, and technicians help me set it up, I will ask them their thoughts about making the TLns remain visible on PMbull. (You never know – some of them trade.)
I’m currently on Windows 7-64b, new one will be W10-64b, always Chrome. Although their is a NEW browser, ‘BRAVE’ started by a lead technician @ Firefox. I just started using it because Firefox ‘crashes’ too much. I’ll post if I learn anything helpful.
I’m curious….you noted 1, 5, 15, 39, 78 min charts; rather than 1, 5, 13, 34, 55, 89 (fib). Why? [I did note- 39 + 78 divide evenly by 3.]
Thanks…
At this point gold is stronger than the miners today.
NUGT since 10:52 high is in a bearish trend at multiple time frames 1,5,15,39, and 78 minutes.
Wed. Thurs, Friday and today NUGT basically peaked from the open until 11:00 am then dropped around until 3:00 pm or later.
In the weekend video Lara did mention that gold may bounce up Monday to 1,347.08 the .618 Fib. then drop.
She was referring to the alternate.
The flash charts at PMBull.com don’t show up correctly on my MacBook Pro running Safari (Chrome yes, Safari no), but the non-flash charts are fine. They are generated by a little javascript widget freely available from Dukascopy Bank, a Swiss bank that appears to specialize in Forex trading.
https://www.dukascopy.com/trading-tools/widget/chart
I’ve grabbed the widgets for Oil and Gold, hacked them to suit me, and posted them on my own bare-bones web pages with no advertising. It’s really easy to do this yourself if you have access to a web server. If not, anyone here is welcome to use these links if you’d like to. I plan to keep them up the way they are indefinitely.
Oil (1hr Candlesticks):
http://track17.com/charts-oil.html
Gold (1hr Candlesticks):
http://track17.com/charts-gold.html
Oil and Gold together on the same page:
http://track17.com/charts.html
(Unfortunately, I don’t see GDX as an option for these non-flash charts.)
Today is another day to sell at the gold and miners morning high at 10:52 am and buy cheaper. NUGT just make a new day low at 1:20 pm.
Maybe if I meditate and pray enough an EW count may miraculously appear. LOL!
Oh, EW Gods, please send us a count.
We have been faithful and believed in you. LOL.
Hello everyone,
what is the preferable Elliott Wave count.
Has minuette wave (ii) finished?
Thank you
Has anyone been able to differentiate yet whether we’re in minuette iii up per hourly, or the minuette ii per alternate hourly? Just wondering.
My favorite miner GORO, just bought a 100% stake in a high grade ( around 191K onces at 2.2 ounces per tonne) project in Nevada. This I consider great news for the company’s future. The location removes political risk, and the rich deposit ensures that GORO can continue to pay shareholders dividends in the metal with minimal hedging of future production. It has been an awesome ride so far (in at under 2.00 per share!) Even with the miniscule yield of 0.31% to date, as soon as the general public figures out that there is a gold company that actually pays its dividend in the metal, I expect the price to easily eclipse its high of above 30.00 per share. I would not be surprised to see a richer yield as the price of the metal continues to head North and GORO’s profits increase….
Thanks for the tip Verne!
Most welcome Lara! I think this one’s a keeper! The coins they send you are absolutely gorgeous! 🙂
WEDNESDAY, AUG. 17 2:00 pm FOMC minutes 7/27
As economy gyrates through tepid growth, Fed minutes may offer clues
Aug 15, 2016 10:44 a.m. ET
http://www.marketwatch.com/story/as-economy-gyrates-through-tepid-growth-fed-minutes-may-offer-clues-2016-08-13
Hello Richard,
would you please let me know what is the current Elliott wave count.
thank you very much.
I think despite all the media hype around FED bloviation, they are largely irrelevant. If the 30 yr bond has actually put in a multi decade high as I think it has, it really does not matter what hot air comes out of the FED, rates globally are going higher.
Good morning Gold,
What is the current Elliott Wave count?
Thank you!
10:36am Dollar edges lower against euro, yen as September rate hike looks unlikely.
Stocks edge to all-time highs as oil futures rally
Aug 15, 2016 11:24 a.m. ET
New York region manufacturing weakens in August
http://www.marketwatch.com/story/us-stock-futures-inch-higher-ahead-of-empire-state-reading-2016-08-15
The Empire State manufacturing index for August fell to negative 4.2 from 0.6 in July, the fourth time this year the reading has been in negative territory.
Oil futures CLU6, +2.54% traded sharply higher amid hopes for a production freeze, helping sentiment.
pmbull.com daily chart for GDX and it also has other Gold or Silver ETF’s
http://www.pmbull.com/gold-etfs/gdx/
Can anyone say whats happening in crude..??..
My fault..I discontinued elliott services for a month n unable to access it… 🙂 ..
Click on Lara’s latest oil analysis. She posted an updated chart a few hours ago in the comment thread.
Lara’s analysis for oil is essential if you continue to trade it as it is tricky.
I wouldn’t trade anything without Lara’s analysis, that’s my priority.
Actually the optimal for oil is if Lara might consider doing daily analysis for oil if possible or enough demand. Meanwhile I’ll stick with gold miners.
There’s enough demand, I’m pretty sure of that.
The limiting factor is my time and sanity 🙂
“The Gold Miners millionaire’s trade long-setup” –
GUNNER24 Forecast – August 14, 2016
http://www.gunner24.com/newsletter/nl-081416/
So…Richard…you have the same issue as I with pmbull ‘live’ charts. I’ll be interested to see what your brother suggests to get the trend lines to remain visible.
By the way Gunner24.com….well thought out charting and interestingly suggests similar scenarios to Lara’s levels.
Have a good night…
Melanie, right now I don’t get trend lines with any time frame.
Here is my brother’s answer about pmbull trend lines not showing up.
He is his company’s PC trouble shooter.
Hello Richard , It shows as …LIVE GOLD on the bottom of chart, they do show on my Windows 7 of with Chrome browser, they also do the same on my Home PC with Windows 10 and Chrome. They stay and do not disappear , they stay no matter what time frame l use, daily or hourly or 5 min or any other time frame, l did not make any adjustments to my PC or monitor to make this happen. For all the samples of charts the lines appeared right away , I did not have to do anything.
Have you updated your Adobe products like Reader or Flash, in case they affect it? Did you Google that question?
According to the Daily Gold, gold is following the path of many previous bull markets
Sentiment Speaks: Time To Buy Gold To Prepare For A Stock Market Crash?
Avi Gilburt EW – Aug. 12, 2016 9:55 AM ET
http://seekingalpha.com/article/3999138-sentiment-speaks-time-buy-gold-prepare-stock-market-crash
I agree steve but as lara said that we can not be sure in judging the trend on trend lines bcoz sometyms these lines want to fool traders.Apart from this i feel that for a trend change these lines should be breachd by a full candlestick…atleast…
Rambus on the HUI. Looks like 380 is the next target. That’s a 36% gain!
https://rambus1.com/2016/08/12/hui-update-287/
GDX close-up on the daily
GDX Weekly
It looks like the Bears regained control yesterday. I’m surprised Lara did not mention the break of trend from $1200 on daily chart. Nothing bullish about it. It tried to bounce off of it, then failed and closed below. Not getting super bearish here, but hard to see gold rising from here at this moment.
Which trend got broken steve ?
What are you talking about ?
Look at the daily chart posted under technical analysis and the cyan trend line
I did notice that. I could have made more of it…. but didn’t. With price finding support close below it and not making a new low below the low 5 days ago I decided to not put too much emphasis on it.
That may turn out to be a very bad call… or not.
Sometimes trend lines just don’t always work perfectly.
We shall see.
But TBH it is one reason why I thought it was time to offer an hourly chart for the alternate. That, and seeing how the structure is different for the two counts.
the trend still remains up. I’m not an expert and wave counts aside, I’m thinking it will make a lower low below $1310 before resuming higher. The correction looks incomplete and Friday’s action suggests it needs to go lower first. Let’s not forget it hasn’t even retraced 38.2% from $1200-$1375. I’m hoping it completes this coming week.
Lara found this on Yahoo!!!!
New Zealand surfer discovers why touching a whale is a bad idea
http://www.grindtv.com/wildlife/new-zealand-surfer-discovers-touching-whale-bad-idea/#8JFyf5vepbZ8QVi2.97
Hahahahaha
Yeah, not a good idea getting that up close and personal with a whale.
That’s not a surfer though. He’s a paddle boarder, we call them “SUP’s”. They go out to sweep up the ocean, keeping it clean 🙂
I can’t stand SUP’s. Seems there’s a bunch of folks (mostly older, mostly guys) who can’t surf but can stand on one of those things. They then take them out into crowded surf spots. Large heavy boards, waves, crowds… they’re an accident waiting to happen.
And not being surfers they have no idea of give way rules and etiquette. Rude and dangerous. I can’t stand them.
I’m in volunteer Marine Rescue. We call paddle boarders ‘speed bumps’ when we’re out on an emergency mission. 😉
LOL
We have surf here this weekend for the first time in almost a month (my arms are officially now noodles and my feet went blue with cold today… super happy!)
I had a collision with a SUP yesterday 🙁
But then today, met a really nice one who was friendly and said he didn’t mind sharing waves 🙂