
Upwards movement was expected for Monday’s session, which is what happened although price moved higher in a very small range.
Summary: The target for the main wave count remains at 1,582. Substantial confidence in the main wave count may now be had if price can move above 1,366.87. A new low below 1,310.84 would invalidate the main wave count and confirm an alternate. Prior to that, a new low below 1,330.01 would shift probability from the main to the alternate wave count. A target for downwards movement to end would be 1,279.
New updates to this analysis are in bold.
Last weekly charts, and a more bearish weekly alternate, are here.
Grand SuperCycle analysis is here.
DAILY ELLIOTT WAVE COUNT
Click chart to enlarge.
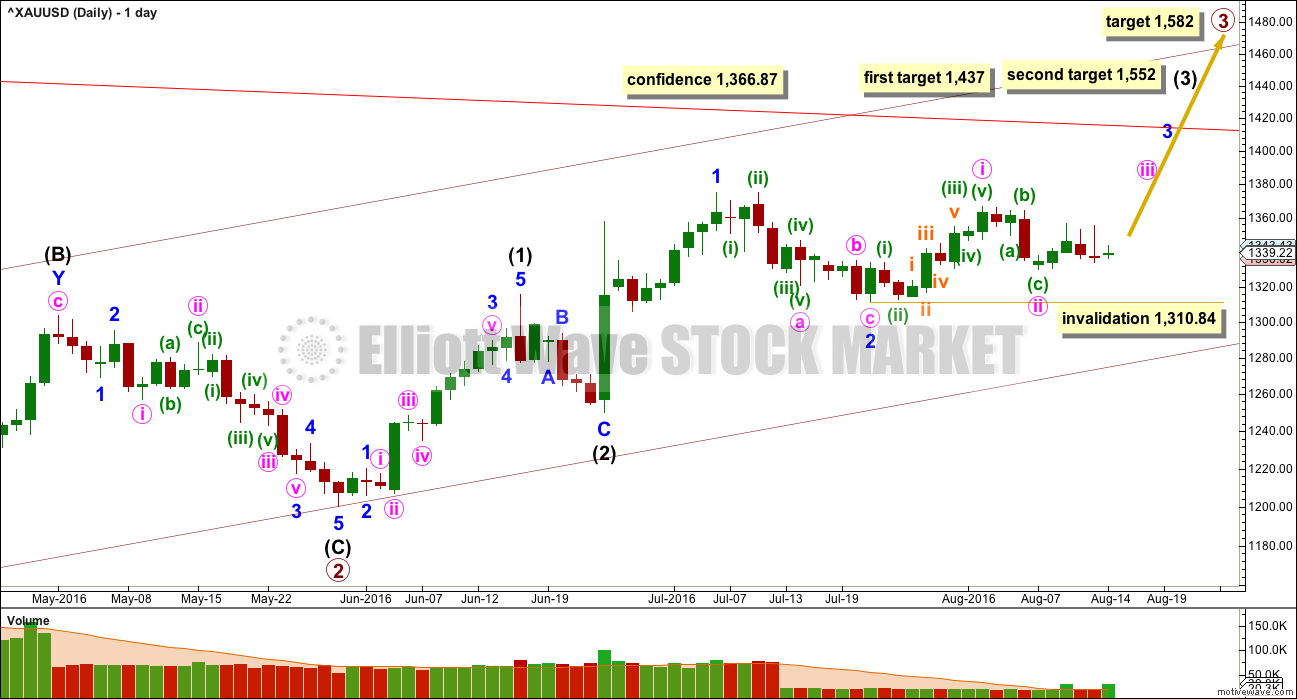
Primary wave 2 is a complete expanded flat correction. Price from the low labelled primary wave 2 has now moved too far upwards to be reasonably considered a continuation of primary wave 2. Primary wave 3 is very likely to have begun and would reach 1.618 the length of primary wave 1 at 1,582.
Primary wave 3 may only subdivide as an impulse.
So far intermediate waves (1) and (2) may be complete within primary wave 3. The middle of primary wave 3 may have begun and may also only subdivide as an impulse.
Within intermediate wave (3), the end of minor wave 1 is moved up to the last high. This fits on the hourly chart although it looks odd here on the daily chart. There was a small fourth wave correction up at the end of minor wave 1 and it subdivides on the hourly chart as an impulse. Minor wave 2 may be a complete zigzag, also subdividing as a zigzag on the hourly chart. If minor wave 2 is over, it would be 0.50 the depth of minor wave 1.
No second wave correction may move beyond the start of its first wave below 1,310.84 within minor wave 3.
At 1,437 intermediate wave (3) would reach 1.618 the length of intermediate wave (1). If price keeps going upwards through this first target, or if it gets there and the structure is incomplete, then the next target would be at 1,552 where intermediate wave (3) would reach 2.618 the length of intermediate wave (1).
There may now be four overlapping first and second waves complete: primary, intermediate, minor and now minute. This wave count expects to see an increase in upwards momentum.
A new high above 1,366.87 would invalidate the new alternate wave count below and provide price confirmation of this main wave count.
Primary wave 1 lasted 14 weeks and primary wave 2 lasted 12 weeks. Primary wave 3 should be longer in both price and time as it should be extended. It may be about a Fibonacci 34 weeks. So far it has lasted ten.
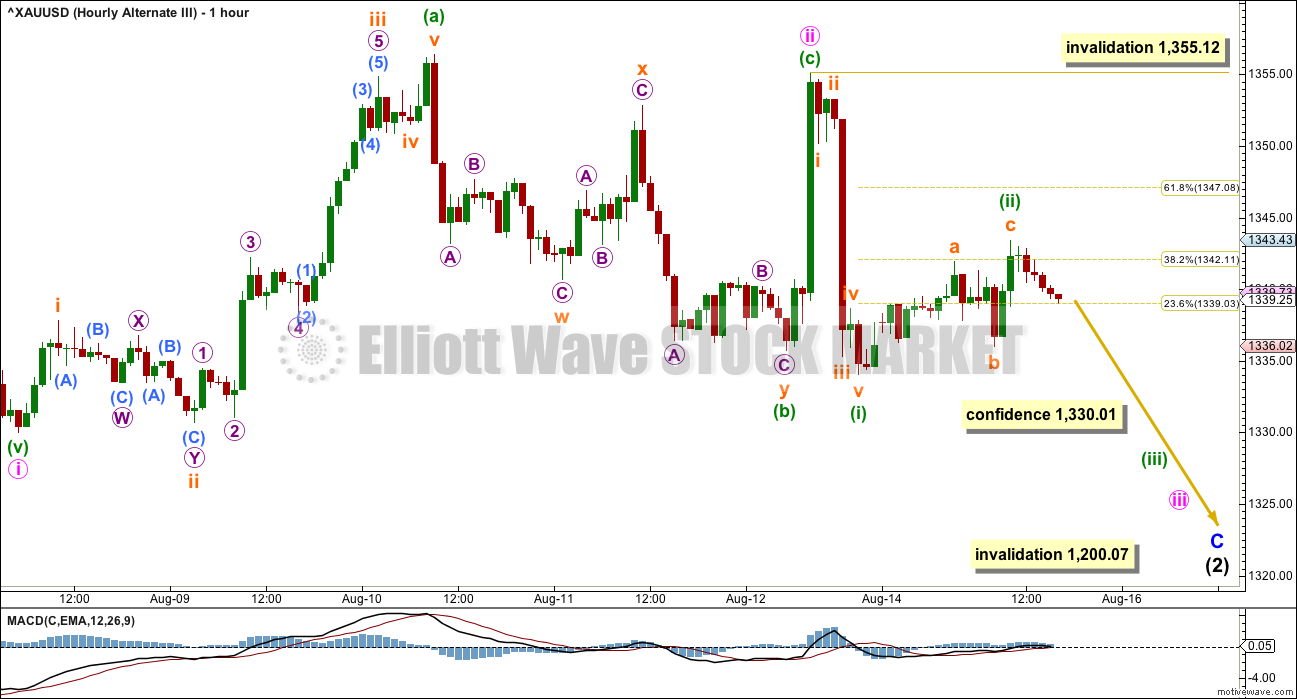
HOURLY ELLIOTT WAVE COUNT
Click chart to enlarge.
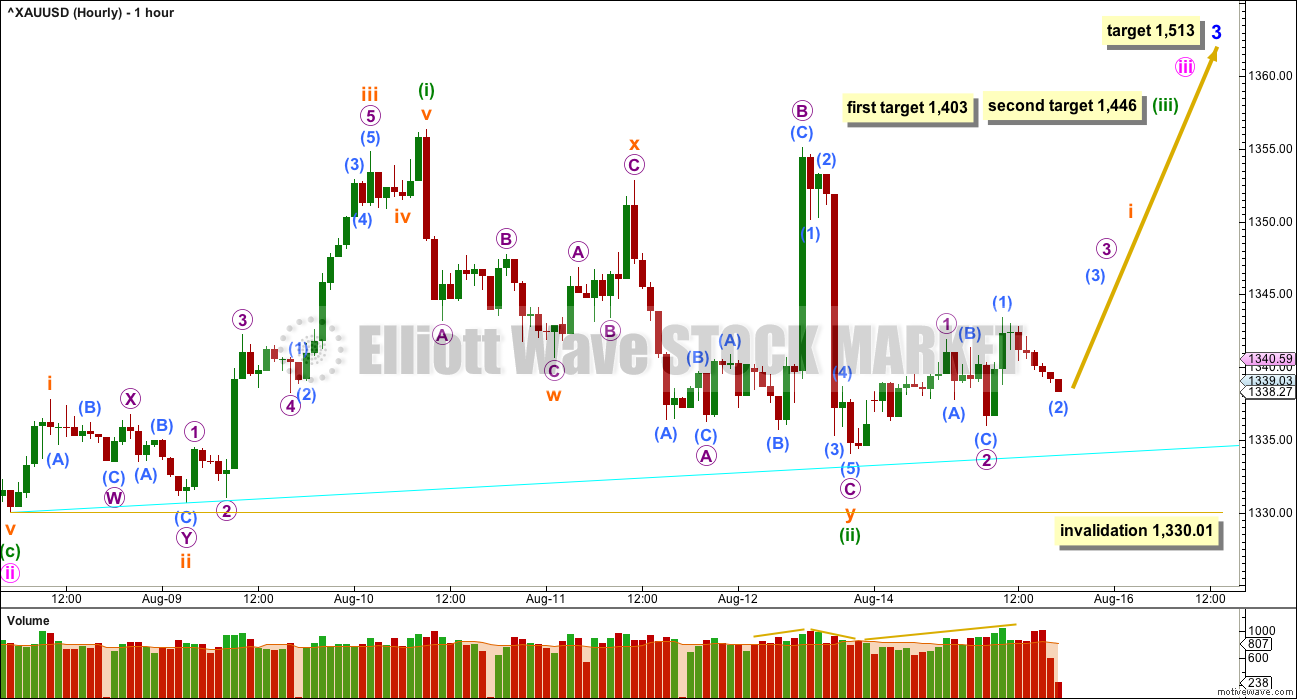
Minuette wave (ii) fits as a double combination: zigzag – X – expanded flat correction. Subminuette wave y ended lower than subminuette wave w; the correction has a slight downwards slope. Because subminuette wave x is relatively deep, and micro wave B of subminuette wave y is very deep, the correction still has somewhat a sideways look to it. This is reasonable for a combination.
What does look clear short term is that the wave up labelled minuette wave (i) looks like and fits very well as an impulse and the wave down labelled minuette wave (ii) is more choppy and overlapping, so it looks more corrective.
A cyan support line is drawn short term as shown. Price may find support about this line if this wave count is correct.
At 1,403 minuette wave (iii) would reach 2.618 the length of minuette wave (i). If price keeps rising through this first target, or if when it gets there the structure is incomplete, the second target would be used. At 1,446 minuette wave (iii) would reach 4.236 the length of minuette wave (i).
The target for minor wave 3 remains the same. At 1,513 minor wave 3 would reach 1.618 the length of minor wave 1.
The upwards movement for Monday’s session, on the five minute chart, subdivides so far 5-3-5. This may be micro waves 1-2 and submicro wave (1) upwards. Submicro wave (2) may not move beyond the start of submicro wave (1) below 1,336.02.
The invalidation point will remain at 1,330.01. It is still possible that minuette wave (ii) is not over and may move a little lower. The invalidation point reflects this possibility. Minuette wave (ii) may not move beyond the start of minuette wave (i) below 1,330.01.
The short term volume profile for Friday and Monday looks more bullish than bearish. There is support for upwards movement in price. The fall at the end of Monday’s session may not be complete yet; volume is lighter than the last upwards hours but is still increasing as price falls.
THIRD WAVE EXAMPLE – DAILY CHART
Click chart to enlarge.
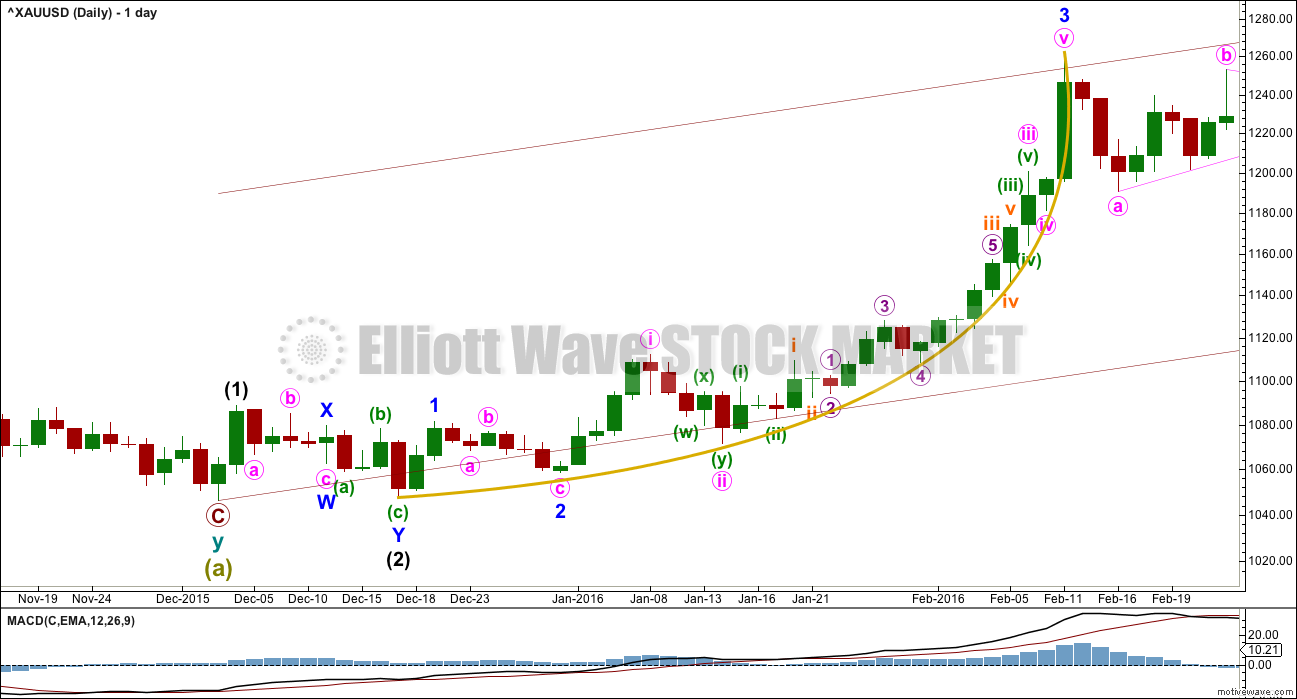
In discussing the curved look to Gold’s impulses, particularly for its third waves, here is an example.
Within primary wave 1, the third wave of minor wave 3 had a strong curved look to it. The impulse begins more slowly and has deep and relatively time consuming second wave corrections: Minor wave 2 was 0.68 of minor wave 1, minute wave ii was 0.76 of minute wave i, minuette wave (ii) was 0.56 of minuette wave (i), and subminuette wave ii was 0.64 of subminuette wave i.
The curved look comes from the disproportion between second and fourth wave corrections within the impulse. Here, minute wave ii lasted 4 days and shows clearly on the daily chart yet minute wave iv was over within one day and does not show up with any red candlesticks or doji on the daily chart.
Momentum builds towards the middle of the impulse, continuing to build further during the fifth wave and ending in a blowoff top. This is typical of Gold and all commodities.
This tendency to blowoff tops and curved impulses is particularly prevalent for Gold’s third waves.
ALTERNATE DAILY ELLIOTT WAVE COUNT
Click chart to enlarge.
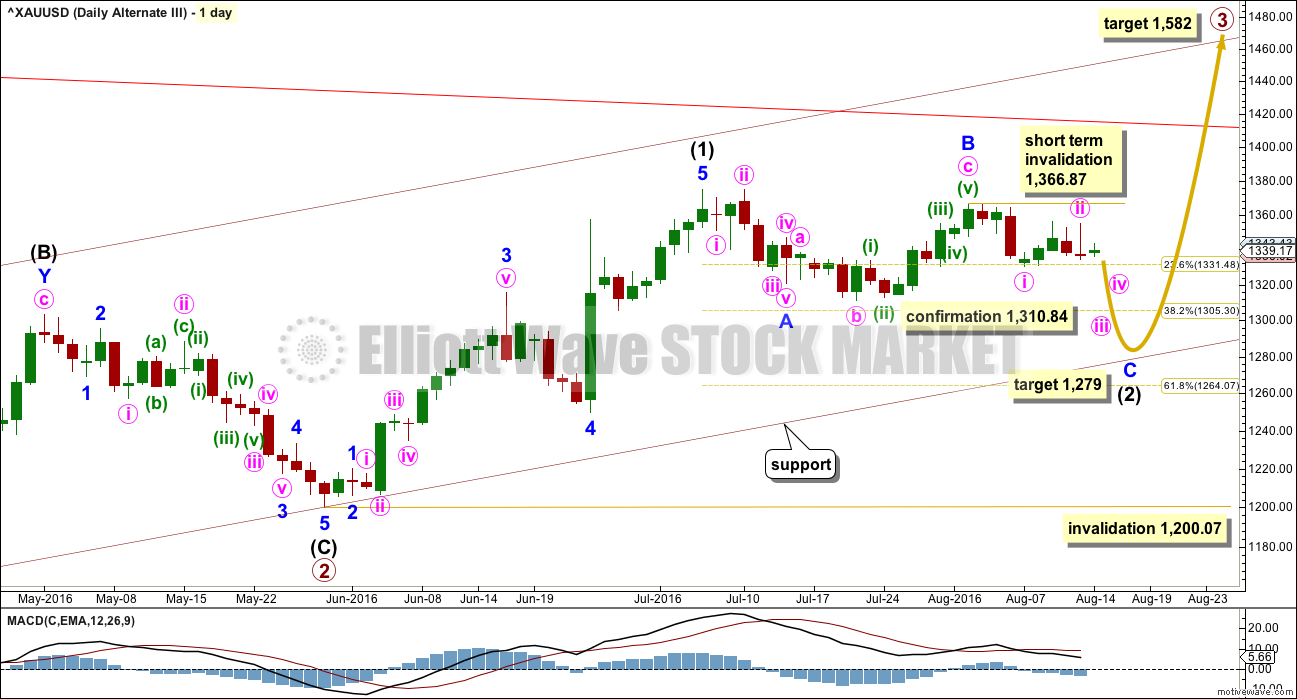
This wave count is identical to the main wave count up to the end of primary wave 2. Thereafter, what if only intermediate wave (1) ended at the last high?
This movement will fit as a five wave impulse, although it does not have a very good look on the daily chart. This reduces the probability of this wave count.
If intermediate wave (1) was over at the last high, then it may have lasted 27 days. So far intermediate wave (2) may have taken 28 days and would still be incomplete. The proportions of this part of the wave count look slightly better than the main wave count.
There is a problem now with structure on the hourly chart within minor wave C. Minute wave i would have to be complete. It will fit on the hourly chart, but it does not have a good look as a five and looks better as a three on the hourly and daily chart levels. This slightly reduces the probability of this wave count.
Within minor wave C, minute wave ii may not move beyond the start of minute wave i above 1,366.87.
Minor wave C must be a five wave structure. So far within it minute waves i and ii would be complete. Minute wave iii downwards should be underway.
At 1,279 minor wave C would reach 1.618 the length of minor wave A. Price may end downwards movement when it finds support at the lower edge of the maroon base channel drawn about primary waves 1 and 2.
Intermediate wave (2) may not move beyond the start of intermediate wave (1) below 1,200.07.
ALTERNATE HOURLY ELLIOTT WAVE COUNT
Click chart to enlarge.
In order to make a reasonable judgement of each Elliott wave count, it is at this stage important to see how each wave count sees recent structure at the hourly chart level.
For the subdivisions to fit best minute wave ii may be a completed zigzag with a truncated C wave for minuette wave (c) of 1.24. The truncation is not too large to be acceptable, but it is not small either. This is possible, but it does necessarily reduce the probability of this wave count.
A new high above 1,355.12 would invalidate this alternate at the hourly chart level, that would add a little confidence to the main wave count.
A new low below 1,330.01 would add some confidence to this alternate. A new low below 1,310.84 would confirm it.
Upwards movement for Monday fits as a 5-3-5 zigzag. This may be minuette wave (ii) complete, ending just beyond the 0.382 Fibonacci ratio of minuette wave (i). This alternate wave count now expects to see a third wave down at two degrees develop. If it is correct, it should be confirmed within the next 24 hours.
A new low below 1,336.02 short term would add a little confidence to this alternate. It would still require confirmation with a new low below 1,310.84 before a reasonable level of confidence may be had in the target.
TECHNICAL ANALYSIS
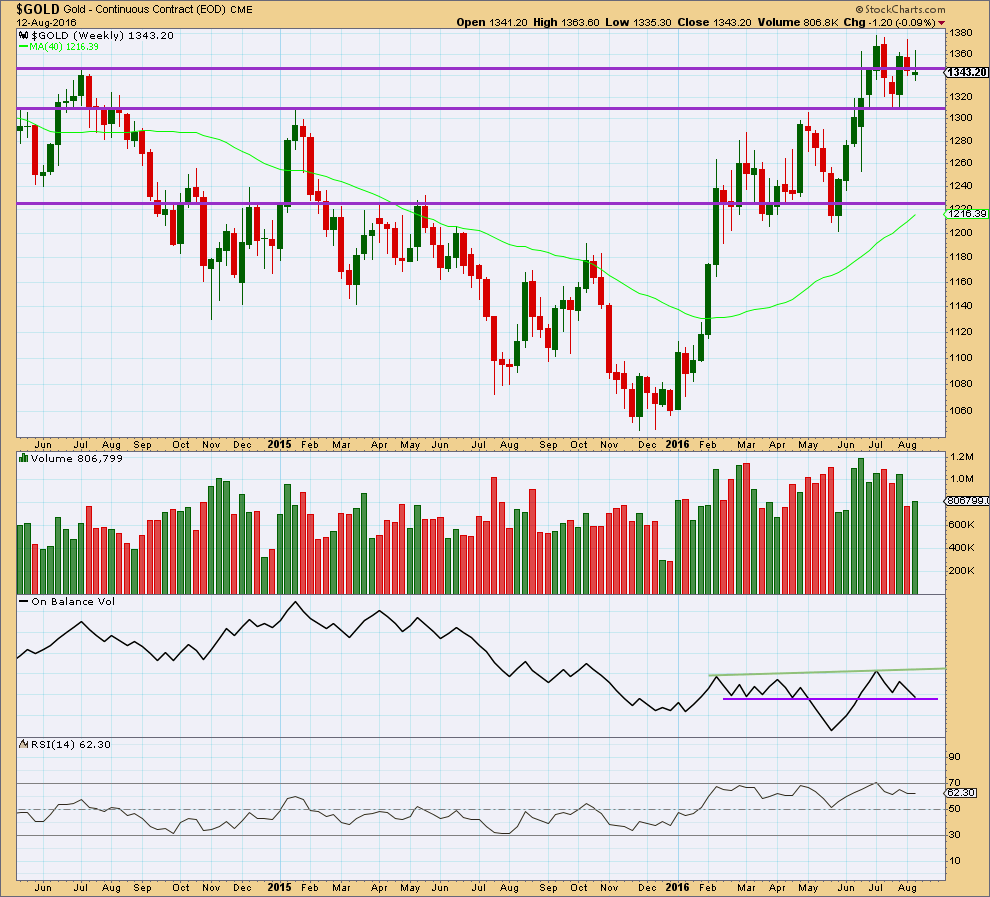
WEEKLY CHART
Click chart to enlarge.
Last week completes a lower high and a lower low. The week closed slightly above the open and the candlestick is green but not by much. Overall, last week looks corrective. A slight increase for a green week gives slight support to a bullish wave count.
If the lower purple line on On Balance Volume is drawn carefully across 7th of March and 18th of April, then it was touched at the end of last week. This trend line has been weakened with OBV breaking below and then returning above it, but it still has some technical significance. A break below the purple line would be a bearish signal but a relatively weak one. A break above the green line would be a bullish signal.
RSI is not extreme. There is room for price to rise or fall.
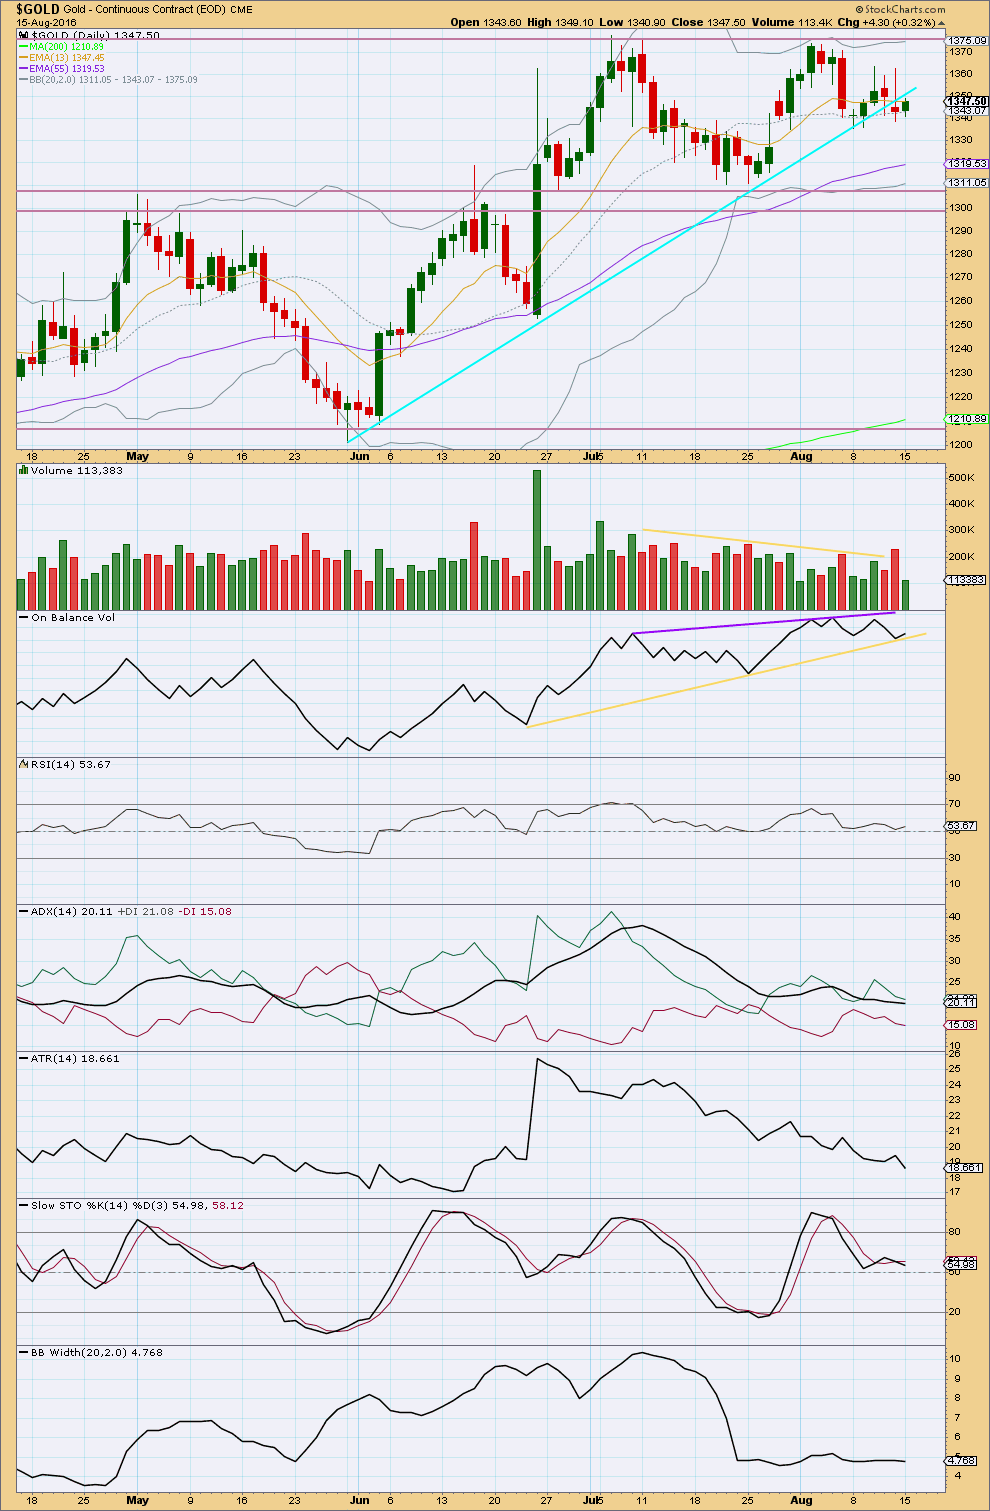
DAILY CHART
Click chart to enlarge.
There is still a large and continuing discrepancy between StockCharts volume data and COMEX volume data.
The short term volume profile from StockCharts is bearish. This supports the alternate Elliott wave count. Volume increased as price fell for the end of last week. Now a small green candlestick for Monday’s session comes with much lighter volume. The rise in price on Monday was not supported by volume. This short term volume profile strongly suggests more downwards movement ahead, at least for a few days. Price may find strong support about the next horizontal trend line at 1,310 – 1,305.
The short term volume profile from COMEX (seen on the main daily Elliott wave count) is bullish. This supports the main Elliott wave count. The fall of 5th August was 17.7K and the next upwards day of 8th August was 18.1K. Volume was essentially flat for the next upwards day of 9th August at 18K, and the last upwards day has the strongest recent volume at 30.4K. Thereafter, two downwards days of 11th August and 12th August have volume totals of 19.2K and 19.4K, respectively. There was some slight support for the fall in price on the second day, but it remained much lighter than the last upwards upwards day. Now COMEX data for Monday 15th August has a green daily candlestick with increased volume at 31.2K. The rise in price is supported by volume.
What is clearest from COMEX data is the two strongest days are this upwards day for 15th August and the last upwards day of 10th August. This short term volume profile strongly suggests more upwards movement ahead.
The volume profiles are polar opposite, making a judgement here impossible.
Please manage risk to any long positions carefully. Move stops to break even, if possible, or higher to protect any profits on older positions, if possible.
Price has overall moved upwards for Monday’s session. The range is very small for an inside day.
The cyan trend line was breached; price closed below it on Friday. Now that line appears to be providing resistance for a throwback. This would strongly also suggest more downwards movement from here, so this supports the alternate Elliott wave count.
Bollinger Bands have been contracting and remaining about the same level since 22nd July. Price ended the last upwards wave on 6th July and thereafter entered a sideways consolidation. Resistance is about 1,375 and support is about 1,305 – 1,310. During this consolidation, the BBs are contracting and volume is slowly declining. The upwards day of 8th of July remains the strongest day suggesting an upwards breakout is more likely than downwards. This offers small support to the main Elliott wave count.
On Balance Volume may assist to indicate where volume profiles between StockCharts and COMEX are opposite. OBV has today bounced up just above the yellow line. This line should be expected to offer support and to assist to halt the fall in price here.
RSI is very close to neutral. There is room for price to rise or fall.
ADX is still declining as is ATR. Both these indicators suggest a consolidating market at this time.
Stochastics is returning from overbought and price is returning from resistance. A continuation of a downwards swing should be expected for a consolidating market, only to end when price finds support about 1,310 – 1,305 and Stochastics is oversold at the same time. Trading range bound markets is more risky than trading trending markets. Only the most experienced traders should attempt it. Others should exercise patience and wait for a trend to return. The final expected swing never occurs; this is when price breaks out of the range and begins trending.
This analysis is published @ 06:00 p.m. EST.
Great team effort for improved results, awesome!
After reading the volume fiasco described below, its worth to note that all the big volume days for GLD since June 16th have all been on red-candle days… I’m not sure if that makes a difference, but at least that volume data is accurate and doesn’t get cut by almost half a week after it has posted…
GDX meanwhile has posted its 5th straight red candle on decreasing and light volume. So that might be a dare I say “silver lining…” 🙂
With 1345-43 holding, a rally for 136x appears to be in the making….
Yep. The attempts to drive down price have been persistent and relentless and the moves down are all being bought. Those futures contracts are going to have to be unwound….
Lara I like this solution of yours.
“give alternate wave counts. Price points beyond which positions should be changed.”
My opinion is there may be endless problems in many things including investing and gold and miners, etc., yet I stay positive and optimistic and let go of expecting perfection and instead just deal with what we get the best way possible as we can’t change the rest of the world we can only change ourselves and do our best with what we have which is enough. – Richard
I have a strong sense of justice, so anything that looks dodgy, especially when it’s something I’ve paid for, offends my sense of justice.
It may be a technical problem, in which case it may be able to be fixed.
But if it’s manipulation, that’s criminal. And criminals should be held to account.
But yeah, I know that’s not how the world works. Oh I do. So I’ll get over myself and let it go.
And adjust my approach. So in essence, I’ll take your advice. It’s my conclusion too.
Today the volume data from COMEX has changed. Retrospectively, days afterwards.
I am furious. Gutted. Massively….. annoyed.
How on earth can one do sound analysis with unreliable data?
I am paying for a data feed (a fair amount of money too IMO) of the Gold cash market from COMEX via BarChart. That data, BarChart tell me, comes directly from the exchange. It should be reliable.
It is not.
The volume data for August 10th changed from 30.4K to 18.7K.
The volume data for August 15th changed from 31.2K to 18.2K.
As members can appreciate this makes a big difference to the analysis.
I have seen this happen with StockCharts data before. I really (naively?) did not expect it to happen with data from COMEX. But it has.
I have sent a message to BarChart for a “please explain”. Will let you all know what response I get.
I am very much unimpressed.
I cannot conclude that COMEX data is unreliable and StockCharts data is reliable. Because this very same problem is one I have observed before from StockCharts too.
Both are unreliable.
Which is simply not good enough.
My only conclusion is this is manipulation of the data. To mislead.
My ….. rage? Is due to impotence. There is nothing I can do. I don’t expect a reasonable response. I expect this will happen again.
The best I can do is continue to advise members how to manage risk and give alternate wave counts. Price points beyond which positions should be changed.
And keep an eye on both data feed volume numbers.
Lara I certainly sympathize. I for some years now have concluded that when it comes to the financial markets in all its forms, what we are dealing with is essentially a global criminal class. I am not in the least bit surprised by this kind of behaviour and “mislead” is exactly what I think it was intended to do. I look at practically all price action in the markets with a very jaundiced eye and view every trade as literally engaging in guerilla warfare, for that is what it is for retail traders and investors in a very predatory and manipulated environment. Truly reprehensible conduct imo… 🙁
Understand the frustration Lara. FWIW, I keep an eye on Gld data as it usually tells the story without revision, and of course is intraday on stockcharts. It’s not perfect but as it’s very widely held and traded, it’s a decent proxy to compare against when faced with ambiguous data from other sources
I will be doing that religiously on a daily basis from now on Eli.
That’s a good point.
Perhaps at least a partial refund would be in order? 🙂
Hahahahaha
BarChart will say it’s a Motive Wave issue, or COMEX issue.
Motive Wave will say it’s a BarChart issue, or COMEX issue.
And COMEX? Even if I could figure out who to ask, I’m not their customer.
I’m cutting my losses in terms of emotional cost and letting that go.
You are very wise Lara.
Post by Surf City
“Gold is wedging to a decision point. The Bollinger Bands are tight, likely signaling a big move is coming. If the USD moves in the direction I expect, my bet that the move is up.
My colleague, Norvast also has Gann Low for Gold today/tomorrow so lets see what tomorrow brings. ?”
I agree, but not before the banksters engage in another violent “shake the trees” spike downward….
Thanks, Dreamer. Gold’s recent price actions did fit in the wedge pattern which is to frustrate most of traders. Hope gold will trend again soon. I keep my mind open. 🙂
My first impression is this looks good for the wave count, but I am becoming rather concerned about the long upper wicks on the daily candlesticks. Four of them now.
Working on a chart now for you… won’t be ready before market close.
I think subminuette i may now be complete. The downwards correction needs one more wave down to complete it. Target 1,339.
When that’s done upwards movement again to new highs.
Importantly, the sharp downwards movement today fits best and looks like a five on the five minute chart. So I don’t think this correction is over there.
I’m long silver, and today’s performance is nothing short of dismal. With the Dollar down huge, SLV is actually down from yesterday! I just think if the PM sector is going to make highs, it will not be coming during the US daytime hours. Gold and silver repeatedly get smacked down by 2-3% an hour or two before US markets open… Just huge moves down right before 9:30 eastern time… and they both don’t recover the rest of the day…
Its been very disappointing 🙁 I don’t know what to do here…
Silver still hasn’t made a new low below 19.549, that’s important. And some small support for the EW count there.
Both Gold and Silver have been essentially sideways for seven sessions now. That does make trading a market particularly difficult.
It will trend again. Lets make sure we’re on the right side of it when it does 🙂 That’s the goal anyway.
For what it’s worth Ari, this massive short selling of the precious metals by the banksters is not resulting in any appreciable sell-off. The longer they do it without success, the more explosive the move higher when it comes. There have been buyers for each of the massive dumps by way of futures short selling. I continue to accumulate my favorite shares on each bankster induced dip. 🙂
Trading Silver is hazardous.
Trading GDXJ might be an idea since it often contains Silver Mines.
If gold prices rally to new highs over the next several months, then a key mining ETF, GDXJm could see gains as high as 300%.
http://etfdailynews.com/2016/08/16/heres-how-junior-gold-miners-could-see-another-300-rally/
I think Lara mentioned this summer that a new high in Super Cycle wave (b) maybe in a few years.
Could be… possibly. But then it’s a B wave. They really are the worst.
It could be a long drawn out complicated combination, or a very time consuming triangle.
Or it could be a very quick sharp zigzag.
And at this stage I have absolutely no idea which one it will be. That’s impossible to tell.
That crystal ball from Motive Wave is malfunctioning
Stocks slump amid hawkish Fed talk, oil gains, weaker dollar
http://www.marketwatch.com/story/us-stocks-hunt-for-another-record-session-as-dollar-tumbles-2016-08-16?link=MW_popular
WEDNESDAY, AUG. 17
2:00 pm EST FOMC minutes 7/27
Fascinating that GLD front running Gold spot price. Folk are buying the dips.
Beautiful bull flag developing in Silvercrest Metals.
Verne. Miners have dropped significantly in proportion to gold price yesterday. That they are rebounding with a vigour is not unexpected.
The attempted smack-down in Gold not sticking. Look for another massive share dump by way of short selling futures contracts for at least one more try. If they don’t, we take out this morning’s high with a vengeance….
Gold high 1,358.19 at 8:32 am http://www.pmbull.com invalidated alternate hourly.
“A new high above 1,355.12 would invalidate this alternate at the hourly chart level, that would add a little confidence to the main wave count.”
Retraced almost .618 in a single candlestick.
What is going on with gold ?
Who is getting trapped ?
Bulls ?
Bears ?
I wish lara gets up by a scary dream early and have a look at the charts.
Lolzzz
Her help is needed
Clearly an attempt at price suppression by short sellers. Very typical.
Was it perhaps sub micro (3) micro 3 or subminuette i at 1,358.19 at 8:32 am high? Then a retracement drop rather than a conspiracy or manipulation theory?
James.
There is nothing strange about the price movement.
The strong move up to 1358.19 (1356.80 by BarChart data) was subminuette 1 of minuette 3 of minute 3.
The fast drop to 1341.18 (1341.50, BarChart) was subminuette 2. Second waves quite often exhibit fast and vicious drops.
So far there have been five 1-2s (at primary, intermediate, minor, minute and minuette levels). A strong third wave up should now be underway.
So Alan where do think this 3rd wave up will end?
Thanks
Marc.
For minuette 3, my first target is 1381.45 @ 1.618 Fib. It could be higher though. We’ll have to wait for more data from the ongoing price upmove to get a clear picture.
And the current subminuette 3 going on now?
Thanks
Yes, Marc.
It looks like submicro 1 of micro 1 of subminuette 3 just ended at 1350.02.
Hello Alan,
What is your current target for subminuette wave 3?
And what is the type of wave that fits into overall combination?
Thank you so much!
Sorry Marc. It should be subminuette 3, not minuette 3.
For minuette 3, Lara’s targets still apply, namely 1403 or 1446.
Hi pete. That’s my best guess.
Looks to me like there is some bankster panic on display after this morning’s strong move North. A massive amount of contracts sold last hour in an attempt to arrest the ascent. I suspect it will be bought with a vengeance…. 🙂
What a difference a few hours can make! While the main bull count is yet to be confirmed, the strong move up now looks much better for the bull count in my opinion.
Here’s a possible update on the count. The arrows and placement of the numbers show the possible path and are not placed where the targets may be. The bottom line is that the strong move up looks bullish.
So guys..what should be our take for now…gold holding strongly with all other metals…
Lara if want to modify my stoploss to the nearest for main count.What price that be ?
Can you please help in that
I’ll put that in todays analysis after careful consideration.
Possible alt update. There appears to be a nice double ZZ for Minuette 2 of the alt count now. If correct, gold should go down from here following the alt count.
That said, if gold has a small correction here and continues up, then I think the bull count will start to be favored again.
I made a check on the Investing.com site for a clearer picture. They too show what I had observed, that the point labelled (i) should have been two bars earlier. I had that as the third wave, which means that we would have only one last down wave to go.
Of course, (i) could have contained a truncated fifth wave.
Oh, the bane of different data feed yielding different pricing. Yet, pmbull, ProReal Time, and now Investing.com are aligned. I wonder if BarCharts is the only one which shows a different picture.
Alan, on Investing.com, gold Dec futures (GC) on the technical chart, does have the same issue you have with PMBull; however, when you use XAUUSD (cash gold) as I did on the chart, there is no truncation. The point I have labeled as Minuette 1 is lower. So gold futures vs cash gold appears to be the main difference.
Ah ha! That’s it. Futures vs cash.
For an Elliott wave count cash is the better market. Futures due to greater leverage can include stronger price swings.
For Elliott wave rules cash works better. Less leverage, more sticking to the rules.
We had impulsive Minuette (i) down yesterday at the low 1338.3 for GCZ, and now corrective (ii) up to 1351.80(close to 55%), very likely Alternate hourly is in play start of minuette (iii). 1362.50 is invalidation
“A new high above 1,366.87 would invalidate the new alternate wave count below and provide price confirmation of this main wave count.”
Although I love the main count as it shows a very near-term positive outlook, I just can’t help feeling that the alternate has some merits. The miners had dropped rather badly in the last session, although gold price is rising (albeit slowly). Miners have the most stake in the gold price as it is their main money spinner. Which means they have to be quick to react to price movements. Perhaps this drop is a harbinger of gold’s forward pricing.
The only thing which can make me change my mind is if gold moves significantly higher with increased volume in the next 24 hours, heralding a strong third wave up.
Strong up move, ALT. on GCZ was invalidated. Likely sub-miniuette i peak at 8:30 AM, primary bullish is on
Melanie – pmbull trend lines
One tablet had Adobe Flash 20 and showed trend lines.
Added Adobe Flash 22 to 2nd tablet and now it shows trend lines although slightly different. Google Chrome supposedly already includes Adobe Flash Reader so I removed it and and added it again to my desktop with windows 7 version 64 and still trend lines don’t stay.
I read an article that Google Chrome as of December 2016 will no longer support Adobe Flash due to security reasons. In December, Chrome 55 will make HTML5 the default experience.
https://chrome.googleblog.com/2016/08/flash-and-chrome.html
You mentioned, “I’m curious….you noted 1, 5, 15, 39, 78 min charts”
I use 1,3,5,15,39,78,195 on TOS Think or Swim platform as recommended by a top day trader.
Richard…I have all Adobe Flash versions downloaded onto current computer w/Windows 7-64b. To my surprise, the trend lines Remain Visible when I use Fire Fox browser. Chrome and Bravo, so far…fail at this. Though Firefox is not what it used to be, I can use it for PMbull.com.
TOS…all divisible by 3, fib oriented and w/those numbers he may be trying to run a little ahead of the crowd as certain MA values are hit, ie: 195 instead of 200, etc.
Richard, Melanie,
I posted the following earlier today on the previous analysis comment thread. It was held for moderation, probably because of the links, so you may not have seen it. This doesn’t directly solve the problem you’re working on, but it may be helpful (or not)…
The flash charts at PMBull.com don’t show up correctly on my MacBook Pro running Safari (Chrome yes, Safari no), but the non-flash charts are fine. They are generated by a little javascript widget freely available from Dukascopy Bank, a Swiss bank that appears to specialize in Forex trading.
https://www.dukascopy.com/trading-tools/widget/chart
I’ve grabbed the widgets for Oil and Gold, hacked them to suit me, and posted them on my own bare-bones web pages with no advertising. It’s really easy to do this yourself if you have access to a web server. If not, anyone here is welcome to use these links if you’d like to. I plan to keep them up the way they are indefinitely.
Oil (1hr Candlesticks):
http://track17.com/charts-oil.html
Gold (1hr Candlesticks):
http://track17.com/charts-gold.html
Oil and Gold together on the same page:
http://track17.com/charts.html
(Unfortunately, I don’t see GDX as an option for these non-flash charts.)
Yes, sorry Curtis, it was in moderation because of the links.
Great you got your trend lines. I’ll stick with Chrome as my last experience with Firefox maybe 10 years ago was a disaster way too many delays. Chrome does great otherwise.
You may have figured out the reasons for the time frames.
The 5 minute is the most important for day trading however the longer times for longer term of course I’f look at several at at time.
You may want to check out John Carter’s indicators if you have access to TOS.