
Upwards movement was again expected for the session.
Summary: The target for the main wave count remains at 1,582. Substantial confidence in the main wave count may now be had if price can move above 1,366.87. A new low below 1,310.84 would invalidate the main wave count and confirm an alternate. Prior to that, a new low below 1,334.06 would shift probability from the main to the alternate wave count. A target for downwards movement to end would be 1,279.
New updates to this analysis are in bold.
Last weekly charts, and a more bearish weekly alternate, are here.
Grand SuperCycle analysis is here.
DAILY ELLIOTT WAVE COUNT
Click chart to enlarge.
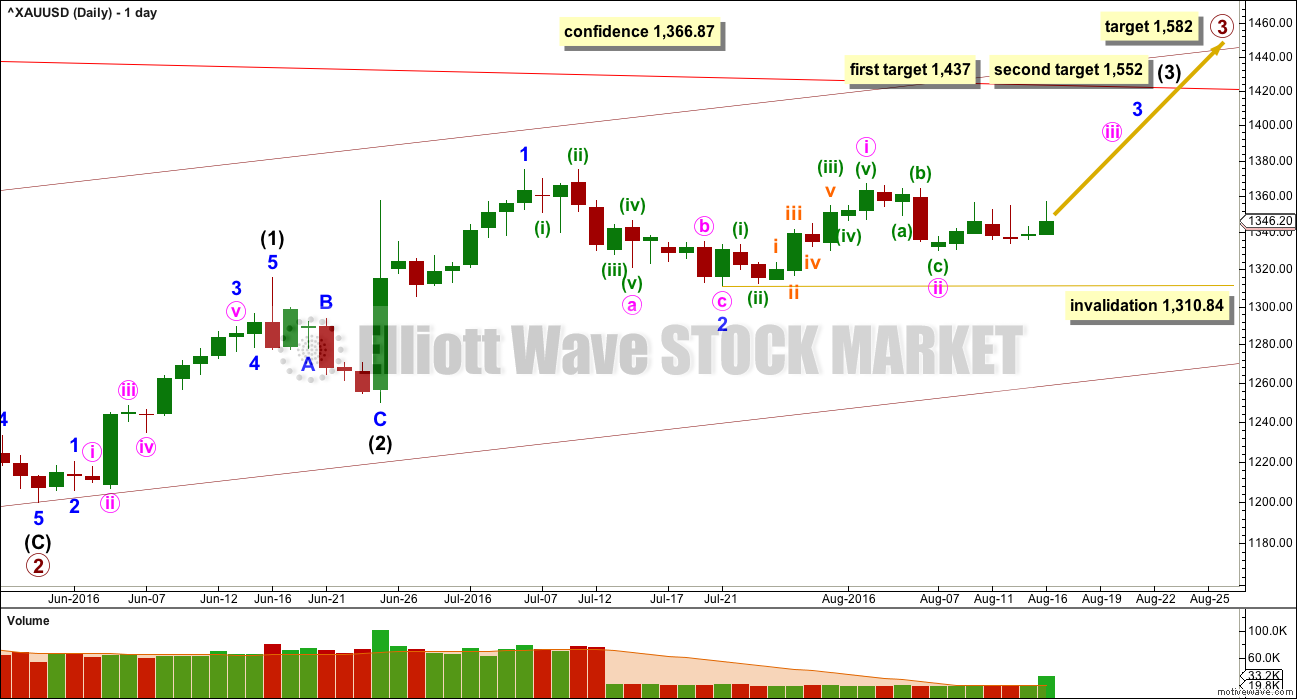
Primary wave 2 is a complete expanded flat correction. Price from the low labelled primary wave 2 has now moved too far upwards to be reasonably considered a continuation of primary wave 2. Primary wave 3 is very likely to have begun and would reach 1.618 the length of primary wave 1 at 1,582.
Primary wave 3 may only subdivide as an impulse.
So far intermediate waves (1) and (2) may be complete within primary wave 3. The middle of primary wave 3 may have begun and may also only subdivide as an impulse.
Within intermediate wave (3), the end of minor wave 1 is moved up to the last high. This fits on the hourly chart although it looks odd here on the daily chart. There was a small fourth wave correction up at the end of minor wave 1 and it subdivides on the hourly chart as an impulse. Minor wave 2 may be a complete zigzag, also subdividing as a zigzag on the hourly chart. If minor wave 2 is over, it would be 0.50 the depth of minor wave 1.
With overall sideways movement now for the last seven days, it looks entirely possible that minute wave ii may not be over. Sideways movement may be a corrective structure for an X wave to join two zigzags in a double. Minute wave ii may yet move a little lower to complete as a double zigzag.
Minute wave ii may not move beyond the start of minute wave i below 1,310.84. This is the final risk to any long positions entered here or which members may still be holding.
At 1,437 intermediate wave (3) would reach 1.618 the length of intermediate wave (1). If price keeps going upwards through this first target, or if it gets there and the structure is incomplete, then the next target would be at 1,552 where intermediate wave (3) would reach 2.618 the length of intermediate wave (1).
There may now be four overlapping first and second waves complete: primary, intermediate, minor and now minute. This wave count expects to see an increase in upwards momentum. On the hourly chart, there are now two more first and second waves complete: minuette and subminuette. The increase in upwards momentum should be imminent.
A new high above 1,366.87 would invalidate the alternate wave count below and provide price confirmation of this main wave count.
Primary wave 1 lasted 14 weeks and primary wave 2 lasted 12 weeks. Primary wave 3 should be longer in both price and time as it should be extended. It may be about a Fibonacci 34 weeks. So far it has lasted ten.
HOURLY ELLIOTT WAVE COUNT
Click chart to enlarge.
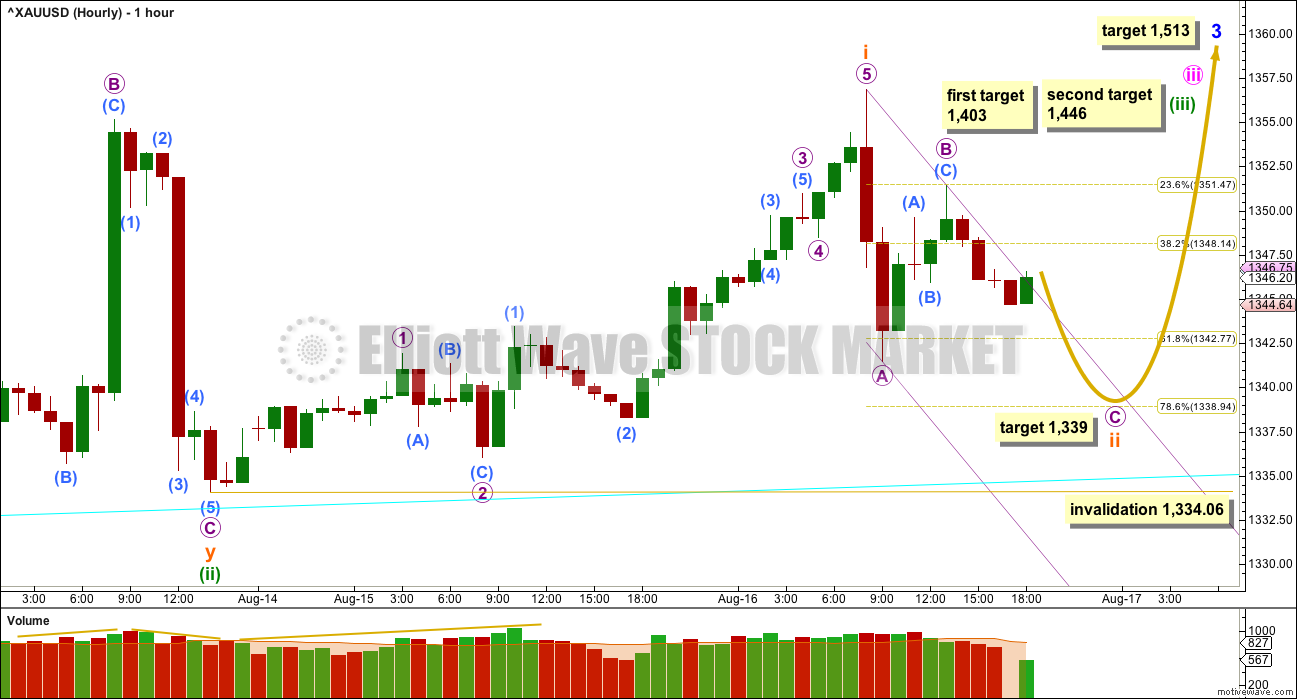
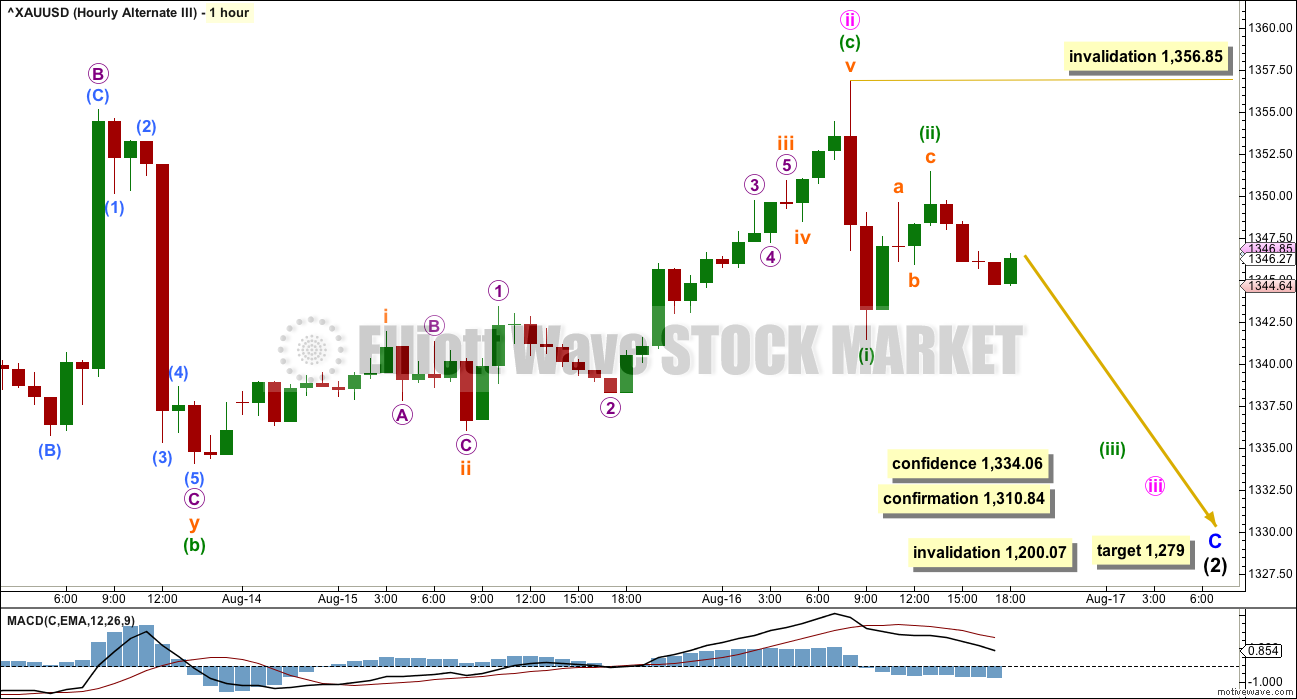
At 1,403 minuette wave (iii) would reach 2.618 the length of minuette wave (i). If price keeps rising through this first target, or if when it gets there the structure is incomplete, the second target would be used. At 1,446 minuette wave (iii) would reach 4.236 the length of minuette wave (i).
The target for minor wave 3 remains the same. At 1,513 minor wave 3 would reach 1.618 the length of minor wave 1.
The short term volume profile today looks slightly bearish. Volume increased as price moved up to the high for Tuesday’s session, but as price fell strongly during a two hour fall volume was stronger. Thereafter, for overall sideways movement volume has been declining. This supports the idea of more downwards movement at least short term.
At 1,339 subminuette wave ii would reach the 0.786 ratio (not correctly a Fibonacci ratio but still sometimes useful).
The strong downwards movement labelled here micro wave A subdivides best and fits best as a five on the five minute chart. If that is correct, then subminuette wave ii cannot be over there. Micro wave C would be very likely to move at least slightly below the end of micro wave A at 1,341.45 to avoid a truncation. As soon as price makes a new low below 1,341.45 look out for an end to this downwards movement and the start of a strong wave up.
A channel is drawn about this downwards zigzag for subminuette wave ii. It may show where upwards movement finds resistance along the way down. These channels usually work, but not always. If the upper edge is breached before price has made a new low below 1,341.45, then the channel may need to be redrawn as a best fit.
After a new low below 1,341.45, then a subsequent breach of a channel containing subminuette wave ii would provide trend channel confirmation that the correction is over and a third wave up should be underway.
Placement of stops depends on your trading style. Longer term position holders may set stops just below 1,310.84 or 1,334.06. Short term traders should set stops just below 1,334.06. Stops may be set just below either point, again depending on trading style, when entering long positions at the end of subminuette wave ii
Always use a stop loss. Do not let losses run if the market moves against you. Hoping for a correction to exit a losing position risks greater unconfined losses. Hope is not an investment strategy. Do not invest more than 3-5% of equity on any one trade.
Any members who choose to ignore these two risk management rules do so at their peril and against my explicit repeated advice.
These two risk management rules should always be used. Risk management is the single most important aspect of trading. Good risk management can turn even a poor strategy into a profitable strategy.
THIRD WAVE EXAMPLE – DAILY CHART
Click chart to enlarge.
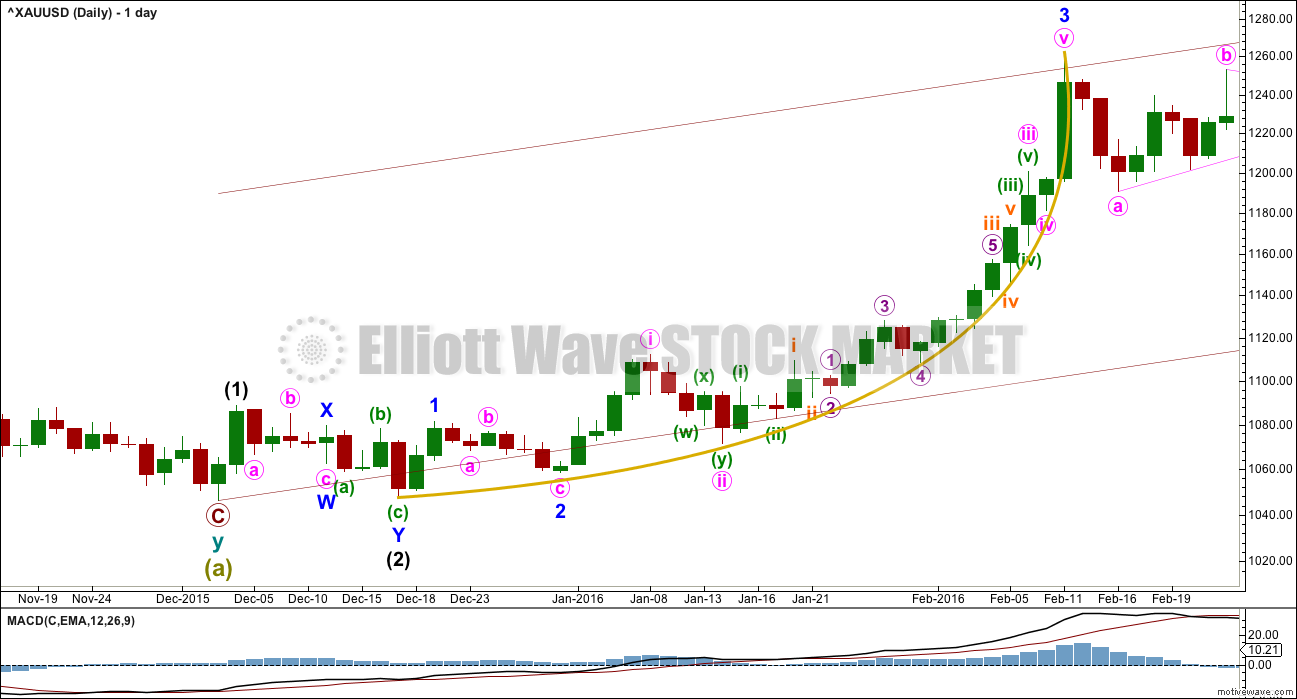
In discussing the curved look to Gold’s impulses, particularly for its third waves, here is an example.
Within primary wave 1, the third wave of minor wave 3 had a strong curved look to it. The impulse begins more slowly and has deep and relatively time consuming second wave corrections: Minor wave 2 was 0.68 of minor wave 1, minute wave ii was 0.76 of minute wave i, minuette wave (ii) was 0.56 of minuette wave (i), and subminuette wave ii was 0.64 of subminuette wave i.
The curved look comes from the disproportion between second and fourth wave corrections within the impulse. Here, minute wave ii lasted 4 days and shows clearly on the daily chart yet minute wave iv was over within one day and does not show up with any red candlesticks or doji on the daily chart.
Momentum builds towards the middle of the impulse, continuing to build further during the fifth wave and ending in a blowoff top. This is typical of Gold and all commodities.
This tendency to blowoff tops and curved impulses is particularly prevalent for Gold’s third waves.
ALTERNATE DAILY ELLIOTT WAVE COUNT
Click chart to enlarge.
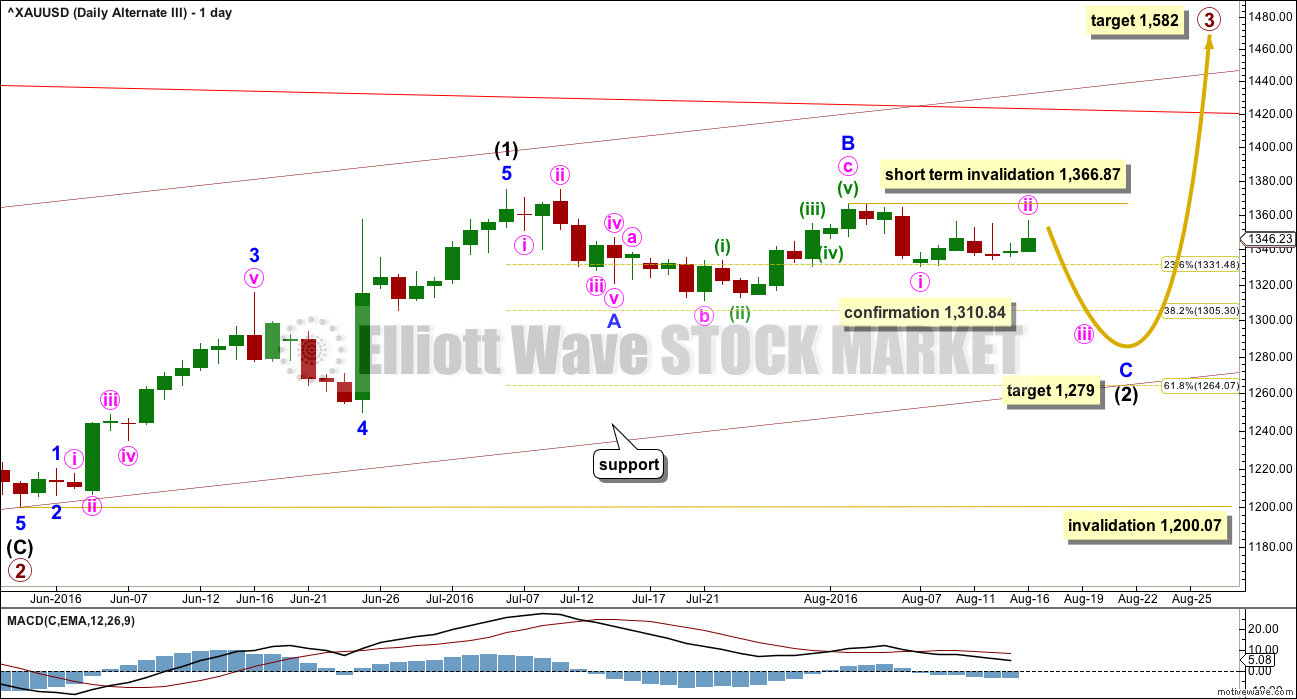
This wave count is identical to the main wave count up to the end of primary wave 2. Thereafter, what if only intermediate wave (1) ended at the last high?
This movement will fit as a five wave impulse, although it does not have a very good look on the daily chart. This reduces the probability of this wave count.
If intermediate wave (1) was over at the last high, then it may have lasted 27 days. So far intermediate wave (2) may have taken 29 days and would still be incomplete. The proportions of this part of the wave count look slightly better than the main wave count.
There is a problem now with structure on the hourly chart within minor wave C. Minute wave i would have to be complete. It will fit on the hourly chart, but it does not have a good look as a five and looks better as a three on the hourly and daily chart levels. This slightly reduces the probability of this wave count.
Within minor wave C, minute wave ii may not move beyond the start of minute wave i above 1,366.87.
Minor wave C must be a five wave structure. So far within it minute waves i and ii would be complete. Minute wave iii downwards should be underway.
At 1,279 minor wave C would reach 1.618 the length of minor wave A. Price may end downwards movement when it finds support at the lower edge of the maroon base channel drawn about primary waves 1 and 2.
Intermediate wave (2) may not move beyond the start of intermediate wave (1) below 1,200.07.
ALTERNATE HOURLY ELLIOTT WAVE COUNT
Click chart to enlarge.
In order to make a reasonable judgement of each Elliott wave count, it is at this stage important to see how each wave count sees recent structure at the hourly chart level.
The new high for Tuesday’s session resolves the problem of a truncated C wave within minute wave ii. Minuette wave (c) now ends slightly above the end of minuette wave (a) avoiding a truncation. The structure subdivides 5-3-5 in the same way now as the main wave count.
Within minute wave iii, no second wave correction may move beyond its start above 1,356.85. A new high above this point at this stage would invalidate this alternate at the hourly chart level, but not the daily chart level. That would add confidence to the main wave count.
Minor wave C must subdivide as a five wave structure. If price makes a new low below 1,334.06, then the probability of this alternate would increase. It would be confirmed with a new low below 1,310.84.
If price moves below 1,310.84, then expect more downwards movement for a deeper pullback to end about 1,279. Look also for price to find support at the maroon channel on the daily chart. The target at 1,279 may be a little too low; the maroon trend line may stop price before it reaches the target.
TECHNICAL ANALYSIS
WEEKLY CHART
Click chart to enlarge.
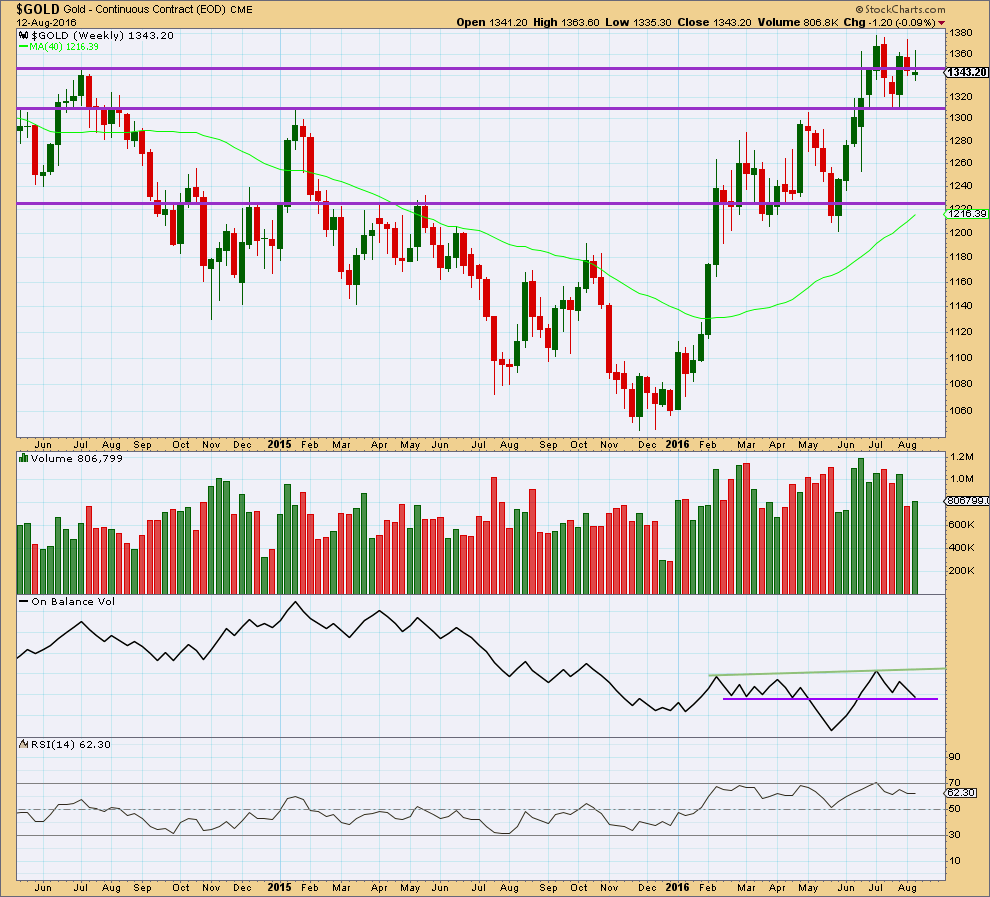
Last week completes a lower high and a lower low. The week closed slightly above the open and the candlestick is green but not by much. Overall, last week looks corrective. A slight increase for a green week gives slight support to a bullish wave count.
If the lower purple line on On Balance Volume is drawn carefully across 7th of March and 18th of April, then it was touched at the end of last week. This trend line has been weakened with OBV breaking below and then returning above it, but it still has some technical significance. A break below the purple line would be a bearish signal but a relatively weak one. A break above the green line would be a bullish signal.
RSI is not extreme. There is room for price to rise or fall.
DAILY CHART
Click chart to enlarge.
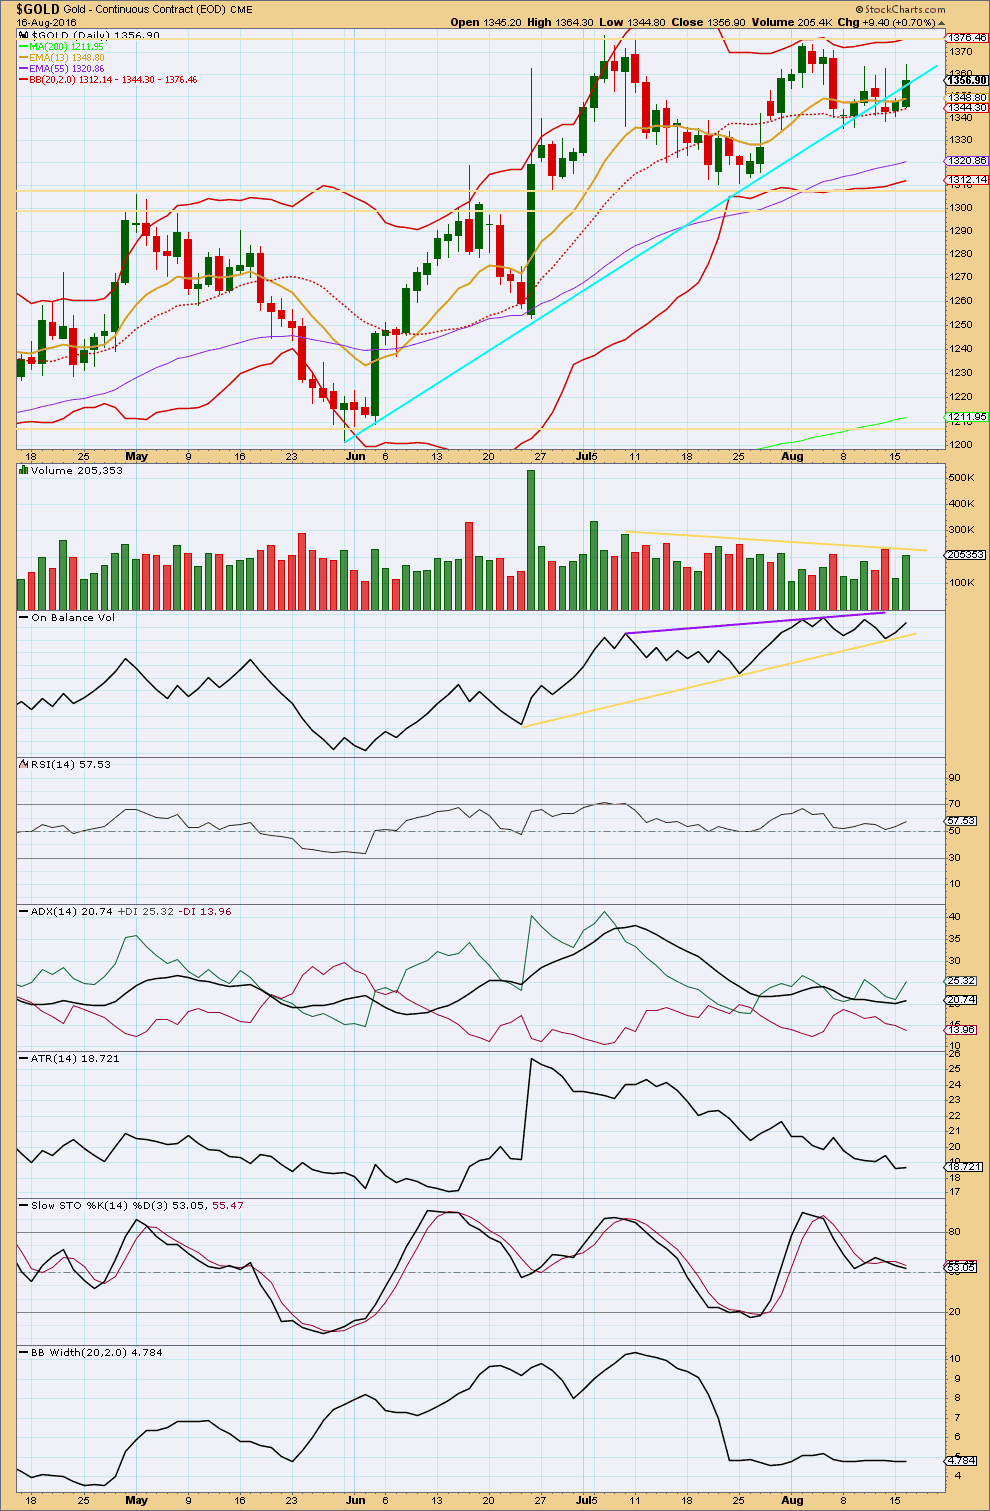
StockCharts and COMEX data now mostly agree, with the exception of volume data from COMEX for 16th August.
With the retrospective change in COMEX volume data for 10th and 15th of August, until I have a response from BarChart with a reason for the retrospective change days after publication, I will rely on StockCharts data at this time for volume analysis.
Overall, price is still consolidating since about 7th of July. Volume is overall declining as price is moving sideways, typical of a consolidating market. ATR has been declining during this time, also typical of a consolidating market. During this time, it is still the upwards day of 8th July which has strongest volume indicating an upwards breakout is more likely than downwards. This trick usually works well with Gold. Usually is not the same as always.
For recent movement, volume increases as price rises. Volume also increased as price fell for 11th and 12th of August. Now volume again increases as price rises for two days. Overall, the fall in price for 12th August has strongest recent volume supporting the idea of more downwards movement short term. This supports the alternate Elliott wave count over the main Elliott wave count.
Today’s candlestick completes a strong bullish engulfing pattern, but this has not come after a clear downward trend and it is within a sideways consolidation. It cannot be read as a bullish reversal signal for this reason. Reversal signals need a trend to reverse.
On Balance Volume did find support at the yellow trend line, so the strength of this line is reinforced. OBV is bullish with a bounce off this line.
RSI is still just above neutral. There is room for price to rise or fall.
ADX today is increasing, indicating the possible resumption of an upwards trend. ATR today is also increasing in agreement with ADX. For this signal to be stronger, another day or so of increases would add confidence. For now it is a tentative support for the main Elliot wave count.
Stochastics is close to neutral. If the market is trending again, then Stochastics should be used to indicate weakness when it diverges with price.
Bollinger Bands are still narrow after a period of contracting. This supports the idea that the market has been consolidating since 12th July. It should be expected that price will start to strongly trend again after a period of contraction. Volume is used to indicate the most likely direction.
A breakout above resistance at 1,375 or below support at 1,305 – 1,310 on a day with high volume is required to confirm an end to this consolidation and the start of a new trend. That has not happened yet.
The cyan trend line is not working. After what looked like a break below and a back test, price has now closed back above this line. With the line broken and price moving back beyond, if the strength of the line is weakened, it should now be removed. Price has found some support about the mid line of the Bollinger Bands.
This analysis is published @ 08:05 p.m. EST.
From Stock Charts Support section
Thank you Dreamer. So it’s not futures. It’s an index.
I’ll continue to use it for technical analysis then, as a back up to the ^XAUUSD data from BarChart. And I’ll continue to check GLD volume data daily as a base line.
I think that should be a pretty comprehensive approach.
I have two wave counts for the hourly chart structure today.
Bottom line: risk now to long positions must remain at 1,334.06. Stops should be now just below this point.
It is possible that subminuette ii could move lower.
Lara you mentioned
“I can’t find the data feed for the cash market on StockCharts….”
Not sure if this is what you are looking for, but this is the gold symbol at stockcharts.
$GOLD
http://stockcharts.com/h-sc/ui?s=%24gold
That’s the one I’m using.
But it’s futures, not cash market data 🙁
It’s a close as I can get though.
Lara,
It is Cash Gold daily and they take a daily close of 1:30 PM EST for closing price and the Volume traded.
Re-start the next day after 1:30 PM and continue to the following day till 1:30PM EST.
Hope this clears the confusionn for
Stockcharts.com
Time of US-New York gold market
Opens at 8:20am and closes at 1:30pm (local time)
Time of US-New York Electronic Trading
Opens at 6:00pm and closes at 5:15pm (local time)
This seems to match CME continuous futures contracts for open and close. You are correct above.
So…. $GOLD is cash data, not futures?
Gold – Continuous Contract CME
is not futures from Chicago exchange? This is indeed cash?
This is the one I’ve been using for a long time now. I did originally think it was cash… then someone said it was futures…. “continuous contract” does imply some kind of futures or options contract
now I’m just confused 🙁
The data points from this StockCharts data are very close indeed to BarCharts ^XAUUSD
And now I’ve finally found GCY00 from the Chicago exchange.. but it has no volume data so that’s no use at all 🙁
from our member VK below:
” Your stockcharts data is for the ‘CME continuation futures contract’, which should be reliable. Comparing it with the forex volume from Barchart (^XAUUSD) is a bit of apples-vs-oranges”
Hence my confusion.
Lara,
With the huge down spike of silver today, does that just mean minute (ii) went lower than 19.54 to today’s lows? I guess the new invalidation point would be end of minor 4 which is about 19.22? Or do you see a change in the overall picture from uptrend?
Thanks in advance…
pmbull.com 1 minute shows silver dropped to 19.38 at 2:00 and 2:01 pm
Yes it did, and that invalidated Lara’s current count. But it could mean that minute (ii) ended at 19.38 today; previous invalidation was 19.549…
But if minute (ii) would move to today’s low, the new invalidation point would be the July 21st low of 19.21, the end of minor 4… I think…
Plus the target for end of minor 5 would also have to be re-calculated based on the new low of minute (ii)… I might just have to wait until Thursday for an update, it seems complicated…
I’ll be updating Silver today.
Great 🙂
Thanks…
Yes. Minute ii (pink circle) moved lower.
The invalidation point must be moved down to 19.214.
pmbull.com 1 hour chart today from my brother as I can’t get my desktop to show trend lines.
Does anyone of you guys still have the energy left for a bit of double entendre?
I can summarise the Fed minutes as “some members feel that the conditions could soon warrant a wage hike”.
Well, “some” is an ambiguous term. The only thing we can exclude is “many” and “one”. It is on par with “a few”. It is not even “several” which is a bit more specific.
“Could” is used in the English language to express a conditional possibility. Normally, the conditions are specified, but I find that the minutes are silent on these.
“Soon” of course denotes an occurrence somewhere in the future, without mentioning specific dates.
The investing public probably thought a wage hike is in the offing, hence the sudden drop in gold price. Most likely, on close scrutiny, they arrived at the same inference as me, and hence the strong reversal. I am beginning to enjoy the Fed double talk.
Yes plenty of double talk by the FED before news or minutes release, in the actual news or minutes then after the news or minutes. I think they try to stabilize the markets so doesn’t overheat. Or else they are sadists and like to torture the markets with ambiguity. Either way the fast and the furious traders traders can make a lot of profits or losses. Handle with care. Caveat Emptor, a neo-Latin phrase meaning “let the buyer beware.”
Man I love these opportunities to get in at a discount. I guess we should thank the feckless FED! 🙂
Yes they can create opportunities for the informed, ready and able to buy quick.
I haven’t read all the comments below yet… getting there. Here’s my quick update before market close. I have also not yet figured out exactly what structure subminuette ii is, only that it doesn’t work with the cash data as a single zigzag.
What does look clear is subminuette ii should now be over.
Buy the dips.
Please please members, ALWAYS use stop losses. Do not let losses run, contain them. Stops may now be pulled up to just below todays low. That’s what I’ll be doing for my long positions.
My other golden rule: never invest more than 3-5% of equity on any one trade.
Risk management is the most important aspect of trading. Get that right and you’re on your way to making a living out of this game. Ignore it and you will lose all the equity in your account.
The short sellers are about to have their you-know-what soundly kicked. As I anticipated, the “shake- the- trees” feint was bought with a vengeance. Now watch them run like a bunch of wusses as they are forced to unwind those contracts owing to failing to intimidate gold longs into wholesale bailing from positions. Beautiful long lower wicks. Kind of annoying having to listen to all the idiot talking heads on the media circuit talking about how the bull run is in trouble. dumbkopfs! 🙂
Verne, so far today looks to be another of Lara’s buy the corrections.
Not yet, Richard, unless you were gungho enough to have bought at the doldrums today.
This spike is micro 1 of subminuette 3. I’ll wait for the micro 2 retrace before I go in. I’m just wondering if the retrace is going to be 0.236, 0.382 or 0.618.
Alan your micro 2 target buy sounds interesting for NUGT. Let’s see what Lara’s accessment is for a possible micro 2 retrace.
Yes I meant bought at today’s lows. I did buy NUGT 78 cents off the day low in the Heat of the FOMC Moment at 2:01 pm and already sold.
Anyways there is an NUGT retrace opportunity for a quick flip everyday just wish I caught more of them like you do Alan. I guess I need to study EW more and make better calls on the 5-3-5 bottoming process early in the market hours.
I did. But then again, I probably have a much longer time horizon than most people buying the miners. I actually believe at some point it is going to be difficult to buy the metals. I know the leverage of the paper Gold market to the existing metal is well over 100:1. Some of the big industrial players are actually starting to approach silver producers about locking up future delivery. Bullish on the metals, uber bullish on the miners… 🙂
Verne, I have spelled words the British way all my life. I’m still trying to get used to the American way of spelling. The original German word is “dummkopf”. Do Americans spell it the way you do, dumbkopf?
I probably mis-spelled it! 🙂
Really? That’s great actually. If they all say it can’t happen, then it looks more likely to happen.
There already is trend channel confirmation by a breach of a few hours of the downward channel around subminuette wave ii. Gold hit a low of 1,340.94 at 1:03 am. However there has been no strong wave up yet. Maybe after 2:00 pm?
Or perhaps Alan’s 5th wave down at 2:00 pm then gold moves up?
“After a new low below 1,341.45, then a subsequent breach of a channel containing subminuette wave ii would provide trend channel confirmation that the correction is over and a third wave up should be underway.”
“As soon as price makes a new low below 1,341.45 look out for an end to this downwards movement and the start of a strong wave up.”
Wow. The spike down was much more than I expected. That fifth wave down of micro c sure was menacing. At 1336.19, subminuette 2 was almost a 0.886 retrace of subminuette 1. Now, price surely is on the way up, a strong third wave.
Alan yes you were right about another drop that was an amazing call by you.
Yes Gold sure dropped fast the first minute to 1,336.19 and NUGT dropped $4 in 1 minute down to 145.51 and I saw it and jumped in.
I did buy some NUGT at 2:01:06 at 145.89 and sold it 1 minute later up $6 a share, too soon however FOMC moves really fast and I prefer to jump in and out with profits as gold and NUGT can jump around unexpectedly.
So this did happen.
“Or perhaps Alan’s 5th wave down at 2:00 pm then gold moves up?”
That was certainly a very good buy. Congrats, Richard.
If you think that was a big spike down, look at what happened to silver. A 4% spike down, and retraced all the way back up. But silver hit 19.36 level, I think that changes a lot of Lara’s analysis from last week… It’s definitely been weaker than gold…
Silver had forged ahead of gold when both began to rise. Now that it becomes weaker does not come as a surprise.
Alan does gold have to rise above the morning high of 1,346.43 at 4:09 am before dropping below 1,340.94 towards your target zone of 1339.17 – 1338.45 or is it likely just heading down there now.
Any idea if might hit the lower targets before the 2:00 pm FOMC minutes or after it’s release?
If you do have a crystal ball let me know where I can buy one. LOL.
Or perhaps it’s an EW crystal ball self developed over the years?
Richard.
I’m a bit confused by the price movement.
The rise from 1340.94 ought to be the fourth wave in micro c. (I could only count three waves down from 1352.02 to 1340.94. But, my count can be wrong. Yesterday, I was pretty sure that the move down from 1358.19 to 1341.18 was in three waves but Lara said five although it was not shown in her chart.)
Price has so far moved up to 1347, a 0.786 retrace of submicro 3. My invalidation point is 1347.88, otherwise price will move into submicro 1 territory.
If my count is wrong, then 1340.94 was the end of subminuette 2.
No, I’m afraid I couldn’t find the elusive crystal ball. Perhaps I should start playing Pokemon Go. It might then show up on my mobile.
Miners are selling off, but GOLD is relatively static. Wonder what that means…
When gold have had repeated down days miners take harder hits and oversell like today. Investors bail as sentiment drops and they wait for a bottom and bounce.
Also today is FED FOMC at 2:00 pm EST and fear of mention of interest rate hikes in minutes of last meeting that are being released today are a concern to miners investors holding lots in miners that are way up this year based on interest hikes of little concern as the FED keeps bluffing of hikes as the economy hits bumps in its recovery or inflation that doesn’t show up as feared.
It speaks volumes concerning the intelligence of the investing public, that any reasonably informed person would make any investing or trading decision on any other presumption than that FED hot air about possible interest rate hikes is nothing but a tissue of damnable lies. It truly boggles the mind. Adding to my GDX position on this dip.
I do concur. I suspect that the majority of the investing public trades on greed and fear. They have very short term memory, and that is why they readily imbibe any lie or falsehood that the Fed spin machine churns out. It is this blind unfaltering faith in the Fed and the media in cahoots with it that the chicanery can continue, and to work its magic time and time again. Isn’t that amazing?
I think that it is not that easy to manipulate the gold market as it is international in character. But miners are a different kettle of fish. They are mainly indigenous entities, and it is a simple matter for those with deep pockets to control their stocks. And that is why the price of the miners move so much more quickly. However, there is a silver lining. I do observe a pattern that is not so reliable but which works oftentimes to warrant attention: after a severe down day, miners will rebound with a vengeance in the next.
The price of Gold is at all time highs in just about every other currency except the dollar. The next inflection point will be the FED announcement of a rate CUT. Demand for the metals is now higher than when we had the silver shortage in 2008 and I suspect as soon as the rest of the lemmings get a clue, the availability of the actual metals at any price will dramatically shrink. Disappearing bids in the market place as a result of scarcity leaves only the miners. What do you think is going to happen to the price of producers at that point? I suspect too many folk investing in the miners are doing it for the wrong reasons.
Great explanations, thanks. I suppose we shall have to wait for the FOMC minutes event today to determine which way GOLD will break, at least for the near term.
Hi Lara, I run Motivewave with a data feed from Barchart via a regular (free) account, which includes intraday data delayed by 10 minutes. I find their cash volume (XAUUSD) unreliable, which I do not think is their fault.
Some say, a lot of forex trading is done via ‘bucket shops’. This probably includes many/all known forex brokers available to retail. The setup is essentially an internal betting casino. They go for external hedging (futures?) only when the internal bets become too one sided. So, volume in such an environment is not very meaningful or at lest is very difficult to determine.
Another story is futures. Your stockcharts data is for the ‘CME continuation futures contract’, which should be reliable. Comparing it with the forex volume from Barchart (^XAUUSD) is a bit of apples-vs-oranges. Should be compared with the futures volume from Barchart.
For volume from barchart I go with a future contract, either front month (GC*1) or next to front (GC*0). That comes nicely into Motivewave, day-end or intraday, 10-min delayed, for free. If you pay for data you likely have that real time. Price data is, of course, not identical to XAUUSD in this case.
Since you are so good with MW, you may perhaps find it useful to have you tech-analysis chart w/volume also in MW by feeding and plotting e.g. GC*0 from Barchart (that would be pretty much what you have from Stockcharts, but with real-time volume).
Hope this is some help.
Barchart futures symbols link — barchart.com/education/symbols.php
That doesn’t really help though because the symbols in Motive Wave using the BarChart data feed are not the same as the symbols on the BarChart website.
No one to date has been able to give me a list of the symbols in Motive Wave. Unbelievably I think such a list does not exist.
The symbols change.
enclosed below are illustration charts.
Futures w/volume in MW a la Stockcharts: GC*0 1 day.
Thanks VK.
I was crystal clear with BarChart that I needed data for the Gold CASH market. Not futures. Not options. Cash.
They sold me COMEX data. And tried to help me find the feed for cash in that. Which is rubbish, because now I find COMEX data is only futures and options, no cash.
So they’ve sold me a product I’m not using and don’t need, and have been hopeless in helping me find the correct symbol for the data I do need in Motive Wave.
Because the symbols in Motive Wave are not the same as the symbols BarChart use on their website. And MW can’t give me the symbol list, and BarChart can’t give me the symbol list….
I think I’m dealing with a bunch of muppets.
I don’t want to be doing EW analysis on any futures which is why I’m using XAUUSD from BarChart. I can’t find the data feed for the cash market on StockCharts….
Ideally I’d like to be using cash market data from both BarChart and StockCharts.
It should be easy to find… it’s not 🙁
Futures are highly leveraged markets, and so can have price extremes and swings that would invalidate an EW count.
For a better EW analysis it’s important to use cash market data.
Which is why I’m so keen on getting cash market data.
It should be easy. It should be relatively reliable. But it’s not.
I see the dilemma. I am afraid though there is no one established notion/place/exchange as the ‘Gold Cash Market’. There is spot trading different places (London, perhaps now also in China, certainly not at COMEX), but I am not sure those specific volume figures (if available) are representative for the entire gold market. The most representative (most $$) volume data probably are those for COMEX futures (via Stockharts or Barchart). Some estimate trading in physical gold at only about 1% of the trading volume in futures. Hard to see anybody can put an accurate number on gold forex trading (XAUUSD, essentially a fictitious currency pair) for reasons I mentioned above. Anyway, that’s all of my brain..
Thank you VK.
I’ll stick with the forex Gold prices from BarChart. It’s as close as I can get to cash market data.
I’m able to trade the cash market via CFD’s with my broker.
And yes, with a global market like this I agree, getting accurate consolidated data is not going to be easy. I would expect that the US data would be easy though, as it’s probably the largest geographic section of the market.
Looks like GOLD is very close to the target for subminuette wave ii, per the primary hourly count.
Yes at 1:03 am gold dropped to 1,340.94 and bounced up and the hourly chart shows target 1,339 subminuette wave ii, Micro C.
Micro wave C would be very likely to move at least slightly below the end of micro wave A at 1,341.45 to avoid a truncation. As soon as price makes a new low below 1,341.45 look out for an end to this downwards movement and the start of a strong wave up.
After a new low below 1,341.45, then a subsequent breach of a channel containing subminuette wave ii would provide trend channel confirmation that the correction is over and a third wave up should be underway.
Hammer on last hourly ,possible double bottom as well, let’s see what happens
I agree.
Right now, there should be one final fifth down for micro c, dropping below the low of 1340.94 to avoid a truncation. I’ll target 1339.17 – 1338.45.
I have received a reply from BarChart regarding the change in volume data:
“Hi Lara,
I believe the XAUUSD exchange rate trades in the Forex market so volume statistics can be hard to pin down at any given time seeing as the overall size of the market as well as a lack of one exchange. With that in mind, the original volume could represent a preliminary figure until the “final” total volume is computed from the larger participating institutions. ”
Members may draw their own conclusions. I think we’ll move on. I’ll be checking GLD data daily and using that as a base or guide as to which (COMEX or StockCharts) volume data may be more accurate.
I don’t know how you do it Lara, you keep getting better and better.
Maybe that’s your personal motto?
As for your competition you leave them all in the dust and it’s not gold dust.
Thank you very much Richard for the kind words.
I like to be accurate I guess. Wouldn’t mind some gold dust actually 🙂
Lara you will get a Pot of Gold Dust at the top of intermediate wave (3), when it may be time to cash out for a few weeks correction in intermediate wave (4). Then you can laugh all the way to the bank and maybe buy yourself another surfboard and accessories.
oooooh yes..
Another Roger Hall longboard, 10′ this time please
With custom artwork by Cesar….
A snip at about $3,000