
Upwards movement was expected.
Price moved sideways in a narrow range, but did make a higher high and a higher low from the prior session.
Summary: In the short term, a counter trend movement should end within the next 24 hours a little below 1,346.27 but not below 1,340.01. Thereafter, price should turn upwards. The target for the main wave count remains at 1,582. Substantial confidence in the main wave count may now be had if price can move above 1,366.87. A new low below 1,310.84 would invalidate the main wave count and confirm an alternate. Prior to that, a new low below 1,334.06 would shift probability from the main to the alternate wave count. A target for downwards movement to end would be 1,279.
New updates to this analysis are in bold.
Last weekly charts, and a more bearish weekly alternate, are here.
Grand SuperCycle analysis is here.
DAILY ELLIOTT WAVE COUNT
Click chart to enlarge.
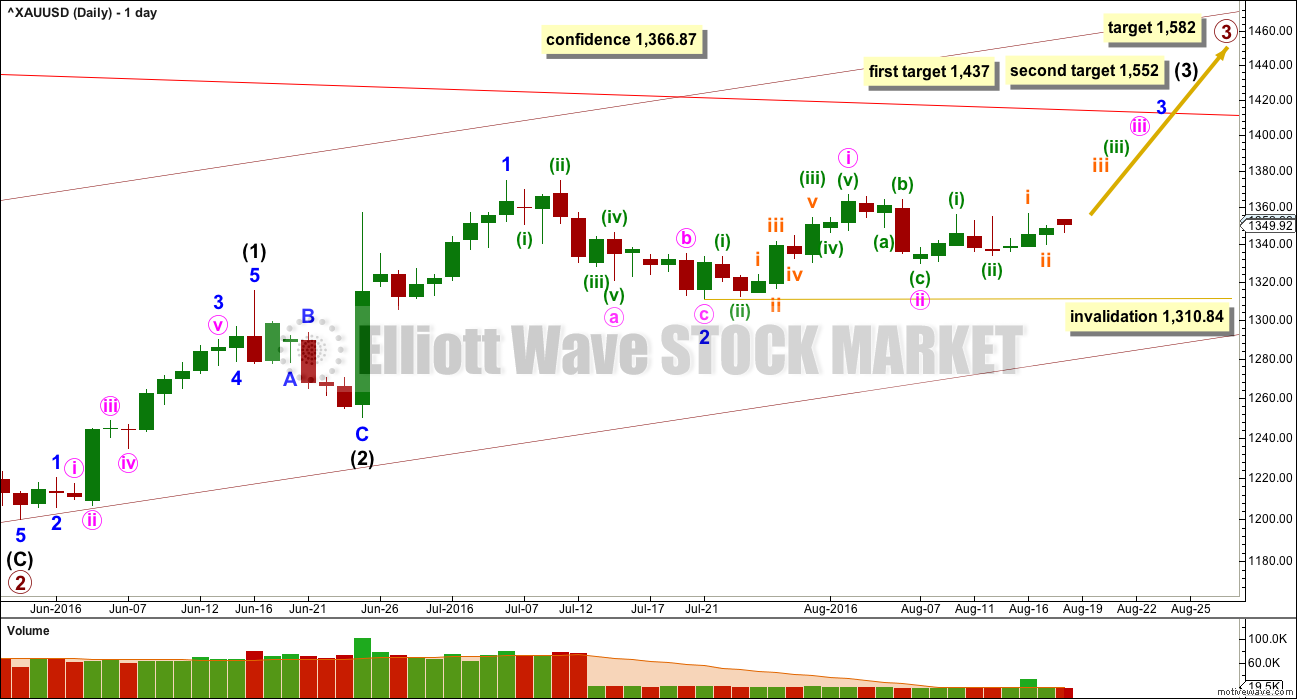
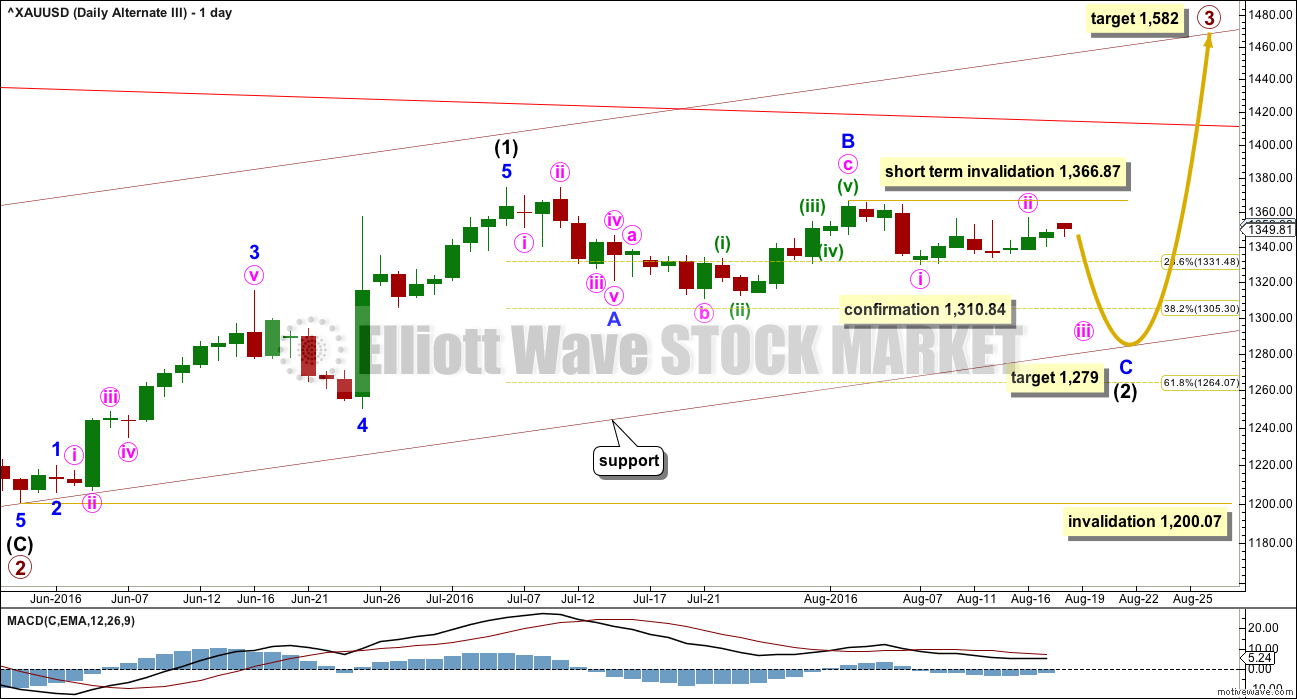
Primary wave 2 is a complete expanded flat correction. Price from the low labelled primary wave 2 has now moved too far upwards to be reasonably considered a continuation of primary wave 2. Primary wave 3 is very likely to have begun and would reach 1.618 the length of primary wave 1 at 1,582.
Primary wave 3 may only subdivide as an impulse.
So far intermediate waves (1) and (2) may be complete within primary wave 3. The middle of primary wave 3 may have begun and may also only subdivide as an impulse.
Within intermediate wave (3), the end of minor wave 1 is moved up to the last high. This fits on the hourly chart although it looks odd here on the daily chart. There was a small fourth wave correction up at the end of minor wave 1 and it subdivides on the hourly chart as an impulse. Minor wave 2 may be a complete zigzag, also subdividing as a zigzag on the hourly chart. If minor wave 2 is over, it would be 0.50 the depth of minor wave 1.
With overall sideways movement now for the last seven days, it looks entirely possible that minute wave ii may not be over. Sideways movement may be a corrective structure for an X wave to join two zigzags in a double. Minute wave ii may yet move a little lower to complete as a double zigzag.
Minute wave ii may not move beyond the start of minute wave i below 1,310.84. This is the final risk to any long positions entered here or which members may still be holding.
At 1,437 intermediate wave (3) would reach 1.618 the length of intermediate wave (1). If price keeps going upwards through this first target, or if it gets there and the structure is incomplete, then the next target would be at 1,552 where intermediate wave (3) would reach 2.618 the length of intermediate wave (1).
There may now be six overlapping first and second waves complete: primary, intermediate, minor, minute, minuette and subminuette. This wave count expects to see an increase in upwards momentum. The increase in upwards momentum should be imminent.
A new high above 1,366.87 would invalidate the alternate wave count below and provide price confirmation of this main wave count.
Primary wave 1 lasted 14 weeks and primary wave 2 lasted 12 weeks. Primary wave 3 should be longer in both price and time as it should be extended. It may be about a Fibonacci 34 weeks. So far it has lasted ten.
FIRST HOURLY ELLIOTT WAVE COUNT
Click chart to enlarge.
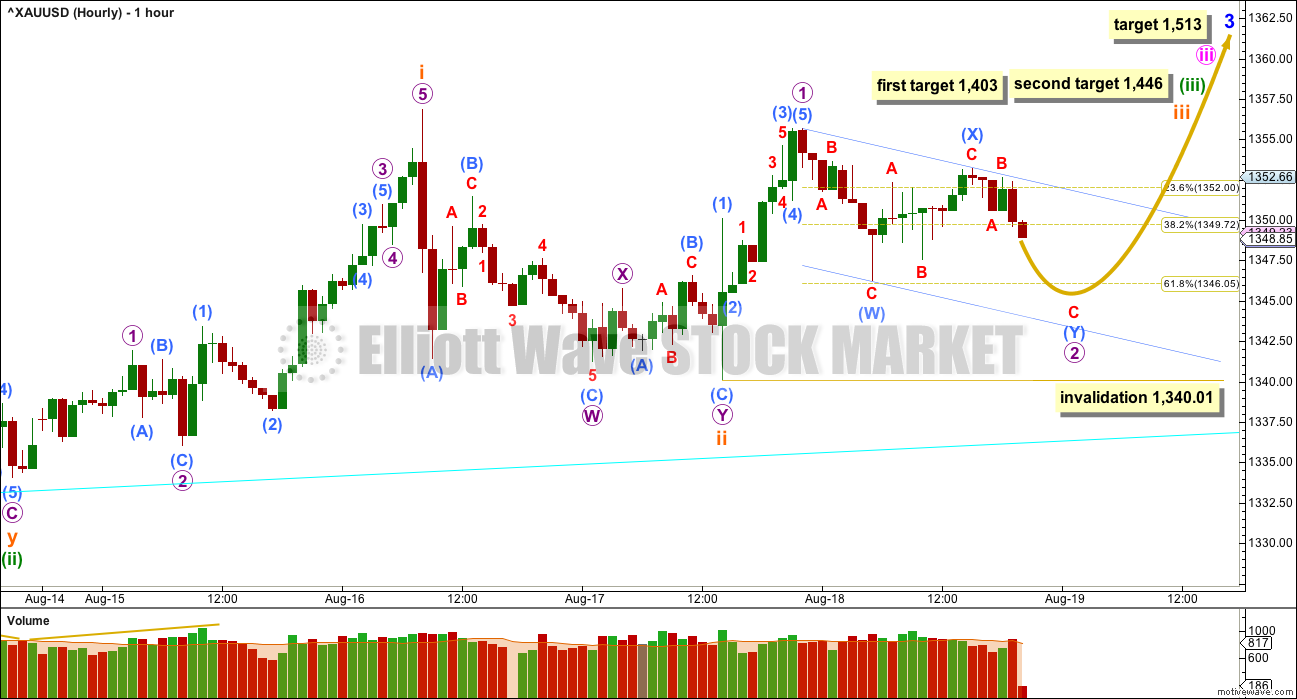
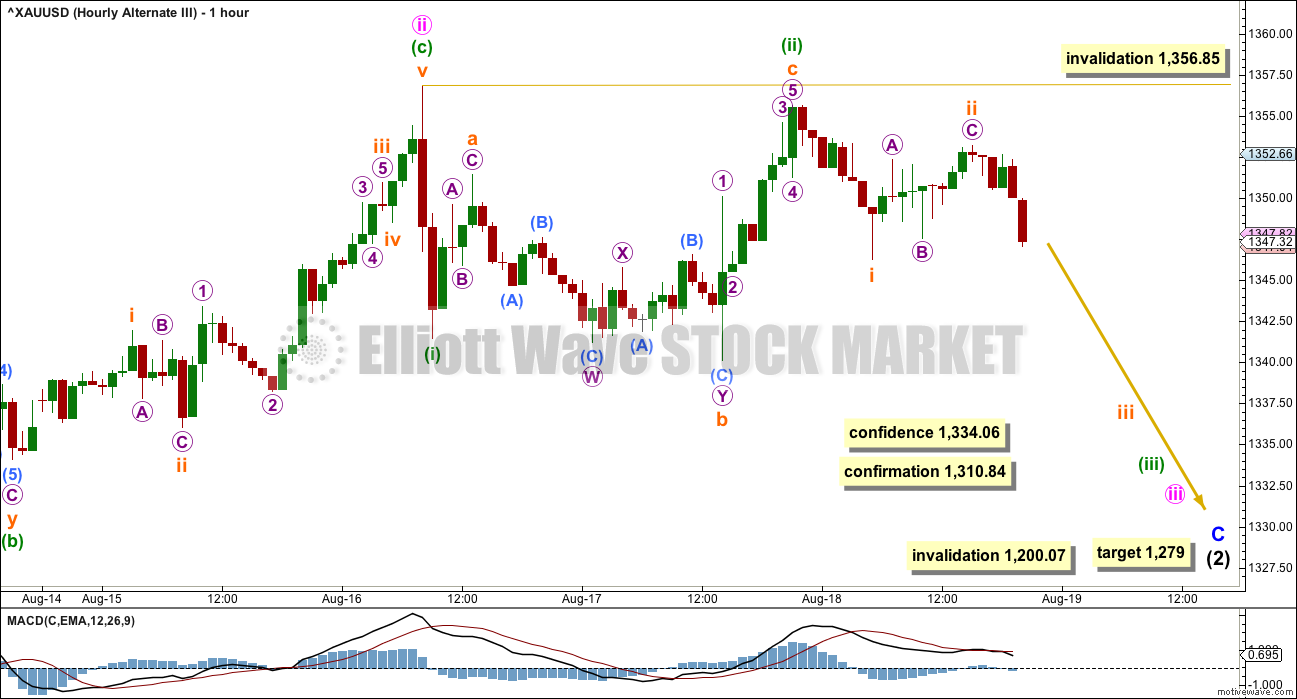
At 1,403 minuette wave (iii) would reach 2.618 the length of minuette wave (i). If price keeps rising through this first target, or if when it gets there the structure is incomplete, the second target would be used. At 1,446 minuette wave (iii) would reach 4.236 the length of minuette wave (i).
The target for minor wave 3 remains the same. At 1,513 minor wave 3 would reach 1.618 the length of minor wave 1.
The structure of subminuette wave ii is problematic here, so a second hourly chart is provided. If subminuette wave ii is over, then it may subdivide as a double combination: zigzag – X – flat. Within the zigzag of micro wave W, the subdivisions of submicro wave (C) do not fit well. This will fit as a five wave impulse on the five minute chart, but it looks strongly like a three wave movement on the hourly chart. This is problematic.
However, it still looks most likely that subminuette wave ii is complete. The proportion between subminuette wave i lasting 41 hours and subminuette wave ii lasting 30 hours looks good, and the depth at over the 0.618 Fibonacci ratio sees this small correction most likely over here.
Within subminuette wave iii, micro wave 1 fits well as an impulse and micro wave 2 looks to be incomplete. Micro wave 2 may move a little lower as a double zigzag. Submicro wave (Y) should end below the end of submicro wave (W) at 1,346.27, so that it deepens the correction and achieves the purpose for a second zigzag in a double. Micro wave 2 may not move beyond the start of micro wave 1 below 1,340.01.
If price does move below 1,340.01, it should not be by much or for long. If 1,340.01 is breached, then use the second hourly wave count below.
A new high above 1,356.85 would see the second hourly wave count invalidated and provide confidence in this first hourly wave count.
SECOND HOURLY ELLIOTT WAVE COUNT
Click chart to enlarge.
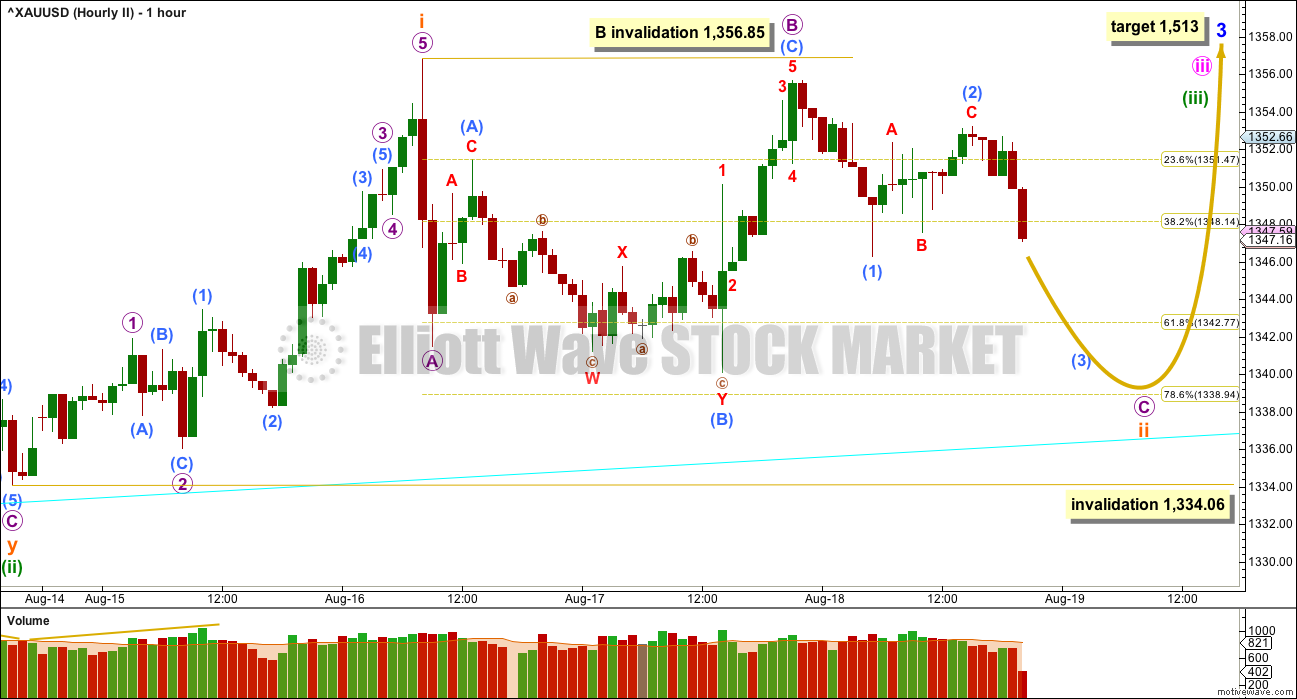
It is also possible that subminuette wave ii is an incomplete zigzag.
Within this structure, micro wave A subdivides as a five wave impulse. Micro wave B may not move beyond the start of micro wave A above 1,356.85.
Micro wave B may be a complete expanded flat correction. Micro wave C downwards must subdivide as a five wave structure and is very likely to make at least a slight new low below the end of micro wave A at 1,341.45 to avoid a truncation.
When micro wave C is complete, then a trend change and a new strong upwards wave should begin for Gold. If price gets down low enough, it should find strong support at the cyan trend line.
Subminuette wave ii may not move beyond the start of subminuette wave i below 1,334.06.
THIRD WAVE EXAMPLE – DAILY CHART
Click chart to enlarge.
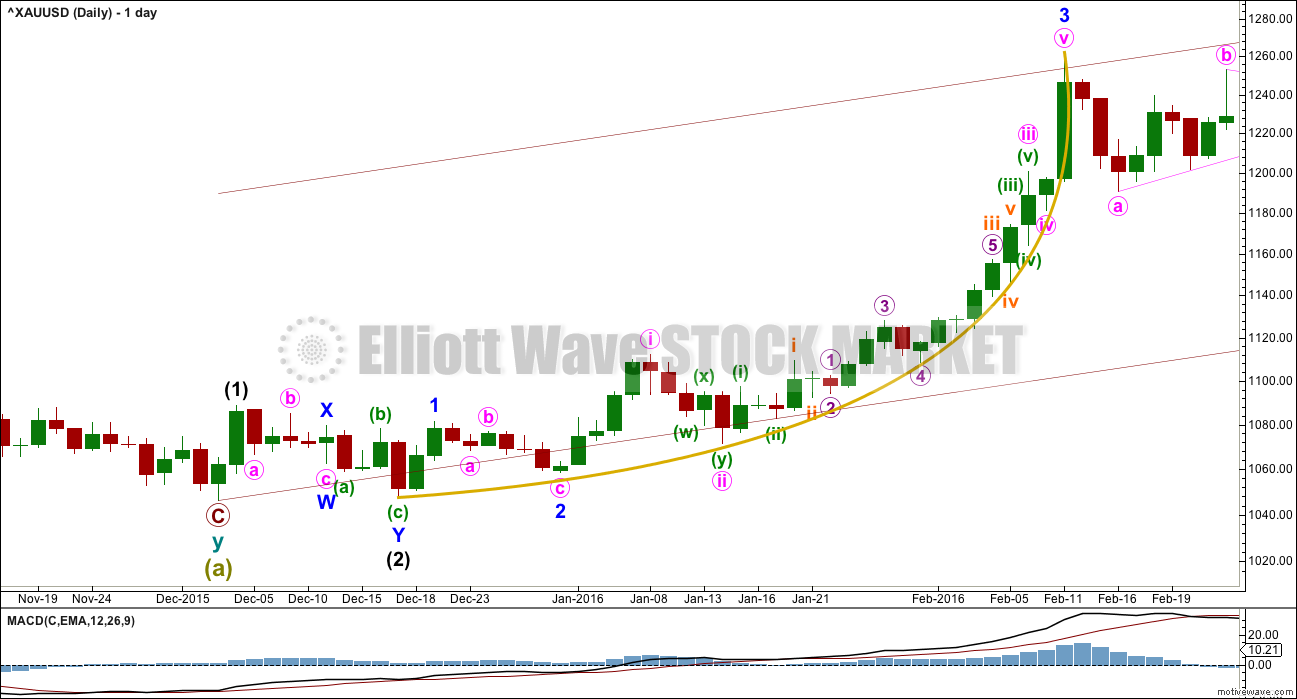
In discussing the curved look to Gold’s impulses, particularly for its third waves, here is an example.
Within primary wave 1, the third wave of minor wave 3 had a strong curved look to it. The impulse begins more slowly and has deep and relatively time consuming second wave corrections: Minor wave 2 was 0.68 of minor wave 1, minute wave ii was 0.76 of minute wave i, minuette wave (ii) was 0.56 of minuette wave (i), and subminuette wave ii was 0.64 of subminuette wave i.
The curved look comes from the disproportion between second and fourth wave corrections within the impulse. Here, minute wave ii lasted 4 days and shows clearly on the daily chart yet minute wave iv was over within one day and does not show up with any red candlesticks or doji on the daily chart.
Momentum builds towards the middle of the impulse, continuing to build further during the fifth wave and ending in a blowoff top. This is typical of Gold and all commodities.
This tendency to blowoff tops and curved impulses is particularly prevalent for Gold’s third waves.
ALTERNATE DAILY ELLIOTT WAVE COUNT
Click chart to enlarge.
This wave count is identical to the main wave count up to the end of primary wave 2. Thereafter, what if only intermediate wave (1) ended at the last high?
This movement will fit as a five wave impulse, although it does not have a very good look on the daily chart. This reduces the probability of this wave count.
If intermediate wave (1) was over at the last high, then it may have lasted 27 days. So far intermediate wave (2) may have taken 31 days and would still be incomplete. The proportions of this part of the wave count look slightly better than the main wave count.
There is a problem now with structure on the hourly chart within minor wave C. Minute wave i would have to be complete. It will fit on the hourly chart, but it does not have a good look as a five and looks better as a three on the hourly and daily chart levels. This slightly reduces the probability of this wave count.
Within minor wave C, minute wave ii may not move beyond the start of minute wave i above 1,366.87.
Minor wave C must be a five wave structure. So far within it minute waves i and ii would be complete. Minute wave iii downwards should be underway.
At 1,279 minor wave C would reach 1.618 the length of minor wave A. Price may end downwards movement when it finds support at the lower edge of the maroon base channel drawn about primary waves 1 and 2.
Intermediate wave (2) may not move beyond the start of intermediate wave (1) below 1,200.07.
ALTERNATE HOURLY ELLIOTT WAVE COUNT
Click chart to enlarge.
In order to make a reasonable judgement of each Elliott wave count, it is at this stage important to see how each wave count sees recent structure at the hourly chart level.
Within minute wave iii, no second wave correction may move beyond its start above 1,356.85. A new high above this point at this stage would invalidate this alternate at the hourly chart level, but not the daily chart level. That would add confidence to the main wave count.
Minor wave C must subdivide as a five wave structure. If price makes a new low below 1,334.06, then the probability of this alternate would increase. It would be confirmed with a new low below 1,310.84.
If price moves below 1,310.84, then expect more downwards movement for a deeper pullback to end about 1,279. Look also for price to find support at the maroon channel on the daily chart. The target at 1,279 may be a little too low; the maroon trend line may stop price before it reaches the target.
TECHNICAL ANALYSIS
WEEKLY CHART
Click chart to enlarge.
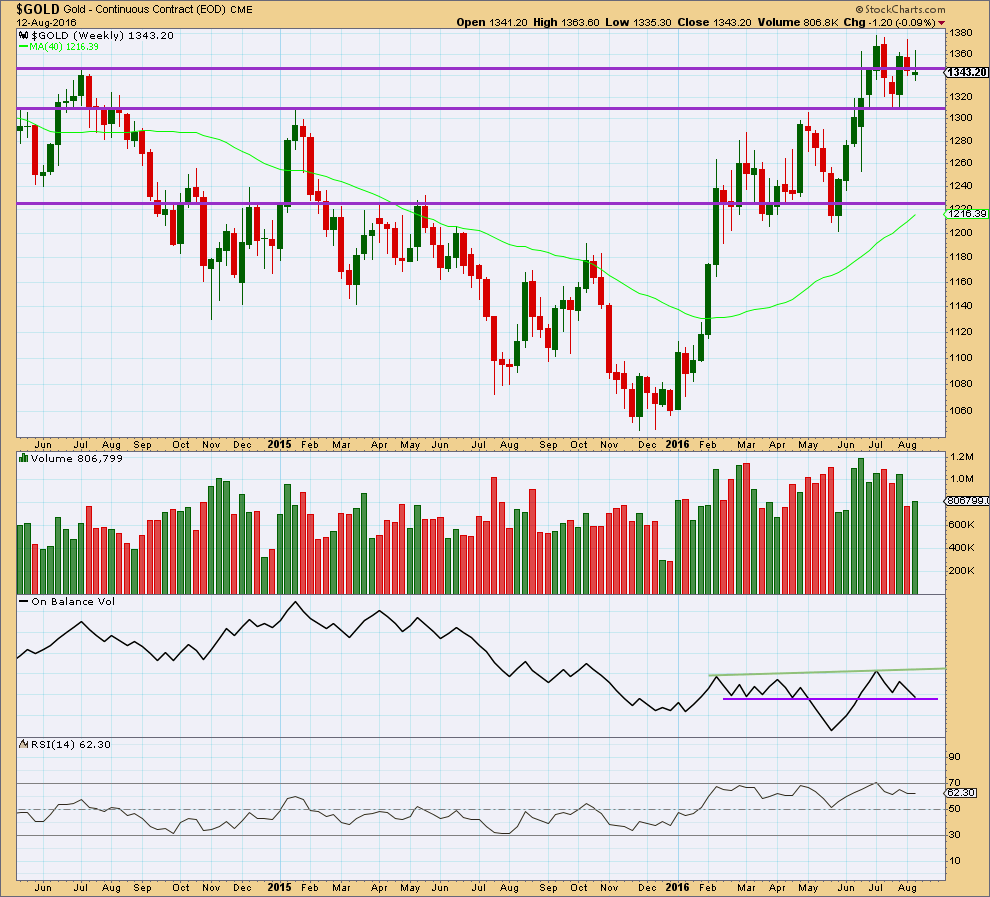
Last week completes a lower high and a lower low. The week closed slightly above the open and the candlestick is green but not by much. Overall, last week looks corrective. A slight increase for a green week gives slight support to a bullish wave count.
If the lower purple line on On Balance Volume is drawn carefully across 7th of March and 18th of April, then it was touched at the end of last week. This trend line has been weakened with OBV breaking below and then returning above it, but it still has some technical significance. A break below the purple line would be a bearish signal but a relatively weak one. A break above the green line would be a bullish signal.
RSI is not extreme. There is room for price to rise or fall.
DAILY CHART
Click chart to enlarge.
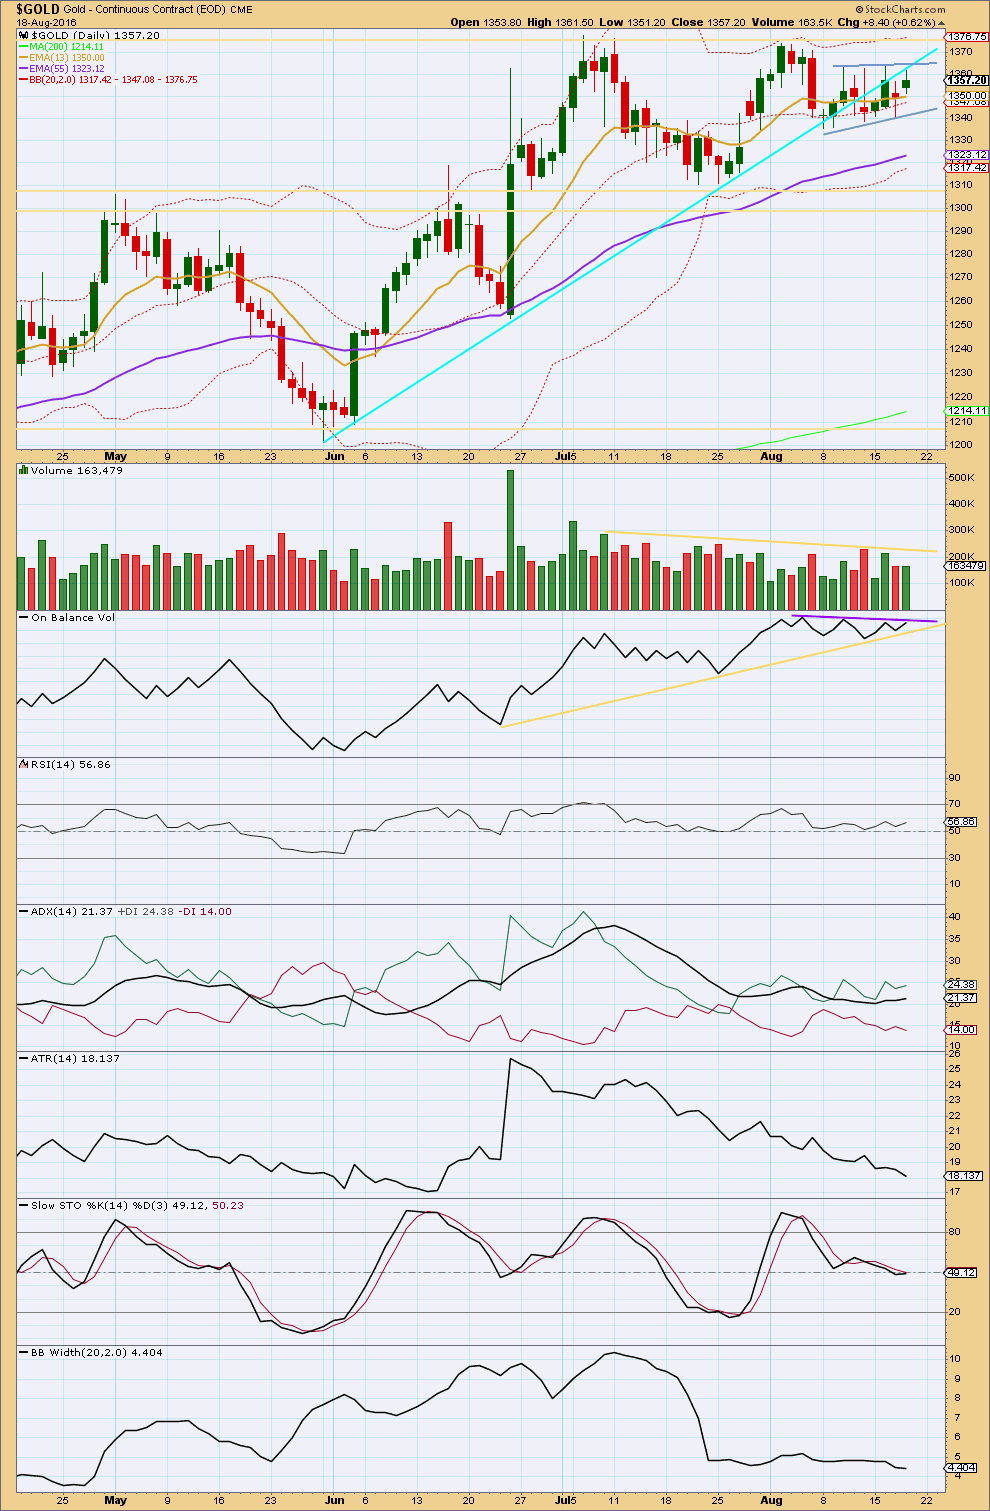
A small sideways consolidation within the larger consolidation is forming, and it has a slight upwards bias. This should not technically be read as a flag though; it is not a pattern within a steep downwards trend.
As price is moving sideways since about 7th of July, volume is still overall declining. During this time, it is still the upwards day of 8th of July that has strongest volume suggesting an upwards breakout is more likely than downwards. The next strongest day is a downwards day of 25th of July, and after that another upwards day of 21st of July. With two of the three strongest days upwards days but one a still strong downwards day, the direction indicated for a breakout by volume is not as clear as it could be.
Price today completed a green daily candlestick with a higher high and a higher low than the day before. This comes with lighter volume though; the rise in price was not supported by volume. A little more downwards movement may be expected; this supports the hourly Elliott wave counts short term.
Price broke below the longer term cyan trend line and is now finding some resistance there.
The purple resistance line on On Balance Volume has been redrawn today. It is providing some resistance today. The yellow line continues to provide support. A breakout by OBV may precede a breakout by price, so OBV may indicate a direction for price. The breakout should be close with these trend lines quickly converging now, so OBV should be watched carefully.
Price needs to break above resistance at 1,375 or below support at 1,310 – 1,305 on a day with increased volume for a breakout to be indicated and the next trend to begin. That has not happened yet.
RSI is just above neutral. There is plenty of room for price to rise or fall.
ADX today is again very slightly increasing. With a very slight upwards bias to price over the last eight days, a small weak upwards trend may be indicated.
ATR is still declining, indicating the market is not trending. It does look fairly clear that the market is range bound, with price bound by resistance and support lines, and not yet trending despite what ADX is saying today. The signal from ADX may be an early warning of an upwards breakout.
Stochastics is neutral. There is very slight bullish divergence between Stochastics and price from the low of 9th of August to the low of 17th of August: Stochastics made a slightly lower low while price made a slightly higher low. This divergence is weak and sometimes unreliable; it is noted but should not be given much weight in this analysis.
A range bound trading approach to this market at this time would still expect a continuation overall of a downwards swing to end only when price finds support about 1,310 – 1,305 and Stochastics reaches oversold at the same time. However, with this consolidation now very mature a breakout should be very close. The final expected swing within a consolidation sometimes does not arrive as price breaks out. That may be the case at this stage. The safest approach to this market at this time would be to wait for a breakout to be clear before entering.
Bollinger Bands remain tightly contracted, so it should be expected they will soon expand as volatility returns and price begins to trend again. Price is no longer finding support right at the mid line of the bands, but price does remain mostly within the upper half of the bands and mostly above the 13 day moving average at this time.
This analysis is published @ 09:26 p.m. EST.
With the first hourly chart invalid and the second confirmed, this correction now fits as a double zigzag for subminuette ii.
So now we have within the early stage of primary 3 five overlapping first and second waves.
There are two ways to look at this market at this time: get frustrated with this small range essentially sideways move, and get spooked and uncertain by the chop.
Or stick to the plan, manage risk and see it as an opportunity to get positioned for the next big move.
Probability is on the side of the next move being up.
But please everyone remember, what we are doing here is an exercise in probability not certainty.
The main wave count could be wrong which is why it is absolutely essential to use stops. Risk and stops may now be moved up to just below todays low at 1,338.06.
The other golden risk management rule is do not invest more than 3-5% of equity on any one trade. Reduce position size to meet the rule.
I see someone noted below that 80% of traders over a year lose money. I strongly suspect that is because they’re not managing risk, which means they’re letting greed rule them.
Risk management is boring and not liked by many, but it is the single most important aspect of trading.
If members new to EWG this week learn nothing else from me, it is to manage risk. Use stops and keep position size within the rule.
That’s well said, and in my view you can’t emphasize too much the importance of risk management.
I would like to add something on that topic, especially applicable to gold. There are many ways to invest or trade gold, as you all are aware, including gold (ETN) funds, individual stocks, ETF’s, and associated derivatives. One trap that is easy to get into is to invest in more than one of these instruments, thinking that you are diversifying yourself. This is NOT TRUE, because, while there may be some variation in how these instruments respond to the price of gold, they are all highly correlated to it. So when Lara rightly cautions against deploying more than 3-5% of your capital in this market, its best to consider that amount as the total of all your gold (and silver) investments together. Spreading out your investment over a number of stocks or other instruments only adds a minimal degree of diversification, and is not adding any significant safety to your account. Consider your exposure to gold as the total of all your gold related investments, and you will be much better off when the unexpected happens.
I quite agree. Although I must confess it has crossed my mind once or twice that there is a cabal of hedge fund managers and central bankers with a department dedicated to looking for EW third wave set ups… 🙂
Stocks stumble lower as Fed rate-hike debate rages
U.S. stocks were trading lower on Friday afternoon as investors worried about whether the Federal Reserve will raise interest rates as early as September.
http://www.marketwatch.com/story/us-stocks-poised-for-losses-as-fed-rate-hike-debate-rages-on-2016-08-19
The odds of day trading yourself to a profit are lower than you expect.
Aug 19, 2016 3:05 p.m. ET
http://www.marketwatch.com/story/the-odds-of-day-trading-yourself-to-a-profit-are-lower-than-you-expect-2016-08-19
Blackjack may offer better odds than day trading.
An analysis of trading-platform data shows that 80% of day traders are unprofitable over the course of a year
When we get to talking here about five and six degrees of imbedded 1>2 moves down to sub-micro levels and possibly below, I can’t help getting a bit concerned. Something just doesn’t feel right at the moment.
Maybe it’s best to stand by and wait for things to clear up a bit?
Yes details now way too nit-picky.
I’m just looking for a big rich day trading wave.
I agree. I’m in this market not because of all the nitpicking intra-day calls and speculation, but because the GLD daily chart looks bullish, along with the seasonals lining up. Probabilities are on our side at this point.
Close-up
Dreamer, channels are never written in stone and the boundaries are flexible. Only a definitive break is convincing IMO.
What do you consider definitive? Looks like today’s candle is fully outside the channel. Also, the junior miners are selling off harder than the seniors. Not a good sign IMO
Juniors would sell off faster than the seniors on a very bearish gold day.
GDX may be giving us a warning today
Possible double zig-zag down complete? Any thoughts?
A double zigzag would explain why it too so long.
I was looking at a single.
Beautiful chart thanks for sharing.
Have you considered adding a Slow Stochastics?
Thank you for Richard, motive wave makes it easy though I would say. I was using slow stochastic but I feel its a little unreliable vs RSI imo. I feel your pain Alan with the patience, the last 2 weeks have been testing by these range bound markets
Paul so that is the Motive Wave advertised on Lara’s site?
Is it all automated and very accurate?
Do you think it would help with day trading NUGT?
Hi Paul. Good work.
I am hesitant to accept submicro ii as indicated as I can see another possibility.
Your (y) may be only the “a” of (y). There looks like five waves down for “a”.
The high reached after that is “b”, so far at 1344.04. By contrast, “x” is at 1344.28.
I suspect there could be another wave down “c” to complete (y). This is negated should “b” move higher than 1344.28.
Just waiting with strained patience.
OK. Ignore my comment. Price has gone above 1344.28.
Submicro 2 was over at the low of 1340.82.
Alan does that mean submicro 2 of micro 3 and gold will move up now?
Gold at 1:20 pm just made a new market hours day low at 1,340.88.
Likely its many conspiracy theories in a descending vortex with a touch of HFT for good measure to really upset the EW followers who think they don’t have to worry about the conspiracies.
LOL.
Is 1,341.89 at 11:32 am the bottom of a 2nd wave from 1348.09 at 10:05 am and gold may be making it’s way back higher?
Or is 1,341.89 at 11:32 am only part way down and likely gold drops closer to 1137.83 before the close?
I’m thinking of buying NUGT here at 150.04 at 12:35 for the move up if that may happen if wave 2 down is over.
Might be a profitable play if you are not already well exposed to this market as I am.
Those second waves have a habit of dropping below 0.618 Fib. I’m still waiting to see if it bottoms.
Alan Tham,
Assuming Correction for Micro 2 was over at 8:30 AM low. Peak at 10:05 (has 5 impulsive waves up) are you marking it as a miniscule 1 of Submicro (1) OR as Submicro (1) under Primary Count?
Hi ssandysc.
At this moment, I’m not perturbed by what degree the upmove (if correct) is. I have learnt that by trying to align the movement early on in a trend change it may be a futile waste of time. I will let price develop before making an educated guess.
Right now, I’m trying to figure out how to deal with a continuation of the alternate if it proves to be correct. If I can safely rule out the alternate, then it will be a good time to load up for the strong uptrend.
Thanks Alan , I agree…
I let go of all the conspiracy theories and just trade what shows up.
Not so sure about that, Richard… if there’s no conspiracy, then how do the market movers know EXACTLY where I placed my stops??? : )
Curtis.
I have mooted this point before. Those big whales who have every intention to control the market would surely have in their employ technicians, Elliott Wave, Gann, what have you.
They would surely be able to come up with the inflection points like you and I. Outfitted with expensive proprietary computer software and algorithms, this will certainly be a breeze. So, they know precisely when traders will buy in, and where their stops are likely to be. With their HFT computers, could they not easily run your stops?
Just joking Alan. I’m actually with Richard on this — trading the charts as they are, with EW analysis and some trusted indicators to help. That’s tricky enough. I don’t have the mental space to also factor in a layer of two of conspiracy analysis.
Agreed Richard. It’s all in the charts. If it isn’t, we’re all just wasting our time 🙂
Eli, that is a very profound statement. That is the wisest thing I have heard in a long time.
Curtis.
I have mooted this point before. Those big whales who have every intention to control the market would surely have in their employ technicians, Elliott Wave, Gann, what have you.
They would surely be able to come up with the inflection points like you and I. Outfitted with expensive proprietary computer software and algorithms, this will certainly be a breeze. So, they know precisely when traders will buy in, and where their stops are likely to be. With their HFT computers, could they not easily run your stops? It’s a big bad world out there.
You would think so. But I sometimes wonder if we assume too much smarts to them.
Yes, that’s a proper word.
I remember Prechter telling a story of a large brokerage house on Wall St firing all of their technical analysts just before the stock market peak of 2000. They decided technical analysis was a load of rubbish and didn’t need it anymore.
I guess those TAs had been warning of weakness and they didn’t want to hear.
It has now become a routine for second waves to correct to 88.6% or more. For the main count, at the current low of 1337.83, the retrace is nearly 94.1%.
That point is also submicro 3 of micro c of subminuette 2 of the 2nd daily/hourly, and subminuette 3 of minuette 3 of the alternate. Both are almost at the 1.618 Fib retrace.
Alan you think that the overnight low of 1,337.83 at 8:29 am is submicro 3 of micro C of subminuette 2.
That means that main hourly count was invalidated below 1,340.01 and now using the main Hourly II and you think it still has deeper to go to complete submicro 5 of micro C of subminuette 2
Richard.
Lara’s 1340.01 is the same point on pmbull as 1336.19. Since I am using pmbull data, the main count is not invalidated. It came close, at 94.1% as mentioned above.
Ok the main hourly is still valid, however submicro 4 may have just topped at 1348.09 at 10:05 am and there is still a deeper submicro 5 to drop to a new day low?
Apologies, I did not make myself clear.
The correction is complete in the main count.
Submicro 3 only applies to the 2nd and the alternate.
Latest update: At 1348.09, price has entered into submicro 1 territory (at 1346.16) for both the 2nd and the alternate. So, my hourly count for both has been invalidated.
Right on time, here comes the bankster smackdown in the PMs. They are nothing if not persistent! ( and predictable) 🙂
Its not the bankers; its actually China. They have been the ones trying to keep the price low while they build up their reserves.
Frankly I have been a but surprised that they have not tried to acquire more of the US producers with substantial high grade proven reserves as that seems more efficient than buying the metal. I know they have already implemented a policy that keeps every ounce of gold mined in the country from being exported so it could be that they do not think they will be able to do the same with mines outside the country. The do own most of the production of the Australian mines already.
I think China is wary of the vagaries of the US dollar. Buying US producers subjects them precisely to that. With four rounds of QE so far, there is nothing from stopping the US from continuing ad infinitum. And this obviously dilutes the worth of the US dollar. It has been held up arbitrarily. Once the safety rug of that faith has been pulled out from under its feet, the deep abyss comes into view. Furthermore, there has been rumours circulating that a world currency is going to debut on September 30.
Gold, on the other hand, need not be dictated by US dollars. Once China puts its economy in order, it can price gold (and also silver) in the yuan. The key concept is price control.
Lara, just a suggestion, I think it would be good to add your
THIRD WAVE EXAMPLE – DAILY CHART to the reference section on the right
Good idea.
The hourly candle ending at 10 pm central hit a low of 1345.72; more importantly with a huge volume spike equal to the FED release hour yesterday (data from PMbull.com). Hopefully that was the end of micro 2… Lets see how high the Asian and Eurpean markets will take gold up before the usual US pre-market smack down 🙂
We have a rare sextuplet of threes to the upside. This ought to be fun! 🙂
The fifth wave up for silver ought to be even more spectacular….
Oh wait! We haven’t got to submicro, and then after that comes miniscule! And judging by this market, its going to find some additional even lower level subdivisions to work its way through before it gets going 🙁
Possibly 🙁
I will consider any pullbacks an opportunity…espcially if Silver remains above 19.20 🙂