
A short term downwards movement was expected to end a little below 1,346.27 but not below 1,340.01.
Price broke a little below 1,340.01 to reach 1,338.06 invalidating the first hourly Elliott wave count and unfolding as expected for the second hourly Elliott wave count.
Summary: Monday should see upwards movement. The target for the main wave count remains at 1,582. Substantial confidence in the main wave count may now be had if price can move above 1,366.87. A new low below 1,310.84 would invalidate the main wave count and confirm an alternate. Prior to that, a new low below 1,334.06 would shift probability from the main to the alternate wave count. A target for downwards movement to end would be 1,279.
New updates to this analysis are in bold.
Last weekly charts, and a more bearish weekly alternate, are here.
Grand SuperCycle analysis is here.
DAILY ELLIOTT WAVE COUNT
Click chart to enlarge.
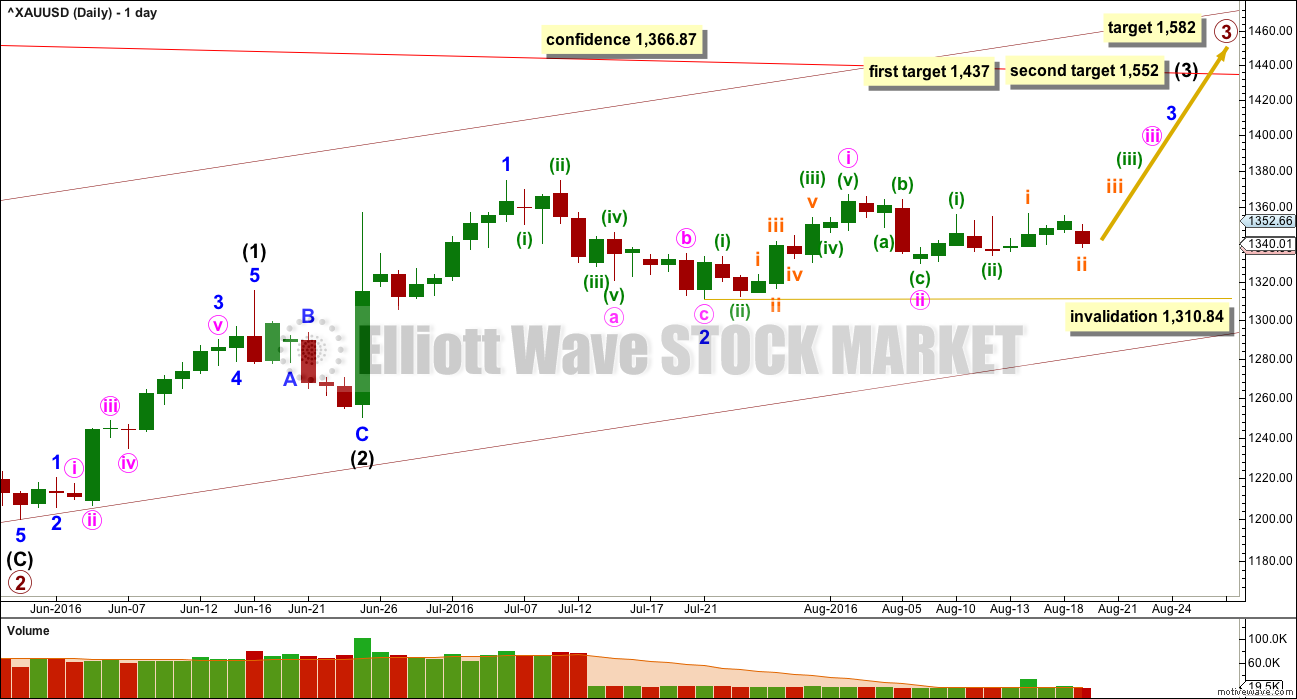
Primary wave 2 is a complete expanded flat correction. Price from the low labelled primary wave 2 has now moved too far upwards to be reasonably considered a continuation of primary wave 2. Primary wave 3 is very likely to have begun and would reach 1.618 the length of primary wave 1 at 1,582.
Primary wave 3 may only subdivide as an impulse.
So far intermediate waves (1) and (2) may be complete within primary wave 3. The middle of primary wave 3 may have begun and may also only subdivide as an impulse.
Within intermediate wave (3), the end of minor wave 1 is moved up to the last high. This fits on the hourly chart although it looks odd here on the daily chart. There was a small fourth wave correction up at the end of minor wave 1 and it subdivides on the hourly chart as an impulse. Minor wave 2 may be a complete zigzag, also subdividing as a zigzag on the hourly chart. If minor wave 2 is over, it would be 0.50 the depth of minor wave 1.
With overall sideways movement now for the last seven days, it looks entirely possible that minute wave ii may not be over. Sideways movement may be a corrective structure for an X wave to join two zigzags in a double. Minute wave ii may yet move a little lower to complete as a double zigzag.
Minute wave ii may not move beyond the start of minute wave i below 1,310.84. This is the final risk to any long positions entered here or which members may still be holding.
At 1,437 intermediate wave (3) would reach 1.618 the length of intermediate wave (1). If price keeps going upwards through this first target, or if it gets there and the structure is incomplete, then the next target would be at 1,552 where intermediate wave (3) would reach 2.618 the length of intermediate wave (1).
There may now be six overlapping first and second waves complete: primary, intermediate, minor, minute, minuette and subminuette. This wave count expects to see an increase in upwards momentum. The increase in upwards momentum should be imminent.
A new high above 1,366.87 would invalidate the alternate wave count below and provide price confirmation of this main wave count.
Primary wave 1 lasted 14 weeks and primary wave 2 lasted 12 weeks. Primary wave 3 should be longer in both price and time as it should be extended. It may be about a Fibonacci 34 weeks. So far it has lasted eleven.
HOURLY ELLIOTT WAVE COUNT
Click chart to enlarge.
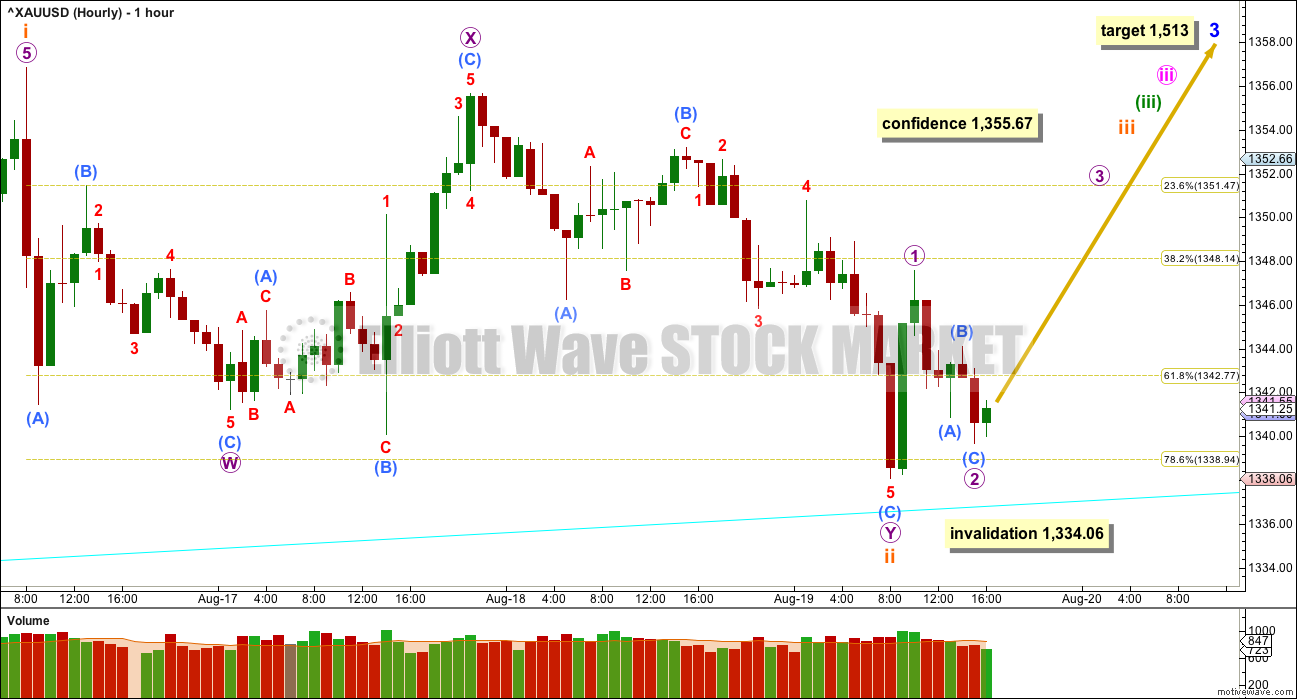
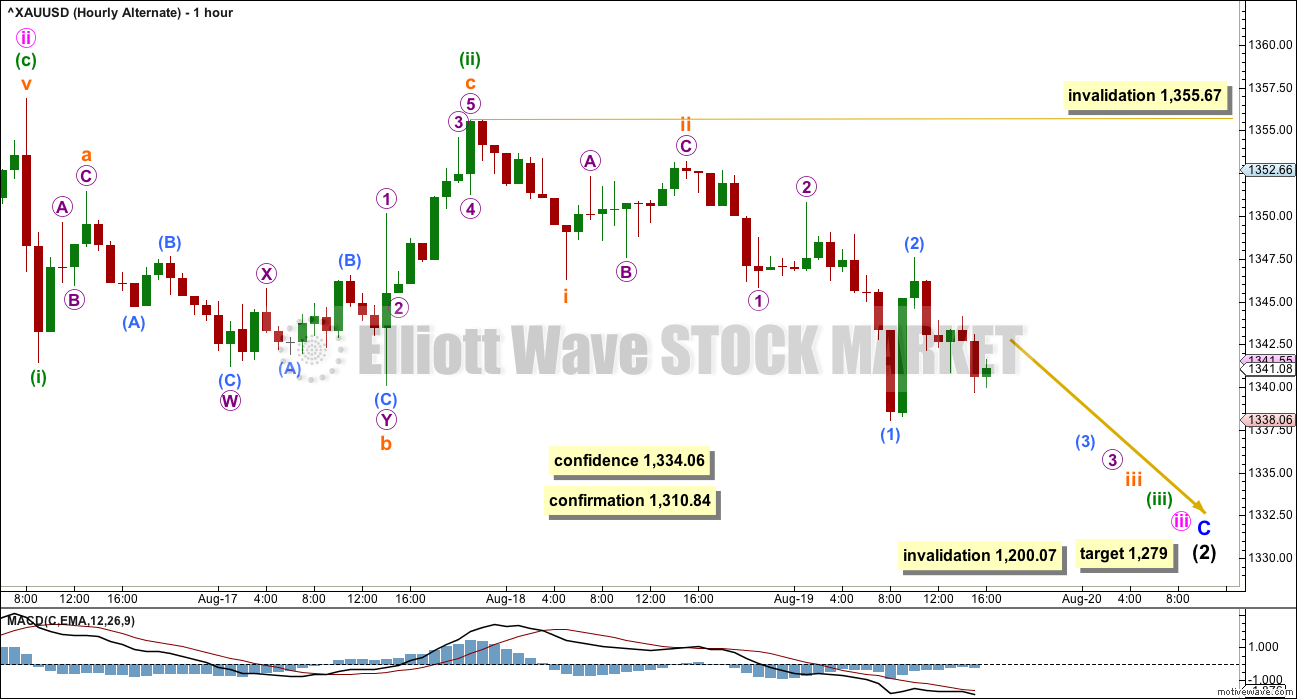
There is only one hourly wave count today for the main wave count. Subminuette wave ii moved lower to complete as a double zigzag, ending just below the 0.786 ratio (not a Fibonacci ratio) of subminuette wave i.
At 1,403 minuette wave (iii) would reach 2.618 the length of minuette wave (i). If price keeps rising through this first target, or if when it gets there the structure is incomplete, the second target would be used. At 1,446 minuette wave (iii) would reach 4.236 the length of minuette wave (i).
The target for minor wave 3 remains the same. At 1,513 minor wave 3 would reach 1.618 the length of minor wave 1.
Overall, subminuette wave ii so far has a strong three wave look to it. The upwards wave labelled subminuette wave i (most of it now off to the left of the chart) has a good look as a five, so it looks like an impulse. Overall, the structure so far looks like fives up and threes down, which fits this main wave count. It indicates the trend should still be up.
A new high above 1,355.67 now would provide some confidence that this wave count is correct. At that stage, it would increase further in probability.
The invalidation point must remain at 1,334.06 because it is possible that subminuette wave ii may continue a little lower. Subminuette wave ii may not move beyond the start of subminuette wave i below 1,334.06. This point is still the risk today to long positions.
Volume for Friday supports upwards movement. The strongest volume was within the two upwards hours of micro wave 1. Volume overall has declined to the low as price fell to complete micro wave 2.
THIRD WAVE EXAMPLE – DAILY CHART
Click chart to enlarge.
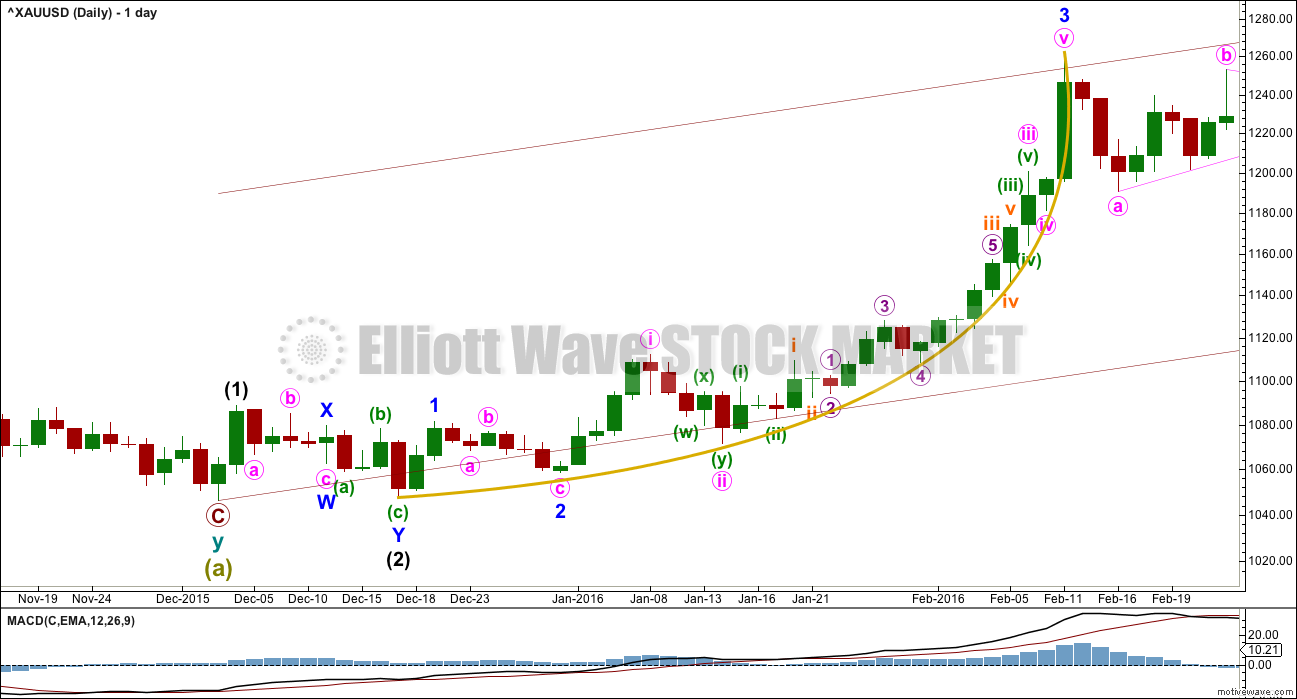
In discussing the curved look to Gold’s impulses, particularly for its third waves, here is an example.
Within primary wave 1, the third wave of minor wave 3 had a strong curved look to it. The impulse begins more slowly and has deep and relatively time consuming second wave corrections: Minor wave 2 was 0.68 of minor wave 1, minute wave ii was 0.76 of minute wave i, minuette wave (ii) was 0.56 of minuette wave (i), and subminuette wave ii was 0.64 of subminuette wave i.
The curved look comes from the disproportion between second and fourth wave corrections within the impulse. Here, minute wave ii lasted 4 days and shows clearly on the daily chart yet minute wave iv was over within one day and does not show up with any red candlesticks or doji on the daily chart.
Momentum builds towards the middle of the impulse, continuing to build further during the fifth wave and ending in a blowoff top. This is typical of Gold and all commodities.
This tendency to blowoff tops and curved impulses is particularly prevalent for Gold’s third waves.
Notice also how this third wave began with a series of overlapping first and second waves. When third waves extend, which is very common, this is very often how they begin. When that happens, they convince us the market will not move strongly and the wave count must be wrong, and they do that right before the trend moves clearly with increasing momentum and volume.
ALTERNATE DAILY ELLIOTT WAVE COUNT
Click chart to enlarge.
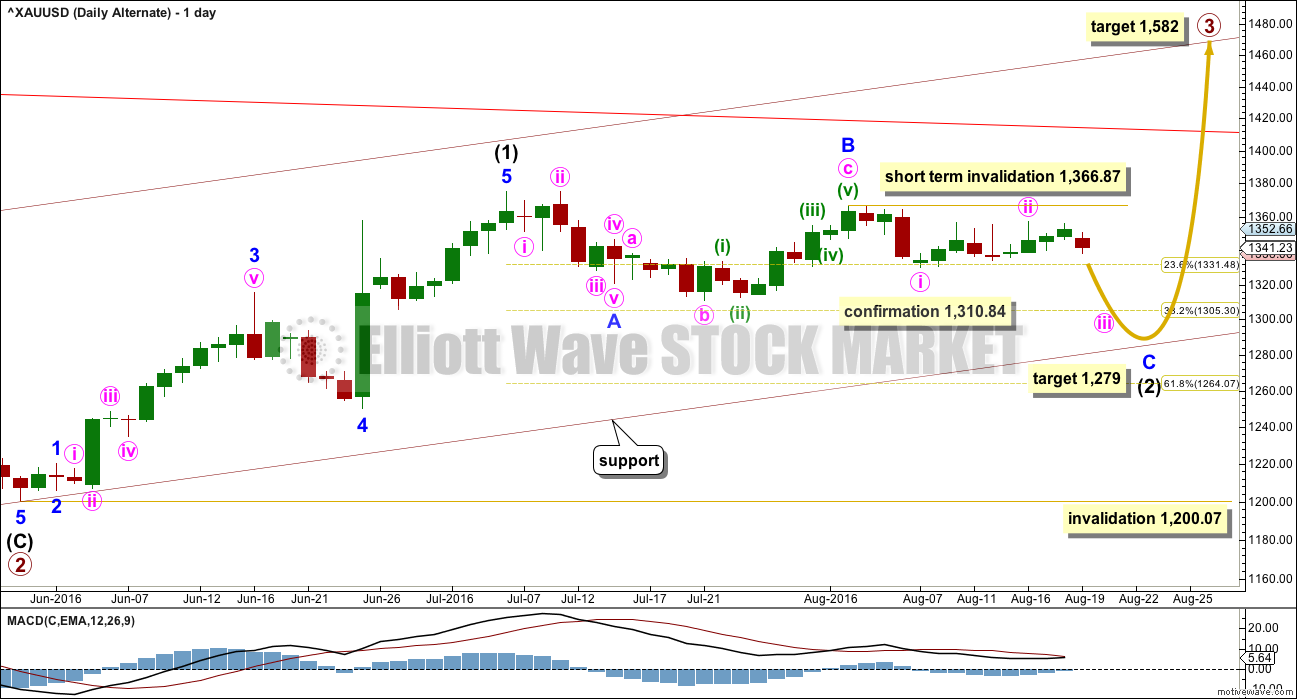
This wave count is identical to the main wave count up to the end of primary wave 2. Thereafter, what if only intermediate wave (1) ended at the last high?
This movement will fit as a five wave impulse, although it does not have a very good look on the daily chart. This reduces the probability of this wave count.
If intermediate wave (1) was over at the last high, then it may have lasted 27 days. So far intermediate wave (2) may have taken 32 days and would still be incomplete. The proportions of this part of the wave count look slightly better than the main wave count.
There is a problem now with structure on the hourly chart within minor wave C. Minute wave i would have to be complete. It will fit on the hourly chart, but it does not have a good look as a five and looks better as a three on the hourly and daily chart levels. This slightly reduces the probability of this wave count.
Within minor wave C, minute wave ii may not move beyond the start of minute wave i above 1,366.87.
Minor wave C must be a five wave structure. So far within it minute waves i and ii would be complete. Minute wave iii downwards should be underway.
At 1,279 minor wave C would reach 1.618 the length of minor wave A. Price may end downwards movement when it finds support at the lower edge of the maroon base channel drawn about primary waves 1 and 2.
Intermediate wave (2) may not move beyond the start of intermediate wave (1) below 1,200.07.
ALTERNATE HOURLY ELLIOTT WAVE COUNT
Click chart to enlarge.
In order to make a reasonable judgement of each Elliott wave count, it is at this stage important to see how each wave count sees recent structure at the hourly chart level.
Within minor wave C, there may now be a series of five overlapping first and second waves. Both wave counts see overlapping first and second waves, but in opposite directions. Both wave counts and classic technical analysis expect this market to begin to move strongly very soon.
At this stage, this alternate wave count has a slightly better fit (than the main wave count) with the small piece of movement labelled micro wave W on this hourly chart. This alternate wave count sees micro wave W as a three wave structure whereas the main wave count has to see this now as a five. It fits better and looks more likely as a three.
Within minuette wave (iii), no second wave correction may move beyond the start of its first wave below 1,355.67.
Minor wave C must subdivide as a five wave structure. If price makes a new low below 1,334.06, then the probability of this alternate would increase. It would be confirmed with a new low below 1,310.84.
If price moves below 1,310.84, then expect more downwards movement for a deeper pullback to end about 1,279. Look also for price to find support at the maroon channel on the daily chart. The target at 1,279 may be a little too low; the maroon trend line may stop price before it reaches the target.
TECHNICAL ANALYSIS
WEEKLY CHART
Click chart to enlarge.
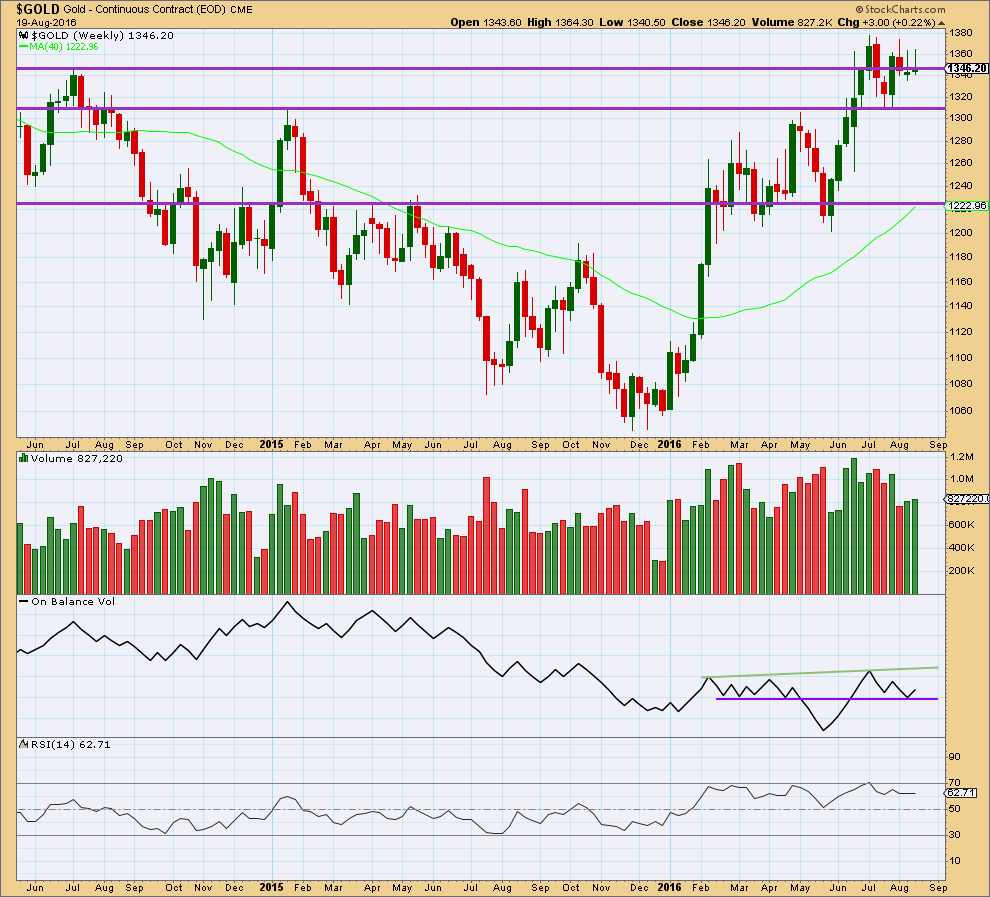
Two green weekly candlesticks in a row come now with a small rise in volume. Volume for both weeks is stronger than the prior downwards week. Short term, at the weekly chart level, the volume profile looks bullish.
This week completes a weekly candlestick with a higher high and a higher low than last week. Overall, price has moved upwards this week.
It is concerning for the main wave count that both of these last two weeks have long upper wicks on the candlesticks. These wicks are bearish and indicate caution. For this reason please manage risk carefully. The alternate wave count is possible and illustrates the risk currently to long positions.
On Balance Volume this week has moved up from the lower purple trend line. This is a reasonable bullish signal this week.
RSI is still not extreme. There is room for price to rise.
DAILY CHART
Click chart to enlarge.
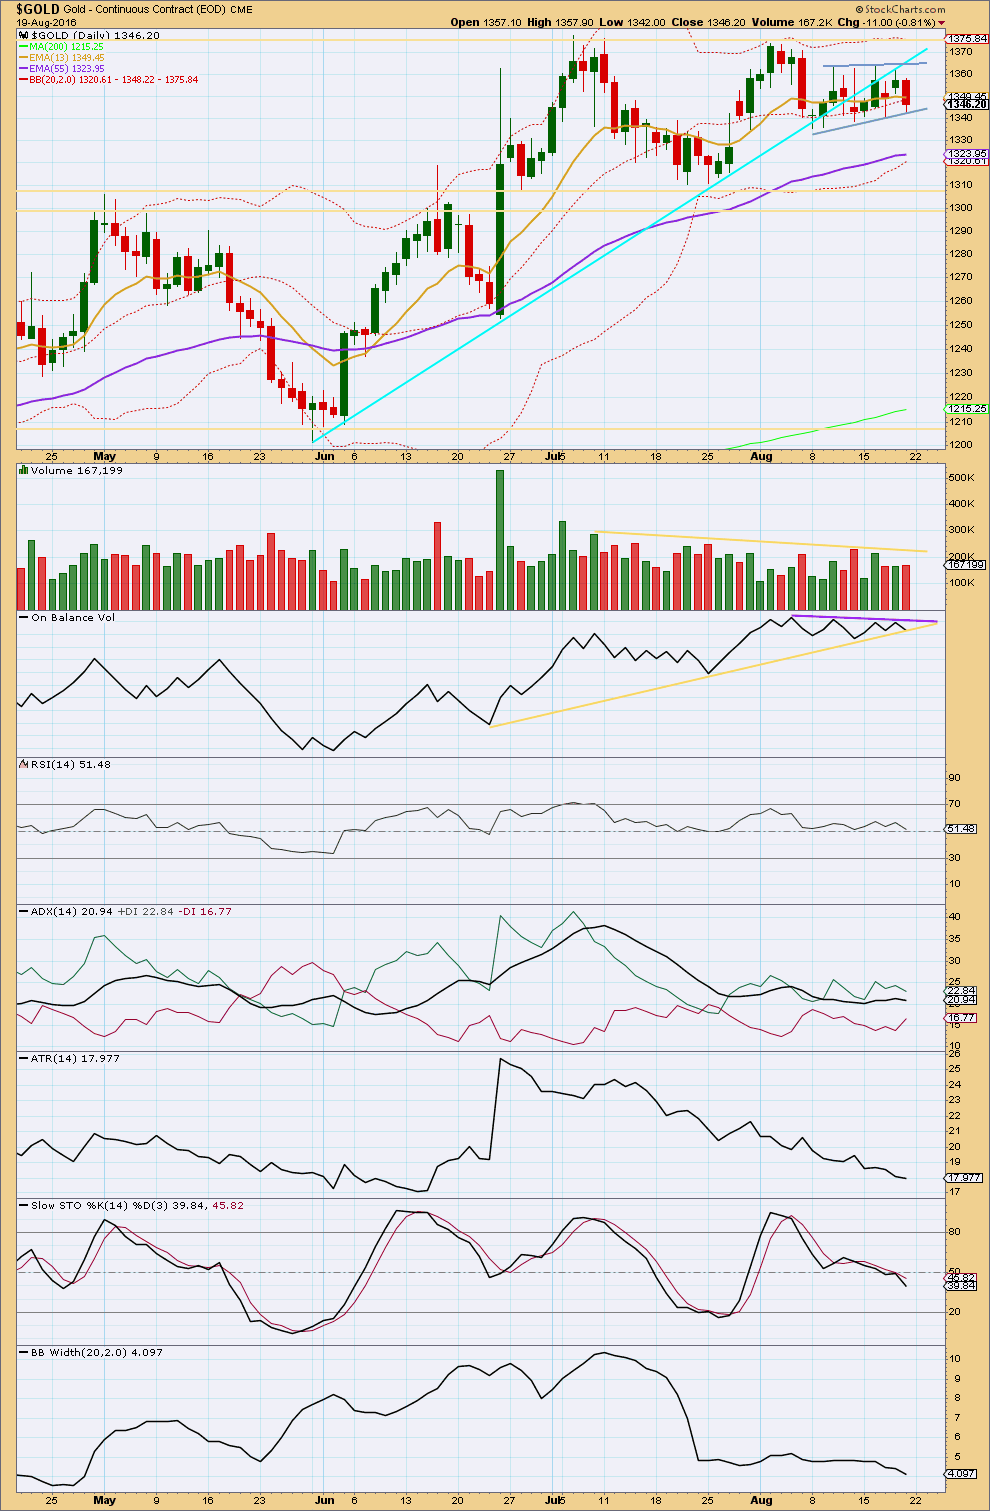
Overall, price is still range bound with resistance about 1,375 and support about 1,310 – 1,305. Volume overall is declining as price moves sideways. ATR is declining and Bollinger Bands are tightly contracted. These indicators along with price point to a range bound consolidating market. Patience is required when price behaves like this.
ADX is slightly declining, indicating the market is consolidating. Importantly, ADX still indicates no trend change from up to down. If a trend returns at this time, it would be up.
The cyan trend line has been breached. Price moved up for a throwback and now has moved down and away. This may be an indicator of more downwards movement ahead. Trend lines do not always work as expected. If they did, then trading would be easy and we would all be billionaires. Nothing in technical analysis is certain; all methods are an exercise in probability. This break, retest and move away from the cyan trend line offers some support for the alternate Elliott wave count.
During this consolidation, it is still an upwards day of 8th of July that has strongest volume. The second strongest day is the downwards day of 25th of July, and the third strongest day is an upwards day of 21st of July. Overall, an upwards breakout may be more likely than downwards. This trick usually works well for Gold, but not always. Again, on balance of probability, upwards is more likely but downwards is still possible.
Friday’s downwards session comes with a slight increase in volume, which does not support the main Elliott wave count but does offer small support to the alternate. Small only because the increase is quite slight.
There is now a smaller consolidation, delineated by blue / grey lines, within the larger consolidation. Price is drifting sideways with a slight upwards bias. A break above resistance or below support would indicate the direction for the short term, until price then reaches 1,375 or 1,310 – 1,305. Friday’s session found good support at the lower edge of this small pattern.
On Balance Volume is nearing the end of its contraction between two trend lines. It must break out in the next one or two sessions, and the direction of the breakout will be a strong signal. This indicator works well with trend lines. Again, it most often works but that is not the same as always. This is an exercise in probability and not certainty.
RSI is neutral. There is plenty of room for price to rise or fall. There is small short term divergence between the lows of 17th of August and 19th of August: price has made a higher low and RSI has made a slightly lower low. This is hidden bullish divergence and indicates weakness to the downwards movement from price. This offers a small support to the main Elliott wave count.
On Balance, it is my judgement at the end of this week that overall this classic analysis is slightly more bullish than bearish. But there is enough bearishness to warrant caution. The main Elliott wave count is still more likely but the alternate is entirely possible. Manage risk carefully. Stops should be set just below 1,334.06 still.
On Balance Volume may lead the way on Monday or Tuesday next week. It should be watched very closely.
This analysis is published @ 07:07 p.m. EST on 20th August, 2016.
SLV smashed through its lower BB today. A close back within it tomorrow or overnight implies move down corrective.
Yup, the classic H&S on SLV with a potential target at 17.6. 17.4 could be a solid support. We will see….
I cannot believe we are getting another opportunity to buy cheap silver. I guess we should thank Stan Fischer. I am trying to decide if I should get another monster box or pick up some miners on the cheap… 🙂
Good luck with that! 😉
The monster box, or the miners? 🙂
Or both? I don’t think we have a supply squeeze yet in the former, and certainly not in the latter; AG was down 7% last Thursday!
Yup, but picking up a bottom is really hard. I wouldn’t get too exciting about it. Good luck!
I have been buying silver since it was 10 per oz and have a long term view on owning the metal. I am not too worried about trying to pick a bottom. 🙂
Comment fr. The Daily Gold: 3:29pm EST, today: see portion of his publication Attached.
Jordan, CMT also sees a gap on Gold continuous chart @ 1310. He did Not specify the time frame.
Melanie
P.S. the miner he is refering to is Orezone Gold.
Melanie, thx for sharing it. It’s very interesting. 🙂
Thx, I saw the gap near there in the hourly chart of gold futures.
Weiquan,
I have been looking for this gap.
1. Are you using a particular software platform or site to view it?
2. Are you seeing it on a Gold ‘spot’ (cash) chart or on a gold Comex futures
chart, if so which month.
3. What is the date of the gap on an hrly. chart?
Thank you.
P.S. Avi Gilburt (elliotteavetrader.net) wrote an article about Gold and Interest rates this week @ seekingalpha.com and suggests similar levels for GDX.
Melanie:
1. I’ve been using the software Thinkorswimg. Here is the link–> https://www.tdameritrade.com/tools-and-platforms/thinkorswim/features.page. I have an account with TD Ameri, so I could use it. Love it.
2. I am using the gold futures chart from Thinkorswimg. The data is slightly different, but it’s close enough. Ticker: /yg
3. The gap is seen on 7/26, but I don’t think it’s valid when I looked at it again. The gap was caused by futures contract rotation (from /YGQ6 to /YGZ6). I don’t think that’s a valid technical gap. Apart from this one, I can’t find any gaps near this $1310 level.
Thanks for sharing Avi’s article. Happy trading!
I’m glad I am not the only one who had trouble finding this gap (even on Think or Swim charts!). At least we can see that it Is an important level.
Of course we also have GOLD @ a major crossroads of trend lines and a 38% retrace. No wonder it needs to pull back a bit. Take a look at this brief article and chart via link:
https://www.thefelderreport.com/2016/08/17/gold-is-standing-at-the-crossroads/
Thanks…
The alternate will remain the same with the same target. It would be confirmed with a new low below 1,310.84, exactly the same as stated in the analysis above.
While price remains above 1,310.84 the alternate will remain an alternate.
But either way, the structure of this five down is incomplete. At least one more low is needed before it is done.
New main wave count. I think you may like this one Alan.
Minute ii continuing lower as a combination: zigzag – X – flat (regular) or double zigzag.
At 1,315 subminuette c = 2.618 X subminuette a.
Daily chart
Hourly chart
The rather “stubborn” upmove in price casts some doubts over the more bearish alternative. In terms of fundamental analysis, I agree with Verne.
I am considering that for the main count, minuette 2 is not over yet. I placed the 1358.19 price point (Aug 16, 8 am) as minuette 1. So far, for minuette 2 two waves are complete and the final third wave down is underway. Subminuette a ended at 1341.18 (Aug 16, 9 am) and subminuette b at 1356.19 (Aug 17, 10 pm). For the third wave down (subminuette c), the low of 1331.79 was the third subwave (micro 3); the fourth subwave should be over at 1340.16 (and that is the “stubborn” upmove I was referring to). One last subwave down targeting 1330.13 – 1330.68 would complete minuette 2. By the way, I am using pmbull data and the invalidation point is not 1330.31 but 1329.95.
If the alternate is correct, then we are now beginning micro 5 of subminuette 3 of minuette 3 of minute 3. My target for Intermediate 2 is 1310.65 with a secondary target of 1297.75.
Alan, thanks for clarifying both the main and alternate counts both heading down.
I’m not holding anything, just have a safe seat on the fence near the fridge.
Gold hit the morning gold high at 1,340.16 at 12:17 pm only $1 under the 4:00 pm close but NUGT was still down $8 from the close even though Gold had went up $9 from the low at 1,331.79 at 10:46 pm.
Gold and even more so the Miners are much more bearish since the Wednesday night gold high of $1,356 after the FED minutes.
Hopefully NUGT has some bullish trading opportunies this week before FED speech Friday in Jackson Hole.
“Gold futures settled lower on Monday, extending losses to a second straight session with investors cautious ahead of Federal Reserve Chairwoman Janet Yellen’s speech Friday that may signal an interest rate increase as early as September.”
Once again, the bankster new stratagem of trying to talk Gold down via empty threats of an impending rate hike is being scoffed at by a cohort of strong hands. They are not quite done yet though. Look for at least one more desperate dump of futures contracts in an attempt to drive prices lower. I will be adding to long positions on the next spike down.
Gold back up to about 1,339.50 only $1.50 below Friday’s 4:00 pm close of 1,341 yet investors are avoiding miners as NUGT is down 5% from Friday’s close.
Any wave count?
Did gold just complete a 5 wave count up from the 10:46 pm low of 1,331.79 up to today’s high at 11:31 am of 1,339.45?
Was the low of 1,331.79 the bottom of sub micro 3 or Micro 3 and the high of 1,339.45 sub micro 4 or Micro 4?
From 1,339.45 perhaps gold may drop down towards 1,331.79?
Any comment?
Silver Is in a Different World, Report 21 August, 2016
https://monetary-metals.com/silver-is-in-a-different-world-report-21-august-2016/
Silver’s break below 19.21 is imo extremely bearish…
Reminder….splits this week for NUGT & JNUG and reverse splits for DUST & JDST
http://www.direxioninvestments.com/press-release/direxion-announces-reverse-and-forward-share-splits-of-nine-leveraged-etfs
I’m stopped out. Waiting for clarity before I enter again.
Wise move Lara.
When gold just gave a bearish confidence exposing increased risk of dropping further then exit and wait for bullish confidence or confirmation.
My longs closed with a small profit. I’ll take that, and look for a new entry point this week.
Ohh thanx for your concern steve..
I surely read the updates as im here for that.
Its just that the overall scenario is still confusing.Gold near to the daily lower bollinger band arnd 1328$ as well as slow sto are also entering into the oversold territory.
Its seems hard for gold to fall of another 40$ from here its possible though,anything is possible.Yaa it may surely come to retest the 1310 odd levels.
Guide line required is should we wait for other markets to get open and take a decision or should we exit..??
Lara said this about stops, “Stops should be set just below 1,334.06 still.”
So if you are a short term trader, you might want to sell. If you are a longer term trader, the trend is up, so you can just ride out the correction. Good luck.
Agree, trade according to trader’s time frames. That’s important…
It is fascinating to watch the techniques being employed in the ongoing game of precious metals price suppression. The last few weeks they have been selling massive futures contracts into the market but the spikes down were all quickly bought so that went nowhere. Now they have changed strategy to intimidating talk about rate hikes and that seems to have done the trick…for now. I suspect the folk bailing are the weak hands holding long positions. I think the move down is a good opportunity for short term traders to make a quick strike on the short side, but I suspect that opportunity will be short-lived. I continue to accumulate the silver miners on every retreat. Both DST and JDST will be excellent post-split short candidates imo…
I agree. Silver (/si) should be bottoming out soon. Getting near 18.5 would interesting…
The trend is still up. My guess is gold will shake out the weak hands this week and find support near $1300ish before resuming higher. $1279 is unlikely to be reached IMO. Watch the maroon base channel for support. If it breaks, gold may be undergoing a trend change.
If you’re asking for guidelines now, You’re probably in the wrong business.
I agree. Silver’s break of 19.21 needs to be confirmed with a Gold break of 1310.00 and preferably 1300.00 before any celebration by the bears would be warranted imo…
This forum is to learn n gain more and more.
Anyways i love being a student always.
Dont make any statement brother…chill 🙂
I have set my stops just below 1330.
Happy trading
Due to the fact that Lara uses a different data feed for gold than http://www.pmbull.com, which sometimes can be even $3 different I’d prefer a bigger difference than $2.27 to confirm the main hourly invalidated. The pm bull.com low at 10:46 pm of 1331.79 that is only $2.27 below 1,334.06 Lara’s invalidation with a different gold feed.
Then go to Barchart.com and look at cash gold for the exact same data that Lara uses. 1,332.22 is the low so far and confirms main hourly invalidation.
Dreamer thank you for the clarification of the bullish hourly invalidation and confidence in the bearish hourly on Lara’s gold feed below 1,334.06.
“If price makes a new low below 1,334.06, then the probability of this alternate would increase.”
Lara mentioned in the video that once below $1,334.06 is confirmed then expect a few down days. Below $1,334.06 is the bearish hourly price confidence point and below 1,310.84 is the bearish daily and hourly price confirmation point.
Correction, Lara mentioned if the alternate is confirmed than a few down days. Confirmation is only below 1,310.84.
The main hourly is now invalidated and the alternate hourly has gained confidence based on Lara’s price points.
GDX gave us a warning sign on Friday with a channel breach. So far today, gold appears to be breaking below it’s daily pennant formed since July.
It appears that gold weakness may continue this week as we await another Janet Yellen speech from Jackson Hole, WY on Friday. My bet is now on the alternate count.
Yes that appears to be the case. Silver also opened the session below 18.80, and doesn’t look like it’s finished correcting. Unfortunately I think the Yellen speech at Jackson Hole is not going to be the turn around as she will be talking from both sides of her mouth as usual. That might not come until the FED September meeting.
To me the warning sign came when the dollar index fell for 5 days straight and gold/silver failed to make a move to the upside. Now that the dollar is correcting they’re both falling fast… the trend is down now.
Yea, we’ll have to see how close gold is to the price targets and bottom line of the channel by Friday. I don’t think gold will breach the channel on this move down. So maybe it moves up before the September meeting and maybe not.
Dreamer, thanks for your chart update. In gold (futures) weekly chart, the I.H.S. neckline is around 1312 according to my trading software (Thinkorswim). It might provides strong support. It’s below 50sma, and it could also shake off weak hands if gold reaches there. I think gold is still in uptrend, but I keep my mind open. 🙂
That sounds like a good first target.
Any guide lines for now
do you even read the update?
I believe that Lara said in the video that invalidation below 1,334.06 is where to set stops and sell bullish positions.
“Subminuette wave ii may not move beyond the start of subminuette wave i below 1,334.06. This point is still the risk today to long positions.”
The fund manager Chris Ciovacco’s market model is very bullish on both SPX & Gold. It’s a nice trend following model by using simple moving averages. Check the post and Youtube video out if you are interesting. Have a good weekend!! 🙂
“Stock Market Signal Has Occurred Only 10 Other Times In Last 35 Years (Video)”
http://seekingalpha.com/article/4000998-stock-market-signal-occurred-10-times-last-35-years-video
I love Chris Ciovacco’s analysis. Solid, simple technical analysis which is objective and unbiased.
Of all the TA videos out there, Ciovacco Capital is one of the very few that I will take the time to watch.
Highly recommended. That’s why it’s in links on my sidebar 🙂
Hi Lara, thanks for your EW analysis update. I didn’t know Chris’ website is already in links on the sidebar. I also checked out other links, and they seem pretty good. 🙂
Thanks for the link – a very thought-provoking presentation. While I cannot argue with his moving averages, based on what I know about the state of the US economy, the bullish case for equities is a tough pill to swallow- certainly for as long as the video suggests. I sometimes find my self wondering if the unprecedented amount of central bank intervention in global markets could possibly result in a change in the way we ought to interpret these kinds of signals. When it comes to the markets, I get the feeling that we are in a brave new world, and one that warrants extreme caution, including not assuming that markets will react in the same way they have in the past. Nonetheless, his contention that we as traders have to rely on facts and not our opinion is right on the money. I have no confidence in any price action I see in this market beyond what I see in its daily movements. I remain extremely gun-shy of directional trades in this market.