
Upwards movement was expected for Monday.
Overall, the session moved upwards to complete a green daily candlestick.
Summary: The trend is up. The target remains at 1,582. Corrections are an opportunity to join the trend. Invest no more than 3-5% of equity on any one trade and always use a stop loss on all trades. Volume and On Balance Volume today are slightly bearish and this indicates caution for the wave count.
New updates to this analysis are in bold.
Grand SuperCycle analysis is here.
Last weekly chart is here.
DAILY ELLIOTT WAVE COUNT
Click chart to enlarge.
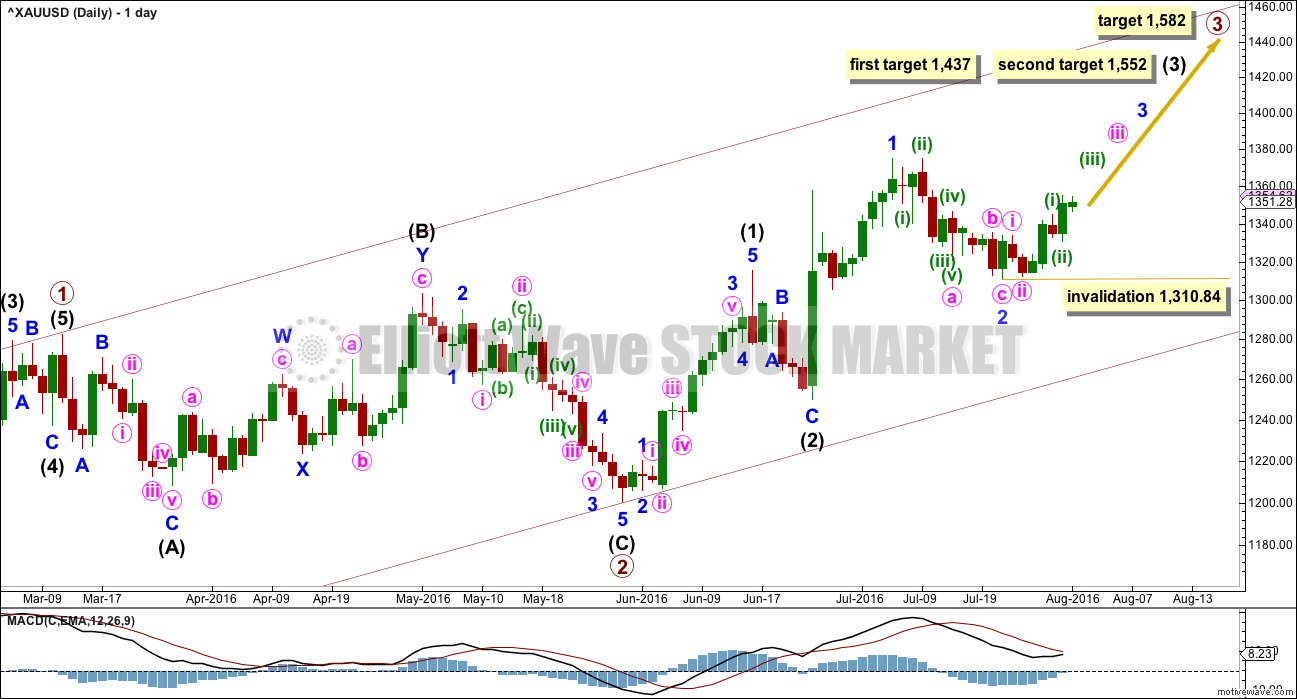
Primary wave 2 is a complete expanded flat correction. Price from the low labelled primary wave 2 has now moved too far upwards to be reasonably considered a continuation of primary wave 2. Primary wave 3 is very likely to have begun and would reach 1.618 the length of primary wave 1 at 1,582.
Primary wave 3 may only subdivide as an impulse.
So far intermediate waves (1) and (2) may be complete within primary wave 3. The middle of primary wave 3 may have begun and may also only subdivide as an impulse.
Within intermediate wave (3), the end of minor wave 1 is moved up to the last high. This fits on the hourly chart although it looks odd here on the daily chart. There was a small fourth wave correction up at the end of minor wave 1 and it subdivides on the hourly chart as an impulse. Minor wave 2 may be a complete zigzag, also subdividing as a zigzag on the hourly chart. If minor wave 2 is over, it would be 0.50 the depth of minute wave i.
No second wave correction may move beyond the start of its first wave below 1,310.84 within minor wave 3.
At 1,437 intermediate wave (3) would reach 1.618 the length of intermediate wave (1). If price keeps going upwards through this first target, or if it gets there and the structure is incomplete, then the next target would be at 1,552 where intermediate wave (3) would reach 2.618 the length of intermediate wave (1).
HOURLY ELLIOTT WAVE COUNT
Click chart to enlarge.
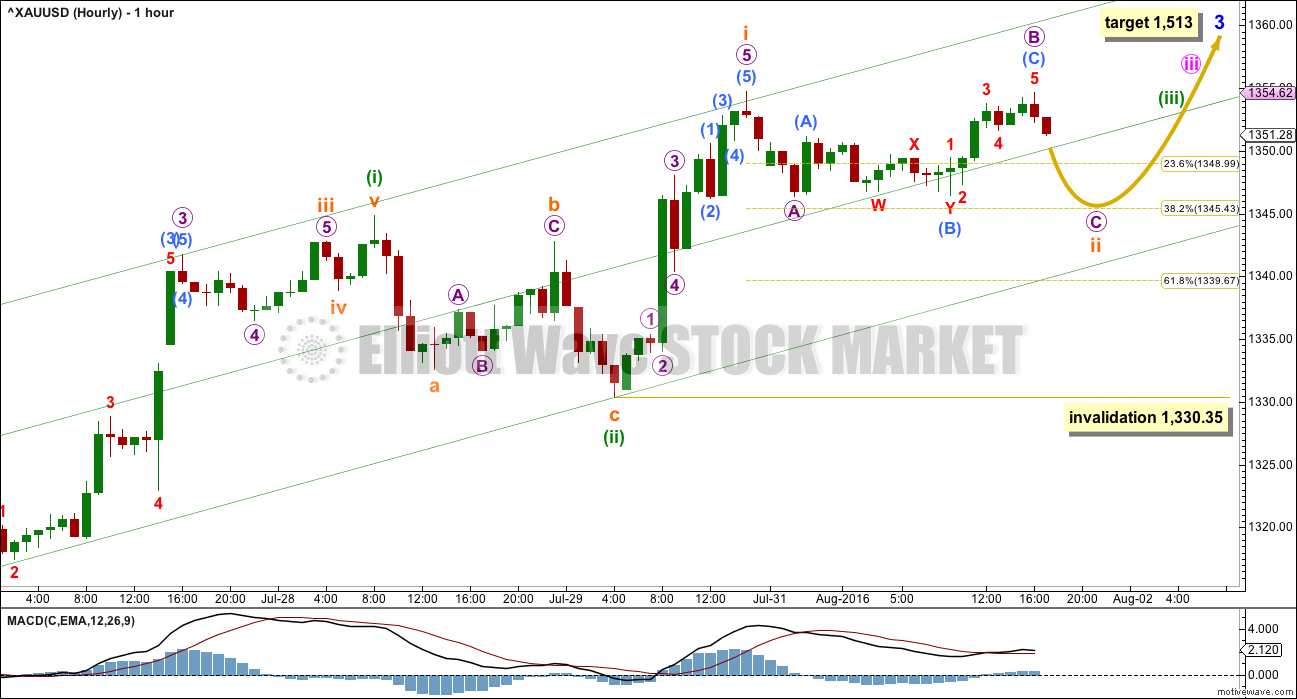
Minute wave iii may only subdivide as an impulse. At 1,372 it would reach 2.618 the length of minute wave i. If this target is wrong, it may be too low. If this target is right, then minute wave v would be a swift strong extension, which is what should be expected.
Minute wave iv may be expected to be very brief and shallow, so that minor wave 3 has a curved look. Gold often exhibits swift strong fifth waves, and this tendency is particularly prevalent for Gold’s third wave impulses. This is what should be expected for the end of minor wave 3 and probably also the end of intermediate wave (3). These impulses look like they are developing a typically curved look for Gold. When the fourth wave corrections higher up arrive, they may be very quick and shallow and not offer good entry points to join the trend except for the most nimble and active traders.
So far, within minute wave iii, minuette waves (i) and (ii) are now complete. This wave count now has Gold within a third wave up at five degrees. The middle of this big third wave should show a strong increase in momentum and it should be supported by volume.
Within minuette wave (iii), subminuette wave i is complete. Subminuette wave ii could possibly be complete at the low for Monday, but the wave count looks better if it sees subminuette wave ii incomplete. It may end about the 0.382 Fibonacci ratio of subminuette wave i at 1,345. Micro wave C is likely to make a slight new low below the end of micro wave A at 1,346.35 to avoid a truncation.
The green channel here is adjusted to be a best fit. Along the way up, price may find support at the lower edge. When the upper edge is breached, then that may provide support. Expect the upper edge to be breached as the middle of a strong third wave approaches.
Within minuette wave (iii), no second wave correction may move beyond the start of its first wave below 1,330.35.
At 1,513 minor wave 3 would reach 1.618 the length of minor wave 1. This target fits only with the second higher target for intermediate wave (3) on the daily chart.
Minor wave 3 should have support from rising volume and it should exhibit stronger momentum than minor wave 1.
Intermediate wave (1) lasted a Fibonacci thirteen days. Minor wave 1 lasted a Fibonacci eight days. Minor wave 3 may be expected to last longer, about a Fibonacci thirteen or maybe twenty one days. So far it has lasted only seven.
The alternate will no longer be published. It did not have an upper invalidation point, so technically it remains valid, but the structure at the hourly chart level no longer makes sense and the proportion at the daily chart level is now too far out for the right look.
TECHNICAL ANALYSIS
WEEKLY CHART
Click chart to enlarge.
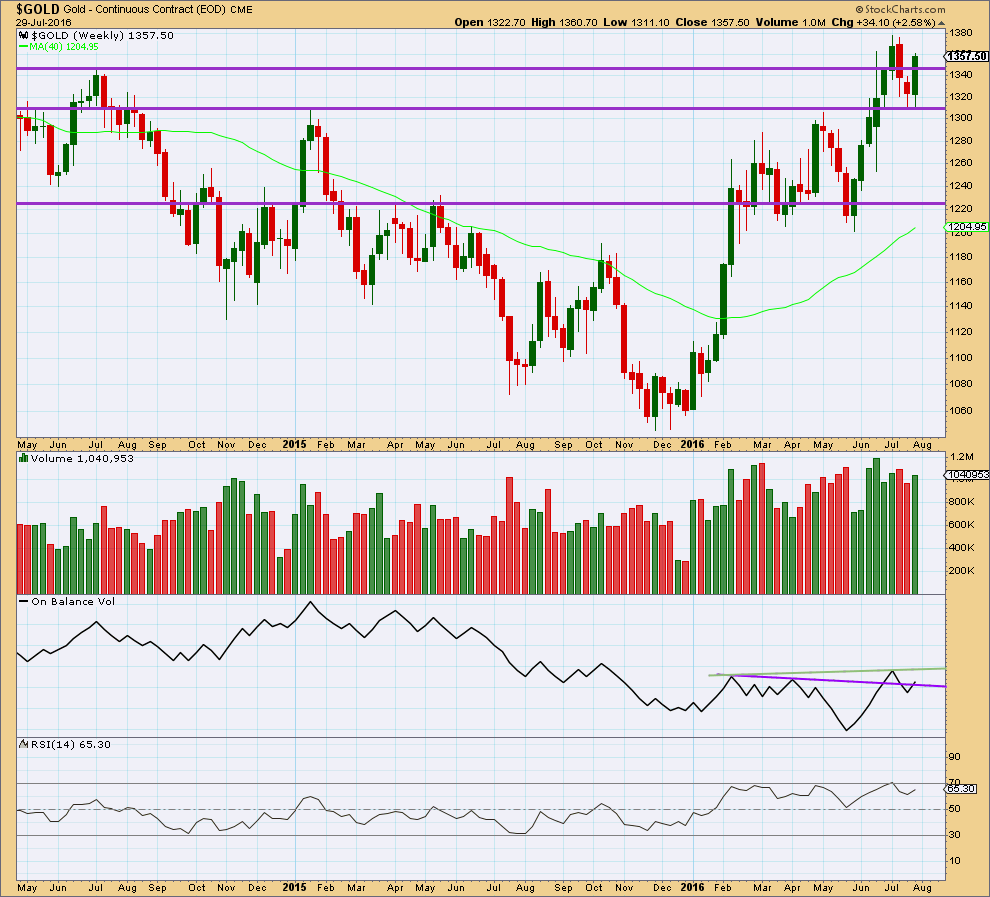
Last week completes a bullish engulfing weekly candlestick that has stronger volume than the week before. After a short downwards movement, this is a reversal pattern from down to up or down to sideways.
Price broke above resistance last week about 1,345 and closed above this line. Next resistance would be about the last high about 1,380.
On Balance Volume is giving a bullish signal at the end of last week with a break above the purple trend line. The next line to offer resistance for OBV is the new green line.
RSI is not extreme yet. There is room for price to rise further.
Overall, the weekly volume profile is bullish. Volume increases as price rises and volume declines as price falls. There is no indication yet of an end to this upwards trend at the weekly chart level.
DAILY CHART
Click chart to enlarge.
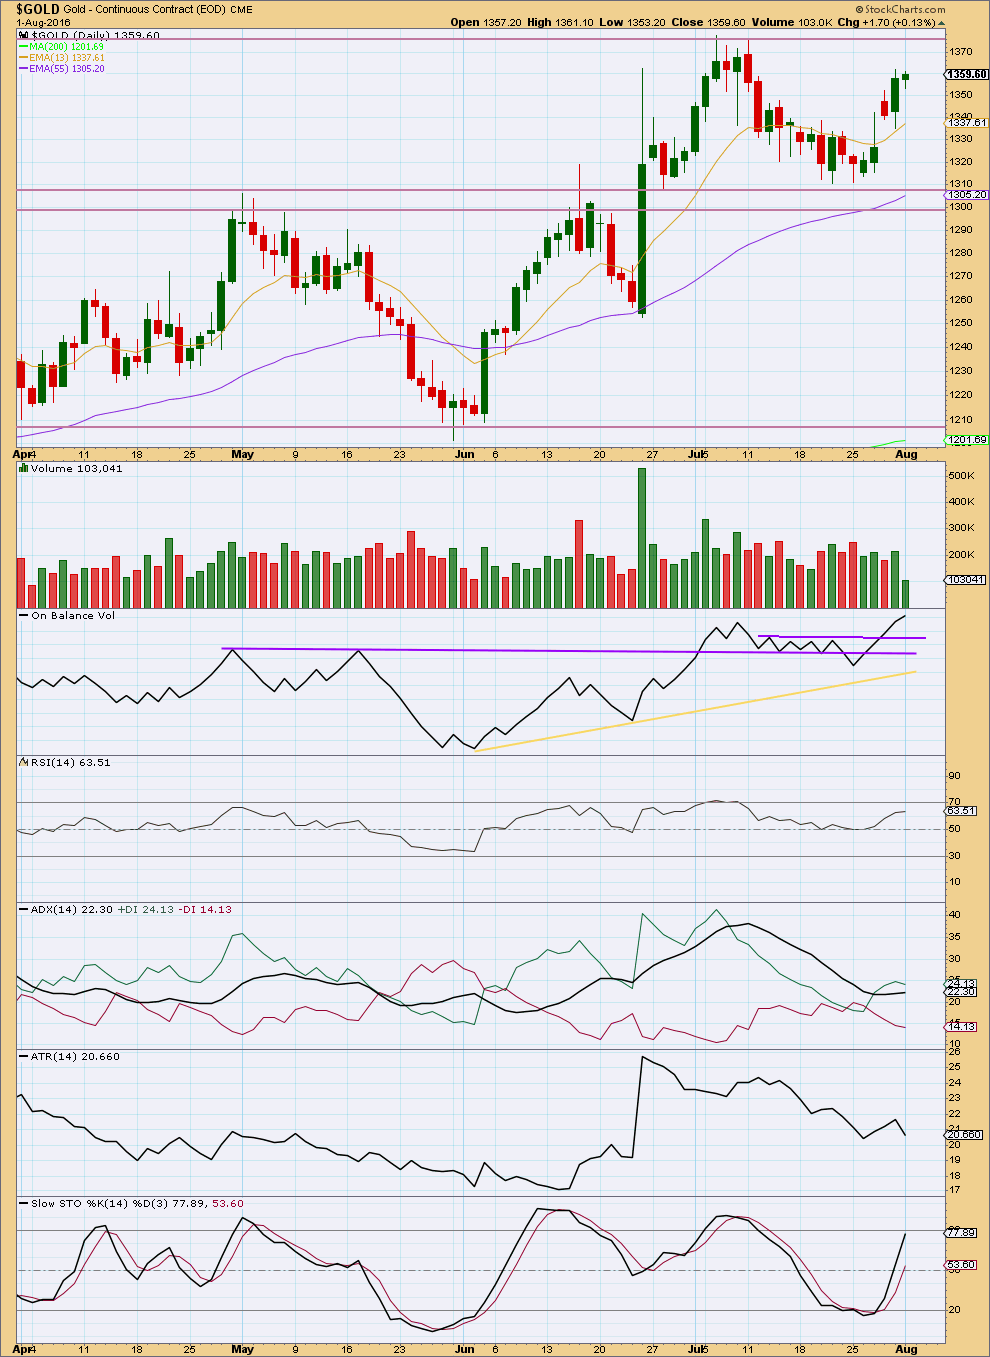
Monday’s small inside day comes with clearly lighter volume than Friday’s stronger upwards day. The rise in price for Monday was not supported by volume, so it is suspicious.
On Balance Volume shows some divergence today with price. OBV has made a new high but price has not and this indicates some weakness in price.
Volume and OBV today indicate the Elliott wave count today should be approached with some caution. It may be wrong and a deeper correction may be about to unfold before the upwards trend resumes.
Sometimes in the early stages of a trend Gold can exhibit some hesitancy.
Apart from Monday’s session though the short term volume profile is still more bullish than bearish.
RSI is not yet overbought. There is still room for price to rise. RSI does not exhibit any divergence with price today to indicate any weakness.
ADX is still slightly increasing today indicating an upwards trend is in place.
ATR today is not increasing. With ATR declining today, it may be about to indicate a consolidation. But if it turns back up tomorrow, it would indicate a new trend is more likely.
Stochastics is not yet overbought. There is still room for price to rise.
The lower wick of Friday’s candlestick found support at the 13 day moving average. This average should continue to show where small corrections find support along the way up.
This analysis is published @ 06:13 p.m. EST.
Good morning, this is a nice healthy looking trade so far. I’ve moved my stop up to just below 1,310.84 locking in over $20 of profit. Now to add to my long position.
The third wave can’t be over yet, and has most likely not passed its middle. Looking at this on the daily chart it hasn’t yet moved above minor 1. Minor 3 must move above minor 1. The middle of minor 3 is unlikely to have passed while it hasn’t done that.
I will label the hourly chart another first and second wave to this reason.
Finding an entry: as this accelerates it’s not so obvious to find an entry. Use support trend lines or Bollinger Bands. Look how price has behaved in the BBs so far in this wave. It touched the lower edge last time at minuette (ii), it may now stay in the upper half for this move up, and when the strongest portion arrives it may stay close to the upper BB for quite some time.
Each time price gets close to the mid line of the BBs it offers an opportunity. Each time price touches a support line it offers an opportunity.
If you’re looking for an entry take some time to play with trend lines, find a good fitting support line and use that.
Or just jump in.
ALWAYS USE A STOP. If I’m wrong, and I am wrong sometimes, then cut losses short. Have an exit strategy for the trade before you enter it.
Invest no more than 3-5% of equity on any one trade.
How soon Minute wave iii can be finished?
Hi Pete, good question. It looks like some of the regulars are away today, but I am sure Lara will shed clarity on the situation in good time. 🙂
Hello Gold,
What is the current Elliott Wave count?
Thank you!
Alan, I hope you decided to ride out that subminuette correction the other day. If not, the saddle’s ready. ; )
Question for you (and everyone else too)- do I understand correctly that a Minute IV can not move into Minute 1 price territory, which would mean a Minute iv correction can not go below approx July 21 12:00 high (1333.74 my data)? Re-setting my stops. Gotta go…..
Thanks dsprospering for your concern.
I had built up the bulk of my position quite early in the uptrend.
I was considering my “scalping” longs. I decided to go more boldly and added to the longs at the first low of 1346.28. So, I’m now riding the wave.
I had always considered that fourth wave should not enter into wave 1 price territory for impulses. But, for diagonals with a lot of overlap, the fourth wave must enter into price 1 price territory.
You are correct for the case of minute 4. Minor 3 has to be an impulse, so minute 4 cannot drop below 1333.74, your data. I use pmbull, and my data point is 1333.98. Not much difference.
Hello Alan Tham,
Please let me know what is the next pull back opportunity to join the trend.
Your detailed trading strategy was very precise.
Thank you very much!
Thanks pete for the compliment.
I see minuette 2 completed at today’s low of 1347.19.
The price rise since then can either be subminuette 3 or only micro 1 of subminuette 3. I think the lower degree is more likely as wave 3’s often extend. In any case, I think that wave was over at the high of 1367.37.
The sleepy slow movement since then will then be micro 2 (or subminuette 4 if subminuette 3 was the price rise).
So far, I am confident that wave a completed at 1364.24 at 12:50 pm. The rise to 1336.67 could be the b wave, or it could be part of the b wave. In terms of target, I am using 1362.61 (0.236 Fib retrace of 1347.19 – 1367.37), worst case 1359.66 (0.382 Fib retrace) if 1362.61 fails to hold the correction.
Hope this helps.
Good insight, thanks Alan!
My pleasure.
Edit (typo): Second line — I see subminuette 2 completed at today’s low of 1347.19.
Perhaps 1336.67 was wave b after all.
It looks as though wave c is dropping as an ending diagonal. If that’s the case, the drop should not go very much below 1364. The fourth wave of the diagonal is now almost completing. I will take the opportunity to add to my position before the market closes. The next wave up should be very strong.
Way to go. 5th wave of diagonal underway!
Ensuing movement has negated the ending diagonal.
After Minuette 3 completes, would it be a good time to enter long?
What is the next pull back?
No, you want to be long during this third wave.
Each time price corrects, even if its small, it’s an opportunity to join the trend. Use a trend line or Bollinger Bands. Each time price touches a support line is an opportunity. Each time price gets to the mid line of the BBs is an opportunity.
A big third wave up may now begin to increase momentum further. Sometimes these don’t offer clear opportunities to join the trend, so you may have to just jump on board.
Always always always use a stop. Never invest more than 3-5% of equity on any one trade.
If you haven’t seen it, check out this chart on gold seasonality over the past 30 years. We are right smack in the hottest spot that runs from the beginning of Aug. to the beginning of Oct:
http://www.gold-eagle.com/article/gold-seasonality-over-30-years
Sub-minuette iii peak at 9:01?
I see it getting to $1369-1370 first before sub-minuette iii peak
Large inverted H&S target supports Lara’s EW target. Chart by RTV.
nice supportive chart. back test happened, thnks
Possible GDX count
Thanks Dreamer…
Anyone following Lara’s silver analysis, it looks very much like this wave count Dreamer has for GDX… in the middle of its minor 5th wave to complete intermediate 3…
GDX uptrend looking healthy
Yeah, I noticed that the rise for GDX was supported by price, so I’m not overly concerned with lacklustre volume in yesterdays Gold rise.
Dreamer, thanks for sharing for your TA info. 🙂
Looks like we are indeed starting subminuette ii on the hourly.
Sorry I meant continuing with subminuette wave ii.