
Again, upwards movement unfolded as expected from the Elliott wave count and classic technical analysis.
Summary: The trend is up. The target remains at 1,582. Corrections are an opportunity to join the trend. Invest no more than 3-5% of equity on any one trade and always use a stop loss on all trades. Caution is advised at this time with long positions. There is some bearishness from volume and On Balance Volume still, and ATR is not yet increasing. There is some weakness to this trend, which may be resolved shortly. But if it is not, then a deeper pullback may occur.
New updates to this analysis are in bold.
Grand SuperCycle analysis is here.
Last weekly chart is here.
DAILY ELLIOTT WAVE COUNT
Click chart to enlarge.
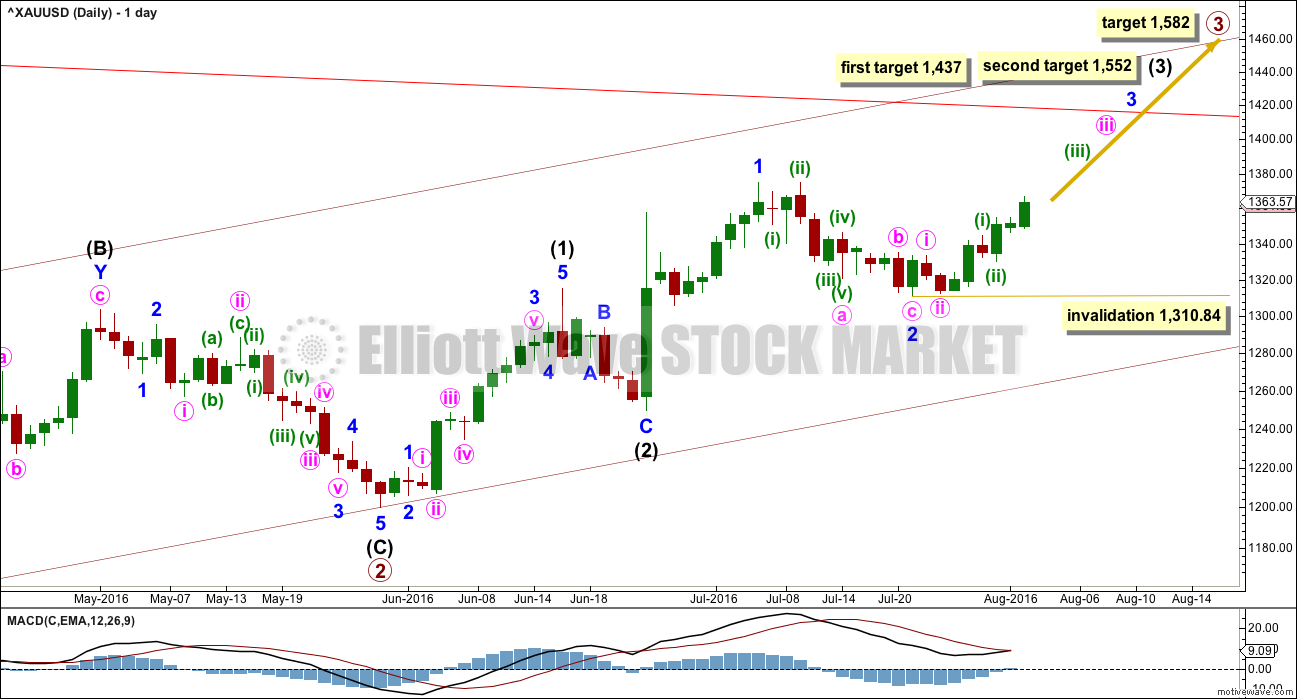
Primary wave 2 is a complete expanded flat correction. Price from the low labelled primary wave 2 has now moved too far upwards to be reasonably considered a continuation of primary wave 2. Primary wave 3 is very likely to have begun and would reach 1.618 the length of primary wave 1 at 1,582.
Primary wave 3 may only subdivide as an impulse.
So far intermediate waves (1) and (2) may be complete within primary wave 3. The middle of primary wave 3 may have begun and may also only subdivide as an impulse.
Within intermediate wave (3), the end of minor wave 1 is moved up to the last high. This fits on the hourly chart although it looks odd here on the daily chart. There was a small fourth wave correction up at the end of minor wave 1 and it subdivides on the hourly chart as an impulse. Minor wave 2 may be a complete zigzag, also subdividing as a zigzag on the hourly chart. If minor wave 2 is over, it would be 0.50 the depth of minute wave i.
No second wave correction may move beyond the start of its first wave below 1,310.84 within minor wave 3.
At 1,437 intermediate wave (3) would reach 1.618 the length of intermediate wave (1). If price keeps going upwards through this first target, or if it gets there and the structure is incomplete, then the next target would be at 1,552 where intermediate wave (3) would reach 2.618 the length of intermediate wave (1).
HOURLY ELLIOTT WAVE COUNT
Click chart to enlarge.
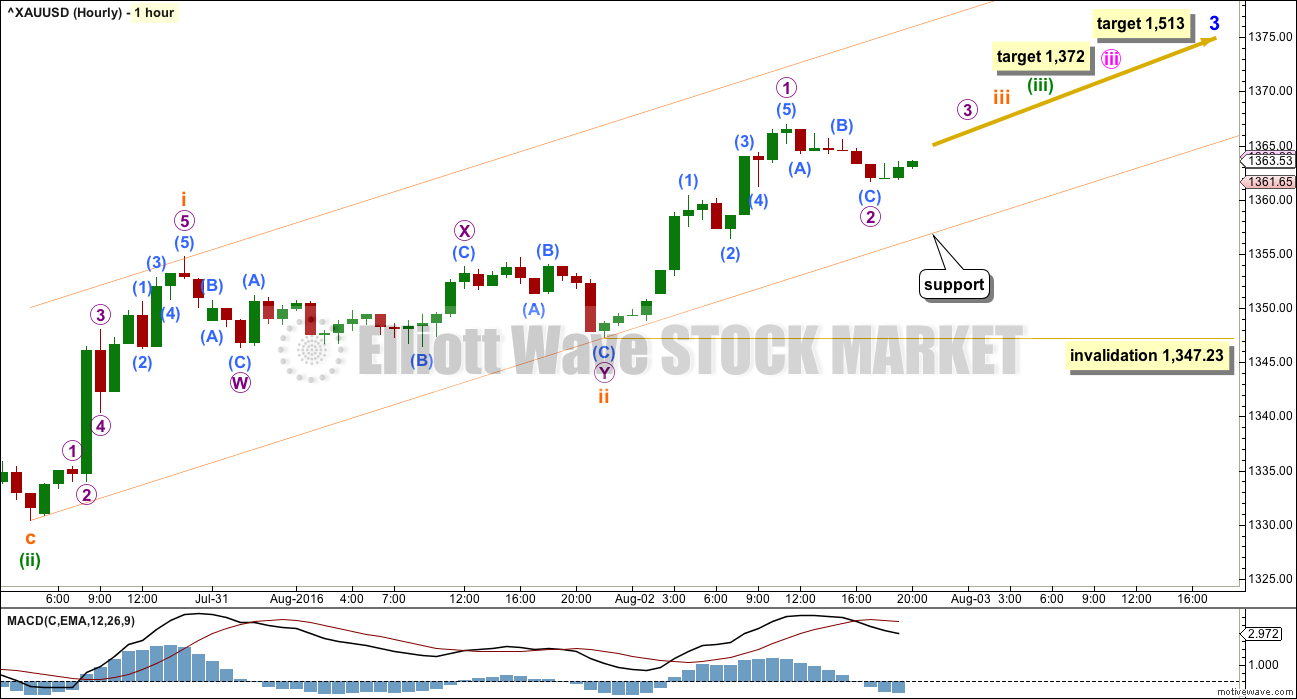
Minute wave iii may only subdivide as an impulse. At 1,372 it would reach 2.618 the length of minute wave i. If this target is wrong, it may be too low. If this target is right, then minute wave v would be a swift strong extension, which is what should be expected.
Minute wave iv may be expected to be very brief and shallow, so that minor wave 3 has a curved look. Gold often exhibits swift strong fifth waves, and this tendency is particularly prevalent for Gold’s third wave impulses. This is what should be expected for the end of minor wave 3 and probably also the end of intermediate wave (3). These impulses look like they are developing a typically curved look for Gold. When the fourth wave corrections higher up arrive, they may be very quick and shallow and not offer good entry points to join the trend except for the most nimble and active traders.
So far, within minute wave iii, minuette waves (i) and (ii) are now complete. This wave count now has Gold within a third wave up at six degrees. The middle of this big third wave should show a strong increase in momentum and it should be supported by volume.
Within minuette wave (iii), subminuette waves i and ii are now complete. Subminuette wave ii fits as a sideways combination: zigzag – X – flat. Subminuette wave iii may now be underway.
A base channel, in orange, is added to subminuette waves i and ii today. Along the way up, corrections should now find support at the lower edge of this channel. The strength of the middle of this third wave should have the power to break above resistance at the upper edge of this channel. When price breaks above the channel, then the upper edge should provide support for corrections.
Within suminuette wave iii, micro wave 2 may not move beyond the start of micro wave 1 below 1,347.23.
At 1,513 minor wave 3 would reach 1.618 the length of minor wave 1. This target fits only with the second higher target for intermediate wave (3) on the daily chart.
Minor wave 3 should have support from rising volume and it should exhibit stronger momentum than minor wave 1.
Intermediate wave (1) lasted a Fibonacci thirteen days. Minor wave 1 lasted a Fibonacci eight days. Minor wave 3 may be expected to last longer, about a Fibonacci thirteen or maybe twenty one days. So far it has lasted only eight.
TECHNICAL ANALYSIS
WEEKLY CHART
Click chart to enlarge.
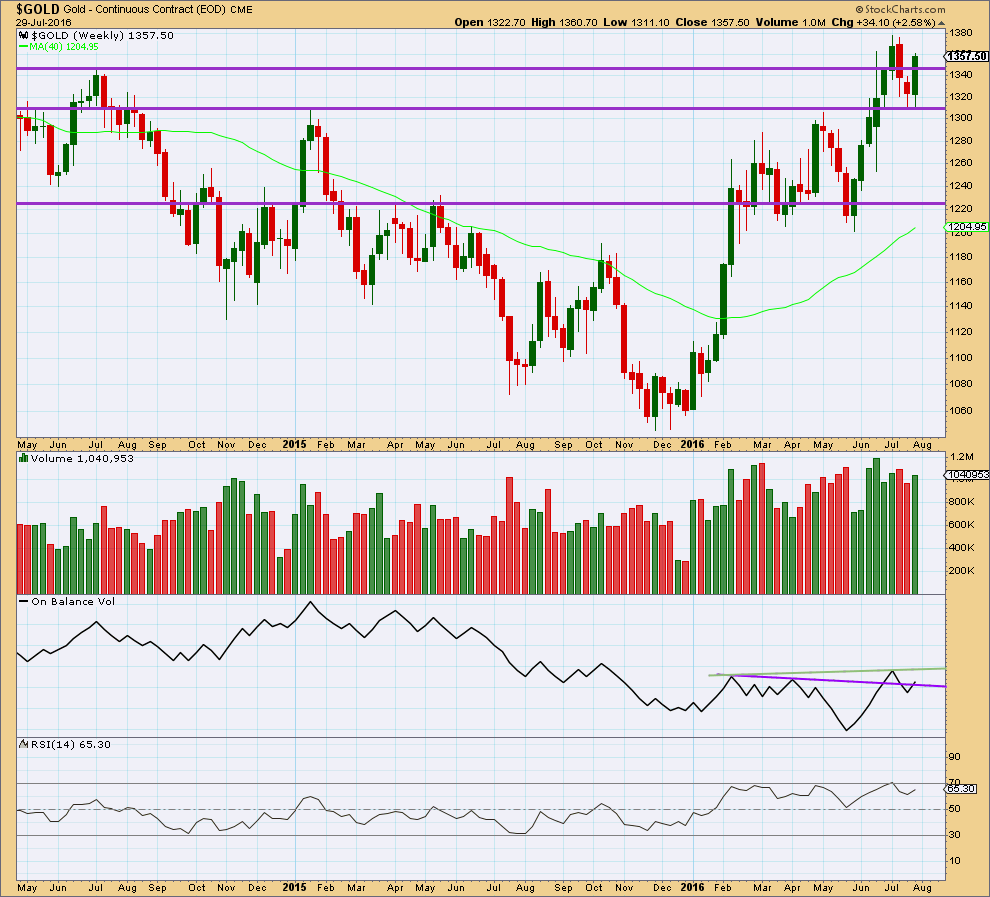
Last week completes a bullish engulfing weekly candlestick that has stronger volume than the week before. After a short downwards movement, this is a reversal pattern from down to up or down to sideways.
Price broke above resistance last week about 1,345 and closed above this line. Next resistance would be about the last high about 1,380.
On Balance Volume is giving a bullish signal at the end of last week with a break above the purple trend line. The next line to offer resistance for OBV is the new green line.
RSI is not extreme yet. There is room for price to rise further.
Overall, the weekly volume profile is bullish. Volume increases as price rises and volume declines as price falls. There is no indication yet of an end to this upwards trend at the weekly chart level.
DAILY CHART
Click chart to enlarge.
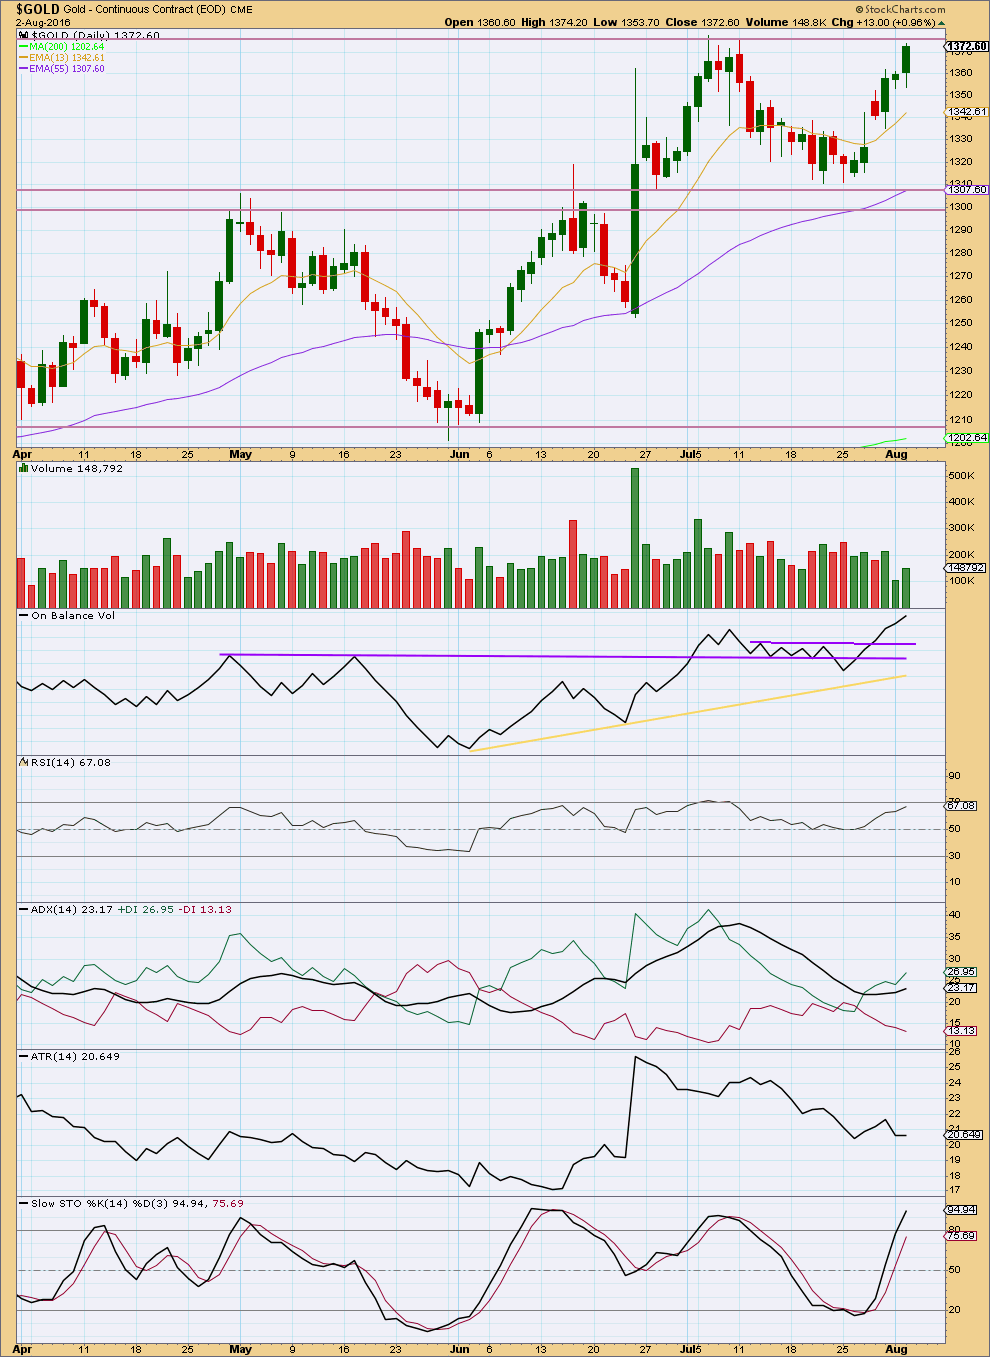
Some increase in volume today is seen over the prior upwards day. In the short term, there is support from volume for the rise in price today. However, volume is declining as price moves higher from the low seven days ago and this is of some concern for the wave count. With volume declining and price at resistance about the horizontal line at 1,375, caution is advised. It is essential that stops are used for long positions here, so that accounts are protected in the event of a deeper pullback developing.
On Balance Volume still exhibits hidden bearish divergence with price: OBV has made a new high above the prior high of 6th of July but price has not. This indicates some weakness in price. Sometimes this divergence disappears; it is not always a reliable indicator of an upcoming trend change. OBV works more reliably with trend lines. The break above both purple trend lines is a bullish signal from OBV.
RSI is still not overbought. There is room for price to continue to rise.
ADX is increasing indicating an upwards trend is in place. ATR overall disagrees still. There is something wrong now with this trend at this stage. Caution is advised with long positions here.
Stochastics is now entering overbought. Stochastics may remain extreme for reasonable periods of time during a trending market though.
Support may be expected at the 13 day moving average while an upwards trend is in place.
Looking back at the rise in price from Gold from the low at 3rd of December, 2015, it can be seen that early on in a new upwards wave volume and ATR are not always very clear. The most stark example is the three days from 29th of January, 2016, to 2nd of February, 2016: price printed green daily candlesticks for three days with a new high each day yet volume was light and declining. But this was followed by overall seven more days of very strong upwards movement to substantial new highs before any reasonable pullback was seen. Also, up to 3rd of February ATR had been declining.
Some weakness at the early stage of a new wave for Gold is acceptable.
This analysis is published @ 09:15 p.m. EST.
Very nice pop today in one of my long time favourites, GORO, which jumped 9% after earnings report. They will actually pay your dividends in the metal!
Thanks for the Warning…Lara. It was meandering a bit much for my taste. I got out with a nice profit, ready for the next day.
This is possible. With todays downwards movement showing a small red candlestick I would prefer this wave count over what I have in the analysis above.
For those holding long positions opened at the start of minuette (i) either take profits now or hold on if that’s your trading style, to hold for longer time periods.
For those looking for an entry to go long then we may have a very good one coming up at the end of minuette (ii) in one to two more days time.
If this wave count is correct.
The 0.382 Fibonacci ratio would be slightly more likely in this instance due to a strong pull up from a big third wave. But the 0.618 is still entirely possible.
Also, if this is wrong then my labelling of minuette (ii) as incomplete may be wrong. It could be over already. What makes me think it’s not is slow hesitant upwards movement. That looks corrective, so downwards movement is not done yet.
This downwards movement today is too deep to be micro 2, that shouldn’t be showing on the daily chart
I think this may actually be minuette (ii) so I’m going to look at how that would fit….
here’s a wkly…
Avi’s Dly_GDX chart
Melanie, thanks for sharing it. It’s nice to know other good analyst’s perspective.
Alan and all,
You may want to take a look at these charts.
Perhaps Alan could comment on 8min chart. Avi shows more possible downside before going back up. I see a C bottom of Micro 2 this moring also. Of course since then, it has been ‘wandering’.
Thanks…Melanie
Dreamer is in a much better position to comment. My best guess is that the drop would correspond to this morning’s drop in gold price. GDX dropped to a low of 30.70 today which looks pretty much in line with Dreamer’s chart. Avi’s chart claims that the drop is larger. The target zone is 29-30.
…currently there is a red candlestick forming on the Dly GDX on low volume. I do look at GDX as following Gold pretty closely. I tend to agree on your consolidation theory this afternoon.
Thank you
Hello Gold,
What is the current Elliott wave count?
Thank you!
Consolidation and building a base before rising in micro 3. As mentioned below, micro 2 ended at 10:37 am at 1354.19, a deep 0.618 retrace.
I really hate B waves. When I was pretty sure it ended as a single zigzag, then it had the last laugh and turned into an ABC double. So it is 1367.37 – 1361.94 – 1366.56 – 1359.83(?)
There is still one small drop; I can count only the fourth wave of five in the C. It is now pretty close to the 0.382 Fib retrace @ 1359.66.
I guess that is why Lara posited yesterday that there is still some remnant bearishness.
What do you think- low of C wave at 10:37 EST?
Sorry for the late reply. My dinner time.
Yes. The drop was quite devastating. It went down right to the 0.618 Fib. The low was indeed 1354.19 at 10:37 am. That is the actual end of micro 2 (and not the 1361.94 that Lara and I expected).
The good thing is that, by the rules of alternation, micro 4 will be in all probability be the opposite: short and quick.
If everything is in order, we will now be undergoing a third wave in 6 degrees.
No worries — thanks for the assessment! Hopefully we shall see an increase in momentum to confirm the wave count.
Hello Alan,
What do you mean by third wave in six degrees.
Thank you so much for your help.
Pete
We are in subminuette 3 of minuette 3 of minute 3 of minor 3 of intermediate 3 of primary 3.
Hi Alan. Ditto to Geoffrey’s question. I’m a bit confused.
Hi dsprospering. Please see my response to Geoffrey.
It is indeed disconcerting that B waves can either be a simple zigzag or morph into 3 waves, which was the case here. I’ve been caught once too often by this. The trouble is that in the first instance, the drop is to the 0.236 or 0.382 Fib, which is a reasonable expectation. The 3-wave affair, which definitely is much more drawn out, drops down to the next Fib ratio, namely 0.382 or 0.618.
Thank you, as always, for your excellent interpretations. My confusion comes in when looking at NUGT/GDX and comparing its charts to the gold projections on XAU. Nugt weekly momentum indicators are understandably at their high since February, taking a big dip in May, but the daily/4-hr appear to be ready to roll over. Price was outside its acceleration bands yesterday and I’ve seen price turn at these areas before– just don’t see XAU indicating any big pullback nearterm, will next look at s&p regarding stock impact. And then there’s always the $USD. Any insight/comment you have is welcome.
I’m overtired now so will have to come back to this when I truly wake up.
Lara im ur elliottwavegold member since more than a year now and i have seen that whenever the expiry of future contracts is in play the volume profile always confuse us.
Like you mentioned above 29th jan to 2nd feb, it was also an expiry week.
Does this volume profile have anything to do with expiry ??..
The data I’m using is supposed to be the cash market data, so that shouldn’t be affected by futures contacts. They’re separate data sets.
And even if it was not, then contacts expire on one day only. That date would have a volume spike.
What we’re seeing here is lighter volume.
Which I don’t think has anything to do with futures contracts expiring.
I think this is just hesitancy at the start of a new wave.
Close up of GDX. The doji today may signal that Minuette 4 is here, but any retrace should be minimal. A breach of the trend line may indicate that Minute 4 has arrived, but I would expect that correction to be minimal also.
Just eyeballing the development of iii(circle), (iii) appears to be the shortest wave thus far (assuming we are in iv). That being the case, (v) will need to remain below approximately 32.5 in order for (iii) not to be the shortest leg. The best case for GDX longs is that (iii) is actually not (iii), but another subdividing i-ii-iii-iv-v that leads to (iii) of iii (circle). Hope that makes sense from a novice.
Yes, your thoughts make sense. It’s certainly possible that Minuette 3 (green) is not complete and we continue higher first. That said, even if we get to Minute 3 (pink) at around 32.5 or below, Minute 5 (pink) can still be a strong wave to get us up to the 35-37 range near the top of the daily channel. Regardless of the current labeling, near the top of the daily channel is where I think GDX goes before a much bigger correction.
Thank you for the update Lara!!
By chance, is the bearish daily doji that formed for GDX today a concern at all? There’s always the discussion of which leads; Miners or Gold.
imo gold is unstoppable now. any kind of reversal candle / signal will just trick newcomers who want to “buy low sell high” into thinking that gold will reverse and short from there (and get stop loss honorably)
No, it’s not a concern. A doji on it’s own isn’t a reversal signal. And it has light volume.
actually you could apply an EW rule upon a doji: Wave 2 can never retrace beyond the beginning of wave 1.
imagine a doji, price open at 0.5, then move up to 1.0, and eventually drop to 0.1, finally close at 0.5.
VS
price open at 0.5, then drop to 0.1 (and wave 1 begins here), then move up to 1.0 (end of wave 1), and eventually close at 0.5 (wave 2 probably ends here, but should not drop below 0.1).
just examine the doji candle by switching to smaller timeframe and viola~~
In that case, it’s probably safer to place a trade if it’s the second scenario.
what do ya think?