
Downwards movement was expected from yesterday’s analysis.
Summary: While price remains within the narrow pink channel, then assume the short term downwards trend remains intact. If the channel is breached and if price moves above 1,330.01, then assume the upwards trend has most likely returned.
New updates to this analysis are in bold.
Last weekly charts are here.
Grand SuperCycle analysis is here.
DAILY ELLIOTT WAVE COUNT
Click chart to enlarge.
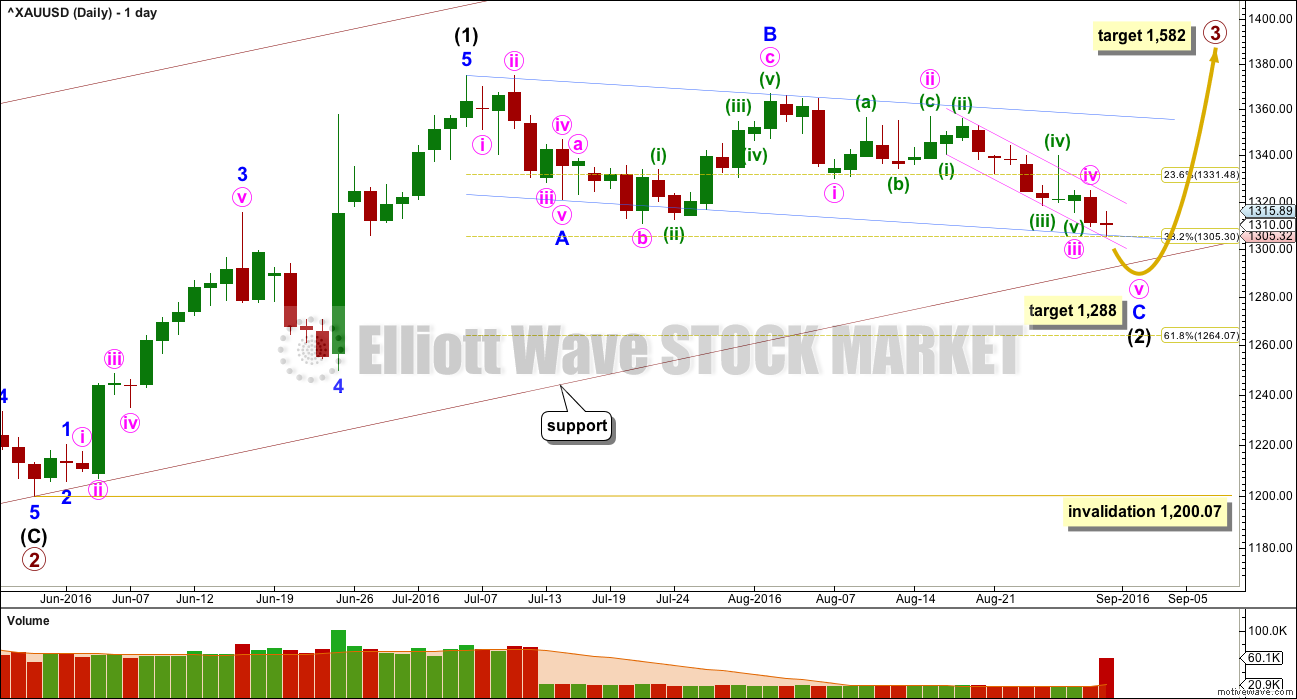
Primary waves 1 and 2 are complete. Thereafter, this wave count differs from the two alternates.
This main wave count will expect primary wave 3 to be longer than primary wave 1. Because this is very common, this is the main wave count and it expects the most common scenario is most likely. At 1,582 primary wave 3 would reach 1.618 the length of primary wave 1.
Only intermediate wave (1) so far is complete within primary wave 3. Intermediate wave (2) may be close to completion. It may find support at the lower edge of the base channel drawn about primary waves 1 and 2. Intermediate wave (2) may not move beyond the start of intermediate wave (1) below 1,200.07
Primary wave 3 may only subdivide as an impulse.
Minute wave iv should now be complete. A breach of the dark blue channel drawn about intermediate wove (2) would provide trend channel confirmation that intermediate wave (2) is over and intermediate wave (3) is underway.
At this stage, a new high above 1,330.01 could not be a continuation of minute wave iv, so at that stage minute wave iv and minor wave C would have to be over. A new high above 1,330.01 would provide strong confidence in a trend change and the resumption of the prior upwards trend.
At 1,288 minute wave v would reach equality in length with minute wave i. If this target is wrong, it may be slightly too high. Price may find strong support at the lower edge of the base channel; this trend line may stop price moving lower.
Intermediate wave (2) may not move beyond the start of intermediate wave (1) below 1,200.07.
Primary wave 2 lasted 56 days (one more than a Fibonacci 55). So far intermediate wave (2) is more brief in duration. It has lasted 40 days and may be just one or two days away from completion.
Keep the small narrow pink channel on daily and hourly charts. Draw a channel about intermediate wave (2) using Elliott’s technique for a correction (blue lines). Price is finding support at the lower edge. If this wave count is wrong, then it may be in expecting more downwards movement. The lower edge of this channel may stop price from falling further.
With this wave count expecting a third wave at two large degrees to begin very soon, look out for surprises to the upside at this stage.
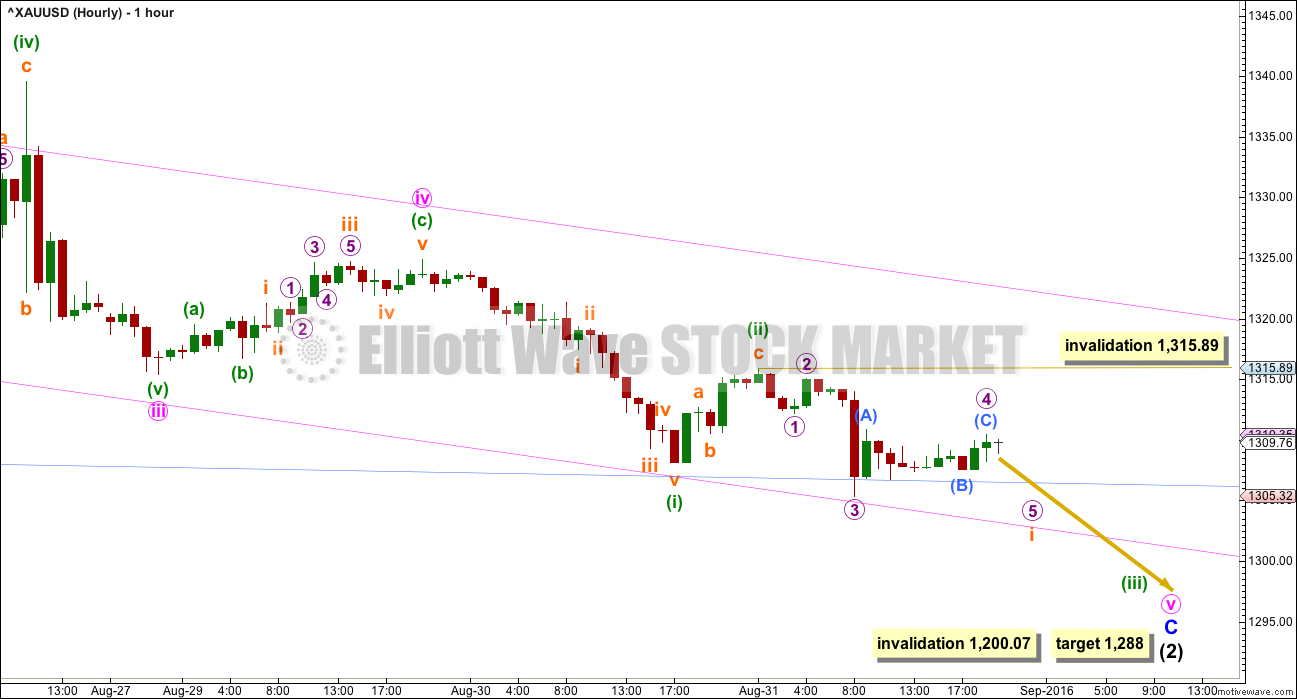
HOURLY ELLIOTT WAVE COUNT
Click chart to enlarge.
Minor wave C must subdivide as a five wave structure.
Within minor wave C, the structure may be still incomplete. Minute wave iv may have been a relatively brief and shallow zigzag exhibiting only alternation in depth with minute wave ii.
At 1,288 minute wave v would reach equality in length with minute wave i.
So far, for this main wave count, the structure within minute wave v looks incomplete. There is too much overlapping for the middle of its third wave to have passed. This wave count expects to see another one or two days of downwards movement.
Within minuette wave (iii), no second wave correction may move beyond the start of its first wave above 1,315.89.
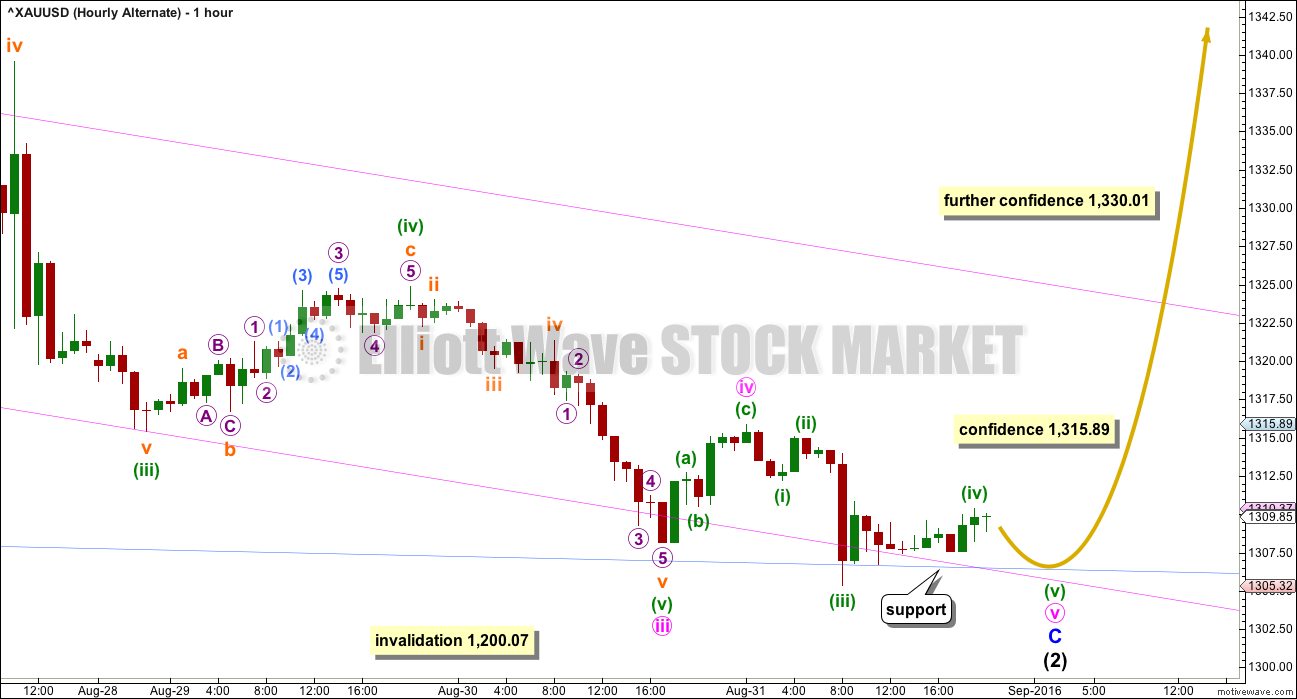
ALTERNATE HOURLY ELLIOTT WAVE COUNT
Click chart to enlarge.
This alternate is new.
It is possible that minute wave iv was over more recently as labelled. There is still only alternation in depth between minute waves ii and iv. Both are zigzags.
Minute wave iv may be very close to completion. It may end when price again touches the lower edge of the dark blue channel. After a final slight new low below the end of minuette wave (iii) at 1,305.32, then intermediate wave (2) could be over.
Thereafter, a breach of the narrow pink channel that contains recent downwards movement would provide some confidence in a trend change. A new high above 1,315.89 would provide first price confidence. A new high above 1,330.01 would provide stronger confidence. At that stage, upwards movement could not be a continuation of minute wave iv, so minute waves iv and v would have to be over.
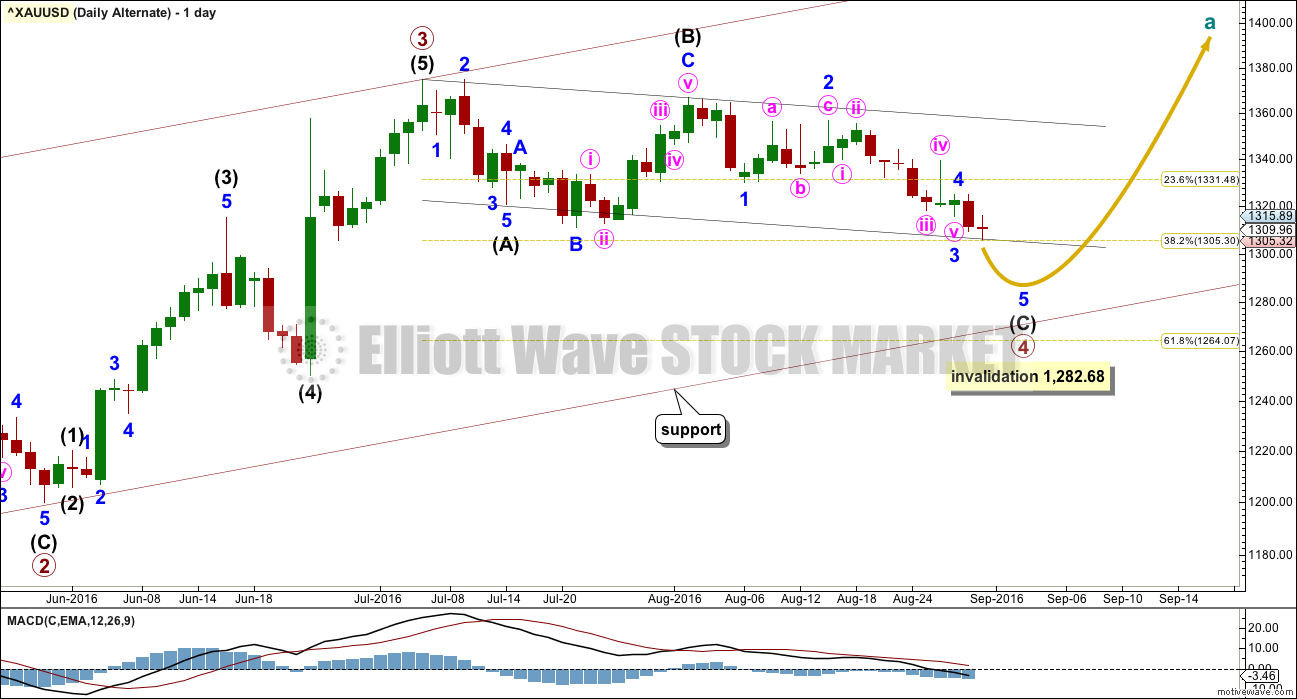
ALTERNATE DAILY ELLIOTT WAVE COUNT
Click chart to enlarge.
It is possible that primary wave 3 is over and shorter than primary wave 1. Primary wave 3 shows stronger volume than primary wave 1 (see technical analysis weekly chart).
If primary wave 3 is over, then the current consolidation for Gold would be primary wave 4.
Primary wave 2 was a relatively shallow 0.35 expanded flat correction. Primary wave 4 may be unfolding as a deeper zigzag which would exhibit perfect alternation.
Primary wave 4 may not move into primary wave 1 price territory below 1,282.68.
Primary wave 5 would be limited to no longer than equality in length with primary wave 3, so that the core Elliott wave rule stating a third wave may not be the shortest is met. Primary wave 5 would have a limit of 174.84.
This wave count expects more downwards movement to complete a five wave impulse for intermediate wave (C) in the same way as the main wave count expects a five wave impulse down to complete minor wave C. Only the degree of labelling differs; this wave count is one degree higher.
The hourly charts would be exactly the same except for the degree of labelling.
It is no longer possible for intermediate wave (4) to be a triangle. Within a contracting or barrier triangle, minor wave C may not move beyond the end of minor wave A. If intermediate wave (4) is labelled as a triangle, then minor wave A would be at the low of 1,310.84. The new low today to 1,305.82 invalidates this idea, so this may not be minor wave C.
TECHNICAL ANALYSIS
WEEKLY CHART
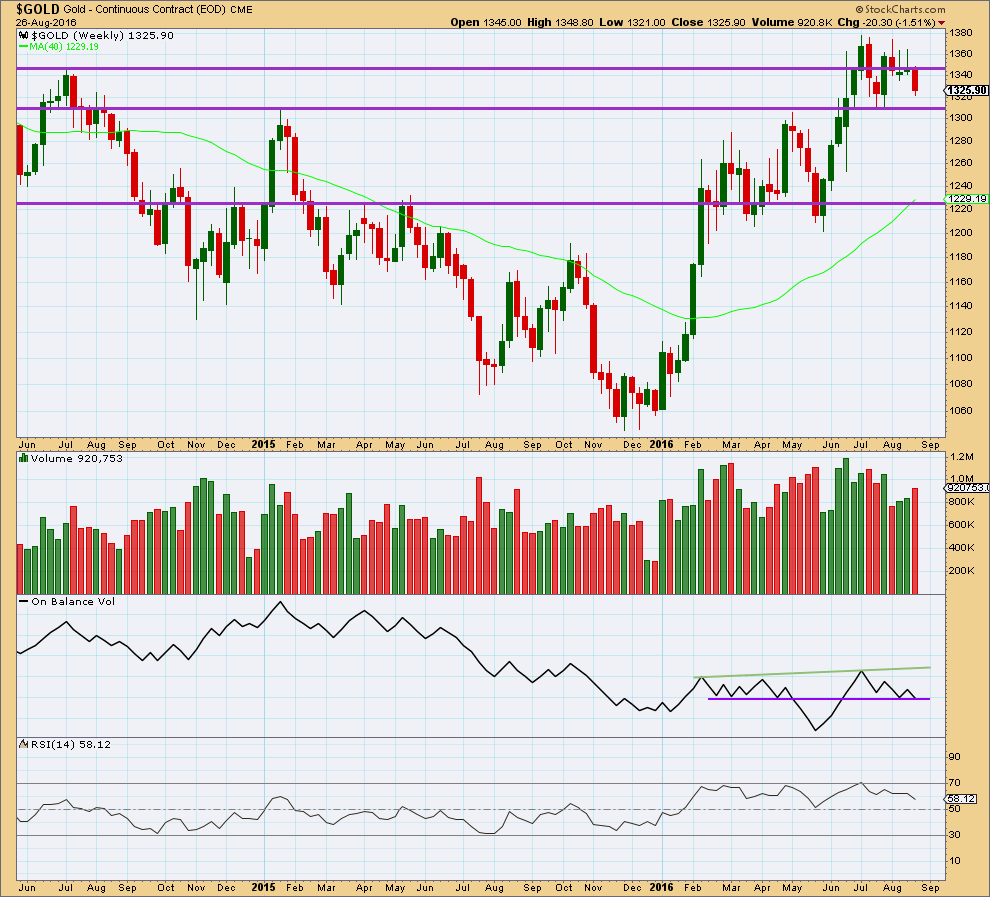
Click chart to enlarge.
A strong downwards week with an increase in volume supports the main and alternate III wave counts. Overall, volume is still declining and price remains range bound.
The prior two green weekly candlesticks had long upper shadows which was bearish.
Price may find some support about 1,310.
On Balance Volume at the end of last week has come down to find support at the purple trend line. This may help to stop price falling much further.
RSI is not extreme. There is some hidden bullish divergence with price and RSI: RSI has made a lower low below the low of 25th of July but price has made a higher low. This indicates some weakness to this downwards movement. It is more likely to be a smaller correction than a sustainable trend.
DAILY CHART
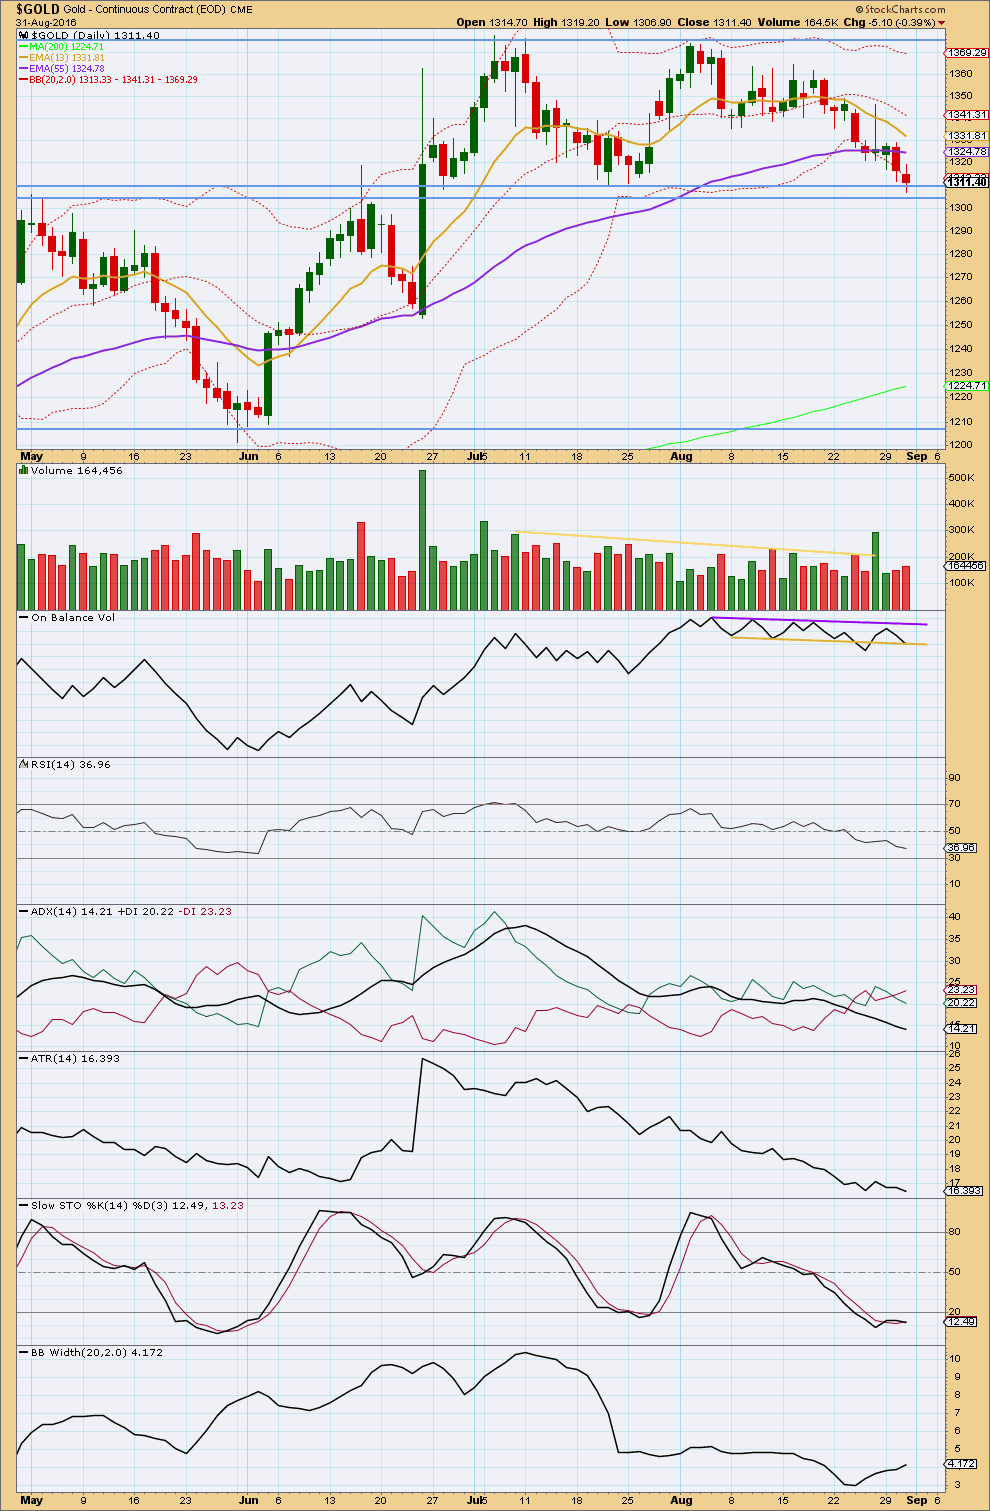
Click chart to enlarge.
Price is still range bound and today has reached support. During this range bound period, which began back on 7th of June, it is two upwards days of 8th of July and 26th of August that have strongest volume. This suggests an upwards breakout is more likely than downwards. This trick usually (not always) works well for Gold. This supports the Elliott wave counts.
Volume today is slightly stronger than yesterday, but it is still relatively light.
Price should be expected to find strong support about 1,310 to 1,305. This is an area of prior resistance and support.
On Balance Volume may be finding support today at the yellow trend line. A break below this yellow line would be a bearish signal, but only a weak one because this line has recently been weakened. A break above the purple line would be a bullish signal.
RSI is not yet extreme. There is room for price to fall further. There is no divergence today to indicate weakness between price and RSI.
ADX continues to decline indicating the market is not trending. The +DX and -DX lines continue to whipsaw about each other, typical of a consolidating market. ATR continues to agree as it too is declining.
No clear trend is evident. This downwards movement looks like a swing within a larger consolidation.
Stochastics is oversold and exhibits multi day divergence now with price. With price now at support, an end to this downwards swing would be a reasonable expectation. An upwards swing should be expected to begin about here.
Bollinger Bands are beginning to widen for five days in a row. A trend may be about to return.
The shorter term 13 day moving average is pointing downwards and price is below it. The short term trend is down. The mid term 55 day moving average has just turned and is also pointing downwards today. This indicates the mid term trend may have changed to down. The shorter 13 day average has not yet crossed below the mid term 55 day average yet though, so a trend change has not yet been indicated from up to down.
This analysis is published @ 09:32 p.m. EST.
[Note: Analysis is public today for promotional purposes. Member comments and discussion will remain private.]
Tsunami alert for East Coast of NZ.
Last time this happened… we went surfing
LOL
You’ve got nerves of steel to do that.
Hahahaha
Not really. The expected tsunami is only about half a foot. Quite pathetic really.
It’s more the thrill…. and being able to say “I surfed a Tsunami”
But not today folks. The Pacific Ocean down my way today is having an identity crisis again. It thinks it’s a lake 🙁 Completely flat. No surf for me today.
Which means I will have more time to do extra analysis for you all today 🙂
Yes and get a T-Shirt that says that, “I surfed a Tsunami” just don’t tell them the height of it.
And get a picture of a Giant Wave on the T-Shirt.
LOL 🙂
Lara have you ever done an EW analysis for the US dollar?
If possible could you consider doing the US dollar instead of Silver as the US dollar has huge effects on everything else including gold and miners?
It may also have higher volume than gold?
I’ll let you decide.
I have. My problem is getting data.
When I search BarChart’s forex feed I find “USD/All” but this is what the data looks like.
I have a count on the FXCM USD data, but it only holds data for a year or so. So the count can only be short term.
I’ll do Silvrer today, because there are some members waiting for it and paying for it.
and instead of updating US Oil I’ll look at updating US Dollar and publishing that.
Any time period for the US Dollar is fine, sort of curious between now and year end, whatever you come up with.
Will do Richard.
Will be later today, and I’ll see if I have time to do a special video too, for members only 🙂
BarChart data has a high for today at 1,314.46, and so the alternate has no confirmation yet. Price remains within the narrow pink channel.
Both wave counts will be essentially the same today. The alternate can now see the whole structure complete, as it did see a slight new low.
Yesterday I had to wait until 8:30pm EST for StockCharts volume data to be finalised 🙁 It was showing a big volume spike. I completed the analysis, refreshed my StockChart, and the spike disappeared. Which substantially changed the analysis.
So if there’s a volume spike again today… I may wait a little for that data to “settle”. Normally that happens about 6:30pm EST.
Today’s upwards day will be important if it has stronger volume than prior downwards days. That would support the hourly alternate.
If today’s upwards day with lighter volume that would support the main hourly EW count.
Hi Lara – GLD volume indicates it will be less than yesterday, although that can change before the close (not very likely though)
Overall, thevolume looks like it will not be particularity impressive on the upside today relative to the last few down days and the month overall
Thanks Eli.
Even though gold hit it’s day high at 11:04 pm of 1315.22 and now down a little at 1313.80 NUGT has been slowly been moving up after being extremely oversold down to 17.15 at 9:33 am the low since June 2nd.
NUGT hit it’s day high at 11:04 at 19.54 then 12:04 at 19.75 and just now at 1:05 pm at 19.80.
As I look at it, the low of 1302.53 represents the end of the correction for both alternates.
For the main count, this is most probably minuette 3 of Minute 5. There should be one last drop. Minute 5 so far looks like an ending diagonal as minuette 3 is less than minuette 1. Which means that the rise in price for minuette 4 can penetrate wave 1 territory.
Thanks Alan,
Since 10:00 am had a fired bullish Buy for NUGT and Gold 1,5,15, 39 minutes.
Let’s see if gold moves above 1315.89 ‘first price confirmation’ first before retracing today?
Hi Richard.
Lara’s 1315.89 is pmbull’s 1316.22, the highest point reached by minuette 2 in the main count.
At this point in time, it looks like the rise in price went as high as 1315.22 then turned down.
If my interpretation of the main count is correct, and there is no truncation, then the drop in price must reach below 1302.53.
A new low below 1305.32 then above 1315.89 is first price confidence of a trend change.
As per Lara’s gold feed gold already dropped down to 1302.93 low today.
http://www.barchart.com/quotes/forex/%5EXAUUSD
10:00 am US news shows Contraction so Gold jumps $5 in 5 minutes, miners move up
10:15am
Key manufacturing report slides into contraction territory, ISM says
10:04am
Gold turns higher after data show fall in August ISM manufacturing index
10:01am
Dollar trims gains against euro, yen after ISM manufacturing
10:01am
ISM manufacturing falls to 49.4% in August
http://www.marketwatch.com/story/key-manufacturing-report-slides-into-contraction-territory-ism-says-2016-09-01
I don´t like to open the home directory and look on open analysis. This is annoying to scroll down. I would prefer to have public analysis to be open as the private ones.
I just have a link open at EWG comments section so a click and refresh and see if # of comments changed.
Our comments are not open to the public they stay private.
It’s just this week Rafael.
Next week back to normal.
If I put it in the normal format then it wouldn’t be public. Then visitors and Google wouldn’t see it.
GANN Global – 10 minute video on $HUI and Gold.
Overview – they expect a bottom in $HUI is close and that the next leg up will last until next summer
http://www.gannglobal.com/webinar/2016/August/321gold/16-08-Video1.php
GDX very close to a bottom. Chart by EagleSeagle
Lara, curious why so many analysis recently open for free? I know it’s your prerogative, but 1 per week would be enough not to pay.
Lara sent out this email to members explaining the free content this week:
Dear Elliott Wave Gold Members,
This week for five days in a row I will be making the analysis public for promotional purposes.
The benefit to members this week will be you get a video analysis each day.
In acknowledgement of your continued support I will also be updating GDX again this week, it will be published for members only.
Member discussion and comments will remain private.
Kind regards,
Lara Iriarte CMT
Thank you!
The purpose is to boost the membership.
This is the first time I have made analysis available for free for a whole week.
The benefit to members during this exercise is you get daily video, not just once a week this week.
Next week things will return to normal. Analysis will be made free randomly, only once every 10 or so days.
which means… when I remember 🙂
Got it! I appreciate all of your hard work and joyful commentary!
Hi Lara,
could you also make one video from Oil? You are explaining everything so clear, it is much easier to understand for me then reading.
Sure.
I’ll do Silver today, and if I have the time I’ll do an extra update of Oil as well. Then a video of both.
That would be a bonus for members.
I’m very aware that the content you’re paying for is this week free, and so I want to offer something just for you to acknowledge your continued support 🙂
I’ve entered a buy on Gold. Picking where to set my stop is the hardest part of this trade. I’ve chosen to put it just below 1,280. If that price point is passed then the breach of the base channel would be very concerning and I would not want to be long anymore.
I’m risking only 5% of equity on this one trade.
I expect that volatility is going to return during the Non Farm Payroll report tomorrow. Gold may whipsaw, so I don’t want to be stopped out only to then see price go my way. So I’m giving this market room to move.
I’ll be fast asleep while it does that. Which is a good thing. Watching markets behave like that induces too much adrenaline and emotion for my liking 🙂
During NFP I expect Gold may move up strongly.
I did consider a hedge, but with volume so clearly stronger for upwards days I’m going to go with the TA here and just go long.
I have a little more confidence today in the regular TA than the smaller details on the hourly EW counts. There are just too many possibilities. It could all be over already.
Is the NFP tomorrow or Friday?
FRIDAY, SEPT. 2
8:30 am EST US Non farm payrolls Aug. 185,000 255,000
http://www.marketwatch.com/Economy-Politics/Calendars/Economic
🙂 Thanks Richard.
I’m off to get some sleep now.
Good luck everybody!