
Last week’s analysis expected downwards movement and an increase in momentum. This is exactly what has happened.
Summary: A short term target is at 37.91 for a brief bounce and a mid term target is at 35.27 for a slightly more time consuming bounce. The trend is down and the structure is incomplete, so expect price to keep moving lower for this next week.
New updates to this analysis are in bold
MONTHLY ELLIOTT WAVE COUNT
Click chart to enlarge.
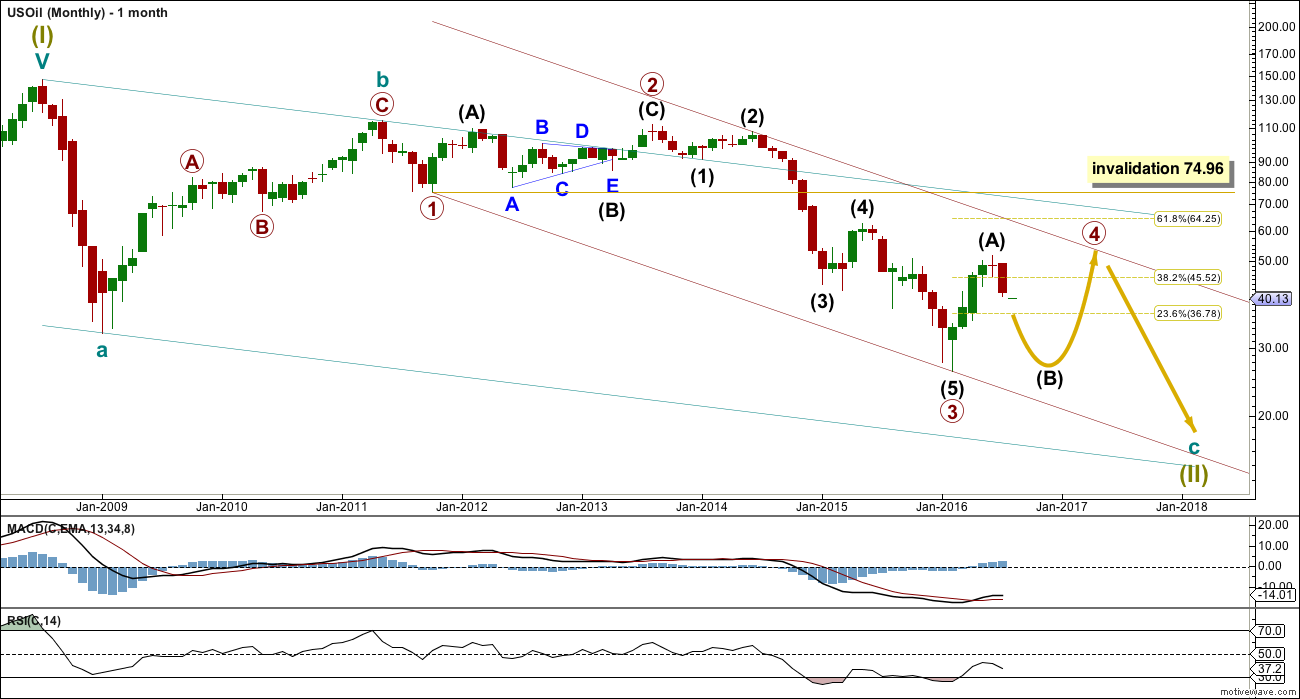
Within the bear market, cycle wave b is seen as ending in May 2011. Thereafter, a five wave structure downwards for cycle wave c begins.
Primary wave 1 is a short impulse lasting five months. Primary wave 2 is a very deep 0.94 zigzag lasting 22 months. Primary wave 3 is a complete impulse with no Fibonacci ratio to primary wave 1. It lasted 30 months.
Primary wave 4 is likely to exhibit alternation with primary wave 2. Primary wave 4 is most likely to be a flat, combination or triangle. Within all of these types of structures, the first movement subdivides as a three.
Primary wave 4 is likely to end within the price territory of the fourth wave of one lesser degree; intermediate wave (4) has its range from 42.03 to 62.58.
Primary wave 4 may end if price comes up to touch the upper edge of the maroon channel. The upper edge of this channel has been pushed up to sit on the end of intermediate wave (2) within primary wave 3.
Primary wave 4 is most likely to be shallow to exhibit alternation in depth with primary wave 2. So far it has passed the 0.382 Fibonacci ratio at 45.52. It may now move mostly sideways in a large range.
Primary wave 4 may not move into primary wave 1 price territory above 74.96.
DAILY ELLIOTT WAVE COUNT
Click chart to enlarge.
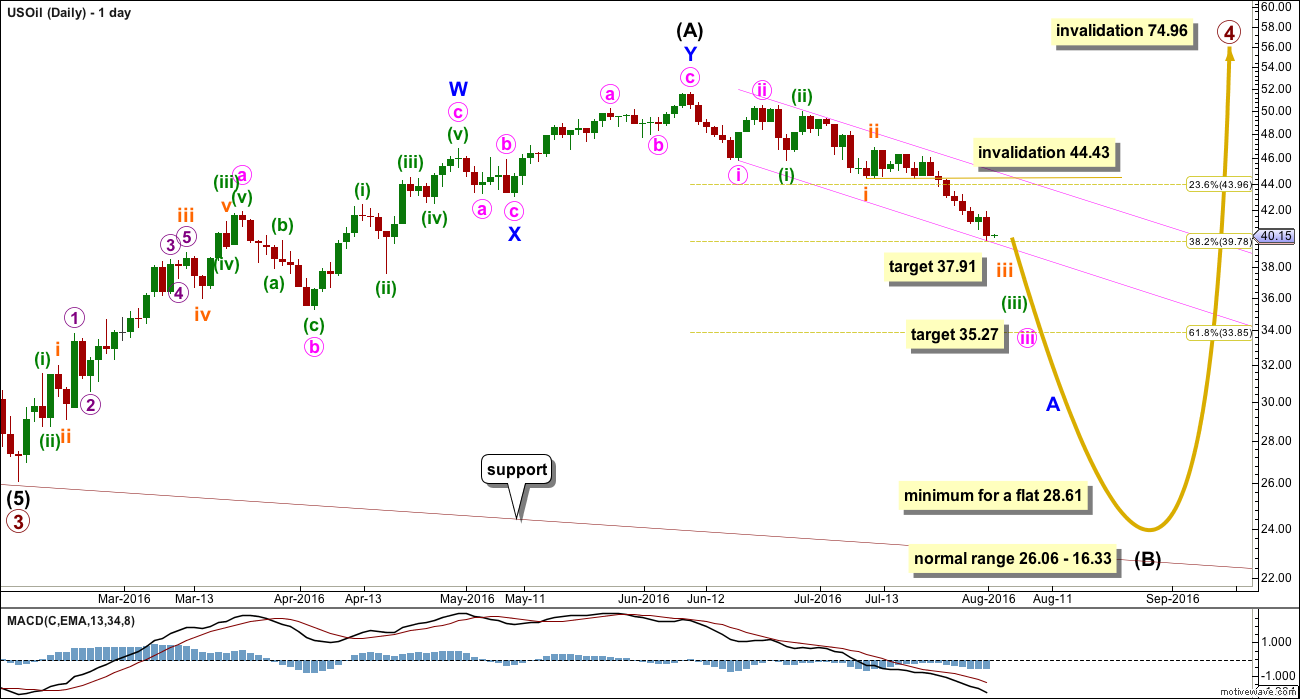
Intermediate wave (A) may be complete as a double zigzag.
If intermediate wave (A) is a three, then intermediate wave (B) is most likely to be a very deep correction. It may make a new low below the start of intermediate wave (A) at 26.06.
If primary wave 4 is to be a flat correction, then intermediate wave (B) must be a minimum 0.9 length of intermediate wave (A) at 28.61. The normal range for intermediate wave (B) would be 1 to 1.38 the length of intermediate wave (A) at 26.06 to 16.33.
If primary wave 4 is to be an expanded flat correction, then intermediate wave (B) should be 1.05 the length of intermediate wave (A) or longer, at 24.78.
If primary wave 4 is to be a triangle, then intermediate wave (B) has no minimum nor maximum. It must only subdivide as a three wave structure. It may make a new low below the start of intermediate wave (A) at 26.06 as in a running triangle.
Primary wave 4 may not move into primary wave 1 price territory above 74.96.
Intermediate wave (B) may be any of more than 23 possible corrective structures. It would most likely be a single or multiple zigzag in order to be a deep correction. It may also be an expanded flat to be deep. It may find support at the lower edge of the maroon channel.
Minor wave A is unfolding as an impulse. Within minor wave A, the middle is unfolding. At 37.91 subminuette wave iii would reach 1.618 the length of subminuette wave i. When subminuette wave iii is complete, then a small correction lasting one to a very few days should unfold sideways / upwards for subminuette wave iv, which may not move into subminuette wave i price territory above 44.43.
At 35.27 minute wave iii would reach 2.618 the length of minute wave i.
Draw a best fit acceleration channel about this downwards movement, and keep redrawing the channel as price moves lower. The upper edge may provide resistance to upcoming corrections along the way down.
When the middle of the third wave is complete, then a series of fourth wave corrections should unfold and be followed by fifth waves down.
When minor wave A is a complete five wave structure, then minor wave B should begin. As a B wave within a B wave, it is likely to be complicated and time consuming. Oil may then move into a consolidation. Trading this market when a B wave within a B wave unfolds should be avoided.
ALTERNATE DAILY ELLIOTT WAVE COUNT
Click chart to enlarge.
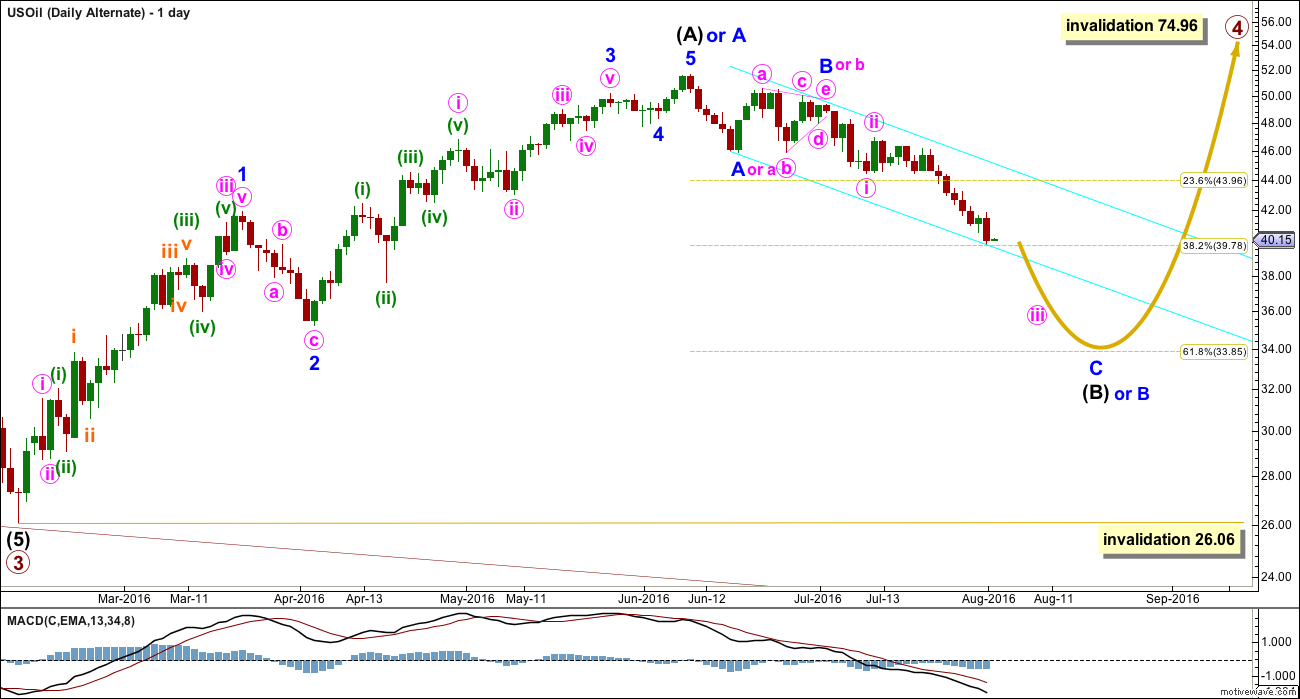
Primary wave 4 may be unfolding as a zigzag, or a zigzag upwards may be almost complete for intermediate wave (A) (as per alternate labelling on this chart).
It is possible that only minor wave A is a five wave structure complete upwards and minor wave B down is unfolding. If minor wave B is a flat correction or running triangle, then within it minute wave b may make a new high. There is no upper invalidation point for this wave count this week for this reason.
This wave count looks forced mostly because the triangle of minor wave B or minute wave b does not look right. It comes to too quick an end and the trend lines are too steep for a normal look. But it remains valid because no Elliott wave rules are broken and all guidelines are reasonably met.
If intermediate wave (B) or minor wave B is still moving lower, then it may end about the 0.618 Fibonacci ratio of intermediate wave (A) or minor wave A upwards, about 33.85.
If intermediate wave (A) or minor wave A is a five wave structure, then intermediate wave (B) or minor wave B may not move beyond its start below 26.06.
TECHNICAL ANALYSIS
DAILY CHART
Click chart to enlarge. Chart courtesy of StockCharts.com.
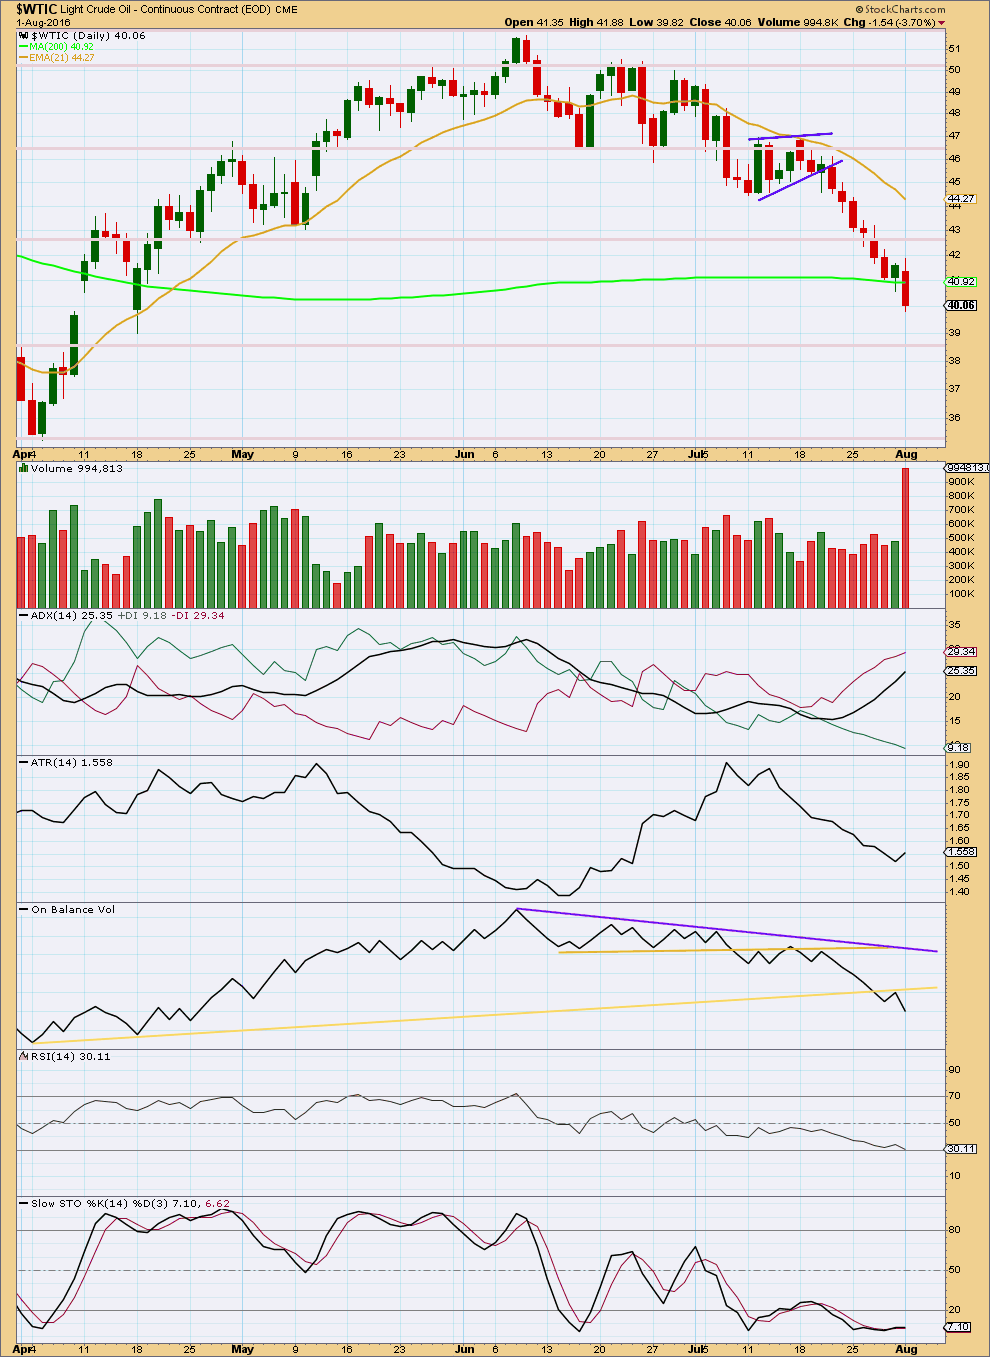
The small flag pattern correctly indicated a continuation of the downwards trend. Using the measured rule, a target of about 39.95 is indicated. That target is now very close.
Overall, volume increases as price falls (the volume spike for the last daily candlestick is suspicious; it may be gone from StockCharts data soon). The fall in price has support from volume. This supports the Elliott wave count; third waves should have support from volume.
ADX is clear this week. It is increasing and the -DX line is above the +DX line. ADX indicates a downwards trend is in place for Oil at this time.
However, ATR disagrees as it is overall declining. There may be something wrong with this trend. Normally, a healthy trend sees ATR increase. This makes sense in terms of the Elliott wave count which expects this downwards wave may be a B wave. There is something wrong with B waves; they are suckers and caution is advised.
On Balance Volume is bearish with breaks below both the all its trend lines. Resistance is now at the lower yellow line.
RSI is not yet oversold. There is room for price to fall further.
Stochastcis is oversold but this oscillator may remain extreme for reasonable periods of time during a trending market. Stochastics is beginning to indicate some divergence with price, so this indicates caution. The trend may be weakening. However, divergence was noticed a week ago and did not predict an end to this trend. Divergence indicates weakness but cannot signal an end to the prevailing trend.
This analysis is published @ 01:50 a.m. EST.
Hi Lara, really highly interested in your Tuesday update,… looking forward to get it soon
Thanks Ursula
from Hs Dent newsletter: http://www.dentresearch.com/
Oil has been crashing again from its bounce off $26 in February 2016. The smart money is still heavily net short 285,000 contracts versus 275,000 net long for the dumb money, which means they see more to come on the downside ahead.
I’m now more adamant than before that we’ll see oil as low as $10 to $20 a barrel before all is said and done. Declining oil prices mean that the frackers are dead and will trigger major junk bond defaults as another trigger for the next financial crisis.
The smart money is also heavily short the CRB or broader commodity index, while the dumb money is heavily long. This means that commodities – as beat down as they are by the slowing of China – likely have more downside to come, and sooner than later.
Also chart from Jack
https://www.tradingview.com/u/tntsunrise/
Is there an alternative count that suggets a bottom is in on Oil? The bounce so far seems so strong.
Thanks
Is oil in wave iv correction after 3 waves iii’s done???
What is target for wave A ???
Building on Lara’s Main count, here’s my count for where we are today. I think that the latest uptick is Micro 4 of Subminuette iii, so there is still more downside ahead.
Lara, Any chance you could add the lower support line of this long term channel to your next analysis? Seems like it may be “live” with 2 touches.
Maybe it acts as support for Primary 4 and then Primary 5 overshoots the channel. A downside overshoot would provide nice symmetry with the upside overshoot back in 2008. Just a theory.
Lara,
Thanks for this spot on analysis. I’m cautiously optimistic about this downtrend, and enjoying the ride down!